
Articles
- Page Path
- HOME > J Prev Med Public Health > Volume 54(6); 2021 > Article
-
Original Article
Associations Between Parental Depression and Early Childhood Development in Indonesia: A Cross-sectional Study -
Ika Saptarini
 , Anissa Rizkianti, Prisca Petty Arfines, Suparmi, Iram Barida Maisya
 -
Journal of Preventive Medicine and Public Health 2021;54(6):451-460.
DOI: https://doi.org/10.3961/jpmph.21.158
Published online: November 10, 2021
Centre for Research and Development of Public Health Efforts, National Institute of Health Research and Development (NIHRD), Jakarta, Indonesia
- Corresponding author: Ika Saptarini Centre for Research and Development of Public Health Efforts, National Institute of Health Research and Development (NIHRD), Jakarta 10560, Indonesia E-mail: dr.ikasaptarini@gmail.com
Copyright © 2021 The Korean Society for Preventive Medicine
This is an Open Access article distributed under the terms of the Creative Commons Attribution Non-Commercial License (http://creativecommons.org/licenses/by-nc/4.0/) which permits unrestricted non-commercial use, distribution, and reproduction in any medium, provided the original work is properly cited.
ABSTRACT
-
Objectives
- This study aimed to determine the associations between parental depression and early childhood development among children aged 36 months to 59 months in Indonesia.
-
Methods
- From Indonesia’s Basic Health Survey (RISKESDAS) 2018, this study included 6433 children aged 36 months to 59 months and their parents. Maternal and paternal depression was examined using the Mini International Neuropsychiatric Interview survey instrument, which was previously translated into Indonesian. The study also used the Early Child Development Index to measure child development and its 4 domains (cognitive, physical, socio-emotional, and learning). Multivariate logistic regression analysis was performed to determine the association between parental depression and early childhood development.
-
Results
- Overall, 10.3% of children aged 36 months to 59 months were off-track for development. After adjusting for biological, parental, and social characteristics, children born to parents with depression were found to be 4.72 times more likely to be off-track for development (95% confidence interval, 1.83 to 12.15).
-
Conclusions
- Children of depressed parents were more likely to be off-track for development. The findings highlight the need for early diagnosis and timely intervention for parental depression to promote early childhood development.
- Keywords: Parental depression, Child development, Early Child Development Index, Indonesia
- The early years of life are critical for child development, including for children’s cognitive skills and social, emotional, and physical development. Children develop age-specific core cognitive skills, such as understanding, the ability to follow directions, communication skills, and the ability to progressively solve more complex problems, in the first 5 years of life. These abilities are crucial for achieving later developmental milestones and ensuring mental and physical health as well as the child’s optimal development. Optimal development is essential for children to become economically successful and productive as they grow up [1,2]. In addition, childhood development has been deemed a global indicator in the Sustainable Development Goals (SDGs). One of the aims of the SDGs is to increase the proportion of children aged 24 months to 59 months who are developmentally on-track in terms of health, learning, and psychosocial well-being (indicator 4.2.1) [3]. However, more than 43% of children under 5 years old (over 200 million children) are estimated to fail to achieve age-specific development milestones due to malnutrition, inadequate stimulation, and other risk factors associated with poverty [4]. Delays in childhood development occur when children do not reach developmental milestones at the expected age for each functional dimension [5].
- Another important risk factor for delays in childhood development is parental depression. In Indonesia, there has been a serious increase in the prevalence of mental health issues in recent decades. The prevalence of mental health disorders has increased substantially from 6.0% in 2013 to 9.8% in 2018 [6,7]. Becoming a parent often causes physiological distress, which in turn affects childhood development outcomes. Parental distress may reduce the quality of parenting and increase stress in children [8]. Previous studies have found that parental depression increases children’s neurodevelopmental, behavioral, emotional, and psychiatric problems [9-11]. In addition, despite extensive evidence on the effects of maternal depression on children, few studies have examined paternal depression [12]. Paternal depression also has significant adverse effects on children; for example, negative effects from depression-related child abuse were observed in a study from Japan [13]. In addition, a prospective study found a significant association between paternal depression and adverse behavioral and emotional outcomes in children aged 3.5 years old and an increased risk of behavioral problems in boys [14].
- Given the essential role of parents in childhood development, this study aimed to examine the association between parental depression and early childhood development using data from a large, nationally representative sample. This study expanded on previous studies by evaluating depression in both parents using a standardized screening tool to better understand the different effects of parental depression on childhood development outcomes.
INTRODUCTION
- Study Design and Sample
- This study used cross-sectional data from the 2018 Indonesia Basic Health Survey (RISKESDAS), a nationally representative household survey conducted by the National Institute of Health Research and Development (NIHRD), Ministry of Health, covering 300 000 households in 34 provinces and 514 districts in Indonesia. The study sample in the 2018 RISKESDAS was selected based on 2010 population census blocks using multi-stage cluster random sampling. More detailed information on the sampling methods can be found elsewhere [6].
- The analysis in this study used only 6443 children aged 36 months to 59 months and their parents due to the availability of data. We combined household, child, and parental information with complete matching data for household, child, and parental factors. Information on children was gathered through interviews with their parents or caretakers [6]. This information was needed to understand children’s early educational development, the level of care they received, and the quality of childcare provided by parents until the children were ready to enter primary education.
- Variables
- Early childhood development in children aged 36 months to 59 months was measured using the Early Child Development Index (ECDI), which is a 10-item instrument that covers 4 developmental domains, and responses are provided by children’s mothers or caregivers. The internal consistency for combining the 10 items before further dichotomization in this study was fair, with a Cronbach’s alpha of 0.64. The 4 domains of the ECDI are defined as follows: First, language/cognitive ability is tested by asking children to identify/name at least 10 letters of the alphabet, read at least 4 simple/popular words, and recite the names and recognize the symbols of all numbers from 1 to 10. Children are considered on-track for development if they test positively for at least 2 items. Second, physical ability is tested by asking children to pick up items with 2 fingers and by asking the caregiver if the child is sometimes too sick to play. Children are considered on-track for development if they test positively for at least 1 item. Third, socio-emotional development is determined by asking children’s parents or guardians if their children get along well with other children; if the children do not kick, bite, or hit other children; and if the children are not easily distracted. Children are considered on-track for development if positive answers are recorded for at least 2 items. Fourth, learning development is determined by asking parents or guardians if their children can follow simple directions on how to do something correctly and if their children are able to do it independently. Children are considered on-track for development if a positive answer is recorded for at least 1 item. Children were then classified into 2 categories according to methods outlined by the United Nations Children’s Fund. A child is considered to be on-track for development if he or she receives a positive score in 3 or more of the 4 domains of the ECDI and off-track for development if he or she receives a positive score in fewer than 3 of the domains [15,16].
- We defined parental depression as concurrent paternal and maternal depression. In the 2018 RISKESDAS, symptoms of depression were assessed using the Mini International Neuropsychiatric Interview (MINI) mental health survey instrument, which had been previously translated into Indonesian. The MINI is a screening tool for the clinical assessment of depressive patients that has been widely used in other similar studies [17,18]. MINI modules include yes-or-no questions about any symptoms of depression or anxiety disorders experienced within the previous 2 weeks. Mental disorders are classified using a predetermined algorithm rather than a scoring system. In this study, the parents were first asked 3 screening questions: (1) if they felt sad most of the day almost every day for the previous 2 weeks, (2) if they had lost interest in activities they previously found pleasing, and (3) if they felt tired most of the time. If parents responded “yes” to at least 2 of the screening questions, they were then asked 7 additional questions about symptoms of depression such as changes in appetite, difficulty sleeping, persistent tiredness, feelings of worthlessness, difficulty concentrating, and suicidal ideation. Parents who answered “yes” to at least 2 of the screening questions and 2 of the additional questions met the criteria for depression [19]. Parental depression was divided into 4 categories: non-depressed, maternal depression only, paternal depression only, and parental depression (both the mother and father).
- We adjusted for biological, parental, and social variables to examine the association between parental depression and childhood development. The biological variables were genetic, hormone, and sex-related variables and included the child’s age (3 or 4 years old), the child’s sex (male or female), birth order (1, 2, or ≥3), birth weight (≥2500 or <2500 g) and the child’s nutritional status (stunted or normal). Parental and social variables included the residence type (rural or urban), mother’s age (≤25, 26-35, 36-45, or >45 years old), the education level of both the mother and father (low, middle, or high), the work status of both the mother and father (unemployed, civil/private employer, entrepreneur, laborer, or other), economic status (lower, lower-middle, middle, upper-middle, or upper), and morbidity for both the mother and father (yes or no). Economic status was determined based on household expenditures, including food and non-food expenditures, and was ranked based on the household wealth index using quintiles from the lowest status level (Q1) to the highest (Q5). Parental morbidity was defined as any chronic condition experienced by the mother or father, including cancer, heart disease, and diabetes mellitus.
- Statistical Analysis
- All statistical analyses were performed using Stata SE version 15.1 (StataCorp., College Station, TX, USA), considering the complex survey sampling design, including stratification, cluster sampling, and sample weights. Descriptive analysis was conducted to determine the characteristics of the respondents. Multivariate logistic regression analysis was performed to determine the association between parental depression and childhood development after being adjusted for confounding factors using a significance level of 0.05. The adjusted odds ratios (aORs) were reported with their respective 95% confidence intervals (CIs). We used 3 logistic regression models to determine the association between parental depression and childhood development. First, we tested the association between parental depression and childhood development in model 1 by comparing the effect of exposure to parental depression on childhood development. In addition, we examined the biological factors associated with child development in model 2 by adding biological factors such as the child’s age, sex, birth order, birth weight, and nutritional status, and subsequently included all parental and social factors (residence type, mother’s age, the education level of both parents, and the work status of both parents) in the final model (model 3).
- Ethics Statement
- Ethical approval for the 2018 RISKESDAS was granted by the National Ethics Commission on Health Research, NIHRD, Ministry of Health (No. LB.02.01/2/KE.267/2017). Written informed consent was obtained from all of the individual participants included in the survey. For infants and young children under the age of 15 years old, consent was provided by a parent or guardian.
METHODS
Early childhood development
Parental depression
Confounding variables
- Characteristics of Respondents and Child Development
- Data on the characteristics of the respondents are shown in Table 1. Of the 6443 children aged 36 months to 59 months, a total of 10.3% were off-track for development. The percentage of children who were developmentally off-track was significantly higher for children with parents who had low maternal (12.5%) and paternal (13.1%) education levels, children whose mothers did not work (11.2%), children whose fathers were laborers (12.5%), children from families whose economic status was “lower” (13.9%), and children whose mothers had chronic diseases (19.4%). The percentage of children who were developmentally off-track was also higher among children who were younger (12.9%), male (12.6%), and who were third or more children (12.5%).
- The Prevalence of Off-track Development According to Parental Depression
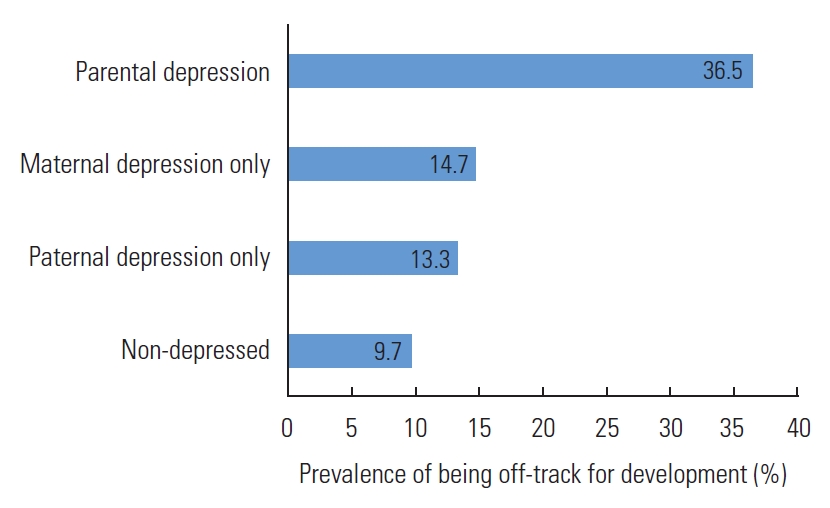
- This study found that the rate of maternal depression was only 5.0%, followed by a 3.2% rate of paternal depression and a 1.0% rate of overall parental depression (Supplemental Material 1). According to Figure 1, the percentage of being offtrack for development was significantly higher among children whose parents suffered from depression (36.5%) than children of non-depressed parents (9.7%). Moreover, less than 20% of children with depressed mothers or fathers were developmentally off-track (14.7 and 13.3%, respectively).
- The association between parental depression and the development of children aged 36 months to 59 months is shown in Table 2. The unadjusted model (model 1) showed a significant association between parental depression and their children being off-track for development, as determined by the ECDI. Model 1 showed that the likelihood of being off-track for development was 62% higher among children of depressed mothers than among children of non-depressed mothers and fathers. When both the mother and the father experienced depression, their children were 5 times more likely to be off-track for development than the children of mothers and fathers who did not experience depressive symptoms. After adjusting for biological, parental, and social variables, the magnitude of the effect of overall parental depression on childhood development decreased from an OR of 5.38 (95% CI, 2.12 to13.68) to an aOR of 4.72 (95% CI, 1.83 to 12.15), as shown in the final model. However, the likelihood of children with a depressed mother only or a depressed father only being off-track for development was not statistically significant.
RESULTS
- Our study findings suggest that parental depression was significantly associated with children being off-track for development. Children aged 36 months to 59 months with mothers and fathers who experienced depression had a higher likelihood of being off-track for development than children whose parents did not experience depression. Previous studies have similarly found that parental depression had a negative association with childhood outcomes. For example, a longitudinal study from England found that parental depression negatively affected children’s language development [12]. Another study from England also found that parental depression significantly impacted temperament disturbances in children [20]. In contrast, other studies failed to identify a significant association between parental depression and child development. Instead, they have suggested that childhood development was most affected by the severity, persistence, and recurrence of parents’ depressive symptoms [21,22].
- There are various ways in which parental depression can directly and indirectly affect children’s developmental outcomes. Paternal depression, for example, can affect a child’s development due to family dysfunction and frequent conflict between parents which may also influence maternal depression. In addition, maternal depression could directly alter the brain development of children during the mother’s pregnancy. Furthermore, parental depression has been found to be associated with inadequate stimulation or engagement in play and communication activities that enable children to learn and interact with others. Depressed mothers or fathers also tend to have impaired parent-child interactions and attachment. It can thus be inferred that providing activities and opportunities for play and conversation, responding to children’s signals, and teaching specific skills by parents has a significant influence on early child development. Nevertheless, earlier studies have found that cognitive sequelae in children of parents with psychiatric disorders, including depression, tended to be minor or absent [23,24].
- In the first 5 years of life, executive functions such as memory, flexibility, and creativity develop rapidly. During this period, nurturing care is an essential foundation for early childhood development. Nurturing care refers to the creation of a stable environment by parents and other caregivers to ensure good health and nutrition in children, protect them from threats, and provide children with opportunities for early learning through supportive and emotionally responsive interactions. The quality of interactions between parents and children is influenced by the physical and mental conditions of parents. Parents who have symptoms of depression tend to have symptoms that include dysphoric moods, fatigue, anorexia, sleep disturbances, anxiety, excessive guilt, and suicidal thoughts. Depressive symptoms compromise the dyad’s capacity to mutually regulate interactions through 2 interactive patterns, intrusiveness and withdrawal. Intrusiveness in parents tends to have an adverse effect on children and can disrupt children’s activities [25].
- Furthermore, our study found that paternal depression had different effects depending on the child’s sex. In general, the effect of parental depression on delayed child development was greater for boys than girls. Although the underlying reasons remain unclear, there are possible neurobiological underpinnings to behaviorally documented differences in child development by sex. Many studies on early childhood development have identified a greater capacity for verbal performance in girls. Girls appear to have an advantage over boys in terms of the functional organization of the brain related to communication and language development [26]. In addition, boys have generally been found to achieve motor, cognitive, and socio-emotional development milestones at a slower pace than girls [27]. Other preliminary evidence has shown that the different impacts of parental depression on early childhood outcomes may be due to differences in the way parents interact with and socialize their children based on sex [28,29].
- Another important finding of this study was that maternal and paternal education affected child development differently. While the likelihood of being off-track for development was lower for children whose mothers had a low education level than those whose mothers had a high education level, the likelihood of being off-track for development was higher for children whose fathers had a low education level than children whose fathers had a high education level. There is a large body of literature explaining the importance of fathers on economic and social roles in the family [28-30]. Lamb et al. [31] developed a widely used model conceptualizing 3 different categories of parental involvement with children: (1) interaction, which refers to one-on-one interaction with the child, such as feeding, playing, or reading; (2) accessibility, which refers to the parent’s availability to the child, including indirectly; and (3) accountability, which refers to the degree to which parents take responsibility for the child’s care and welfare. Fathers typically take on the role of providing for the family economically and often work outside of the home to earn a living for the family. In contrast, mothers tend to be the primary caregivers who care for and meet the needs of their children [30-32]. Thus, it is possible that parents with a high education level are more engaged in various types of occupations than parents with a low education level (Supplemental Material 2). Mothers with a low education level may more frequently interact with their children in a way that contributes to improved early childhood development. Fathers with a high education level may also have better accessibility when it comes to childhood development. Thus, this evidence suggests that the association between the education level of parents and childhood development is mediated by the degree of parent-child involvement in the family.
- The results of this study should be considered in the context of its limitations. First, future studies should use a different clinically validated instrument to measure depression in order to obtain a higher level of diagnostic accuracy. This was not possible in this study since the instrument we used only covered symptoms experienced within the 2 weeks prior to the survey and did not take into account the severity of symptoms. In addition, the MINI includes only yes-or-no questions, and respondents had to select one or the other even when there was no obvious yes-or-no answer. The MINI has some advantages, however. It is conducted using a short, simple, straightforward, and easy-to-administer research interview that is both shorter than a typical research interview and more comprehensive than a screening test. The MINI also helps patients who need a more thorough investigation to obtain an accurate diagnosis. Moreover, the MINI eliminates the need for two-stage interviews in population-based mental health epidemiological surveys since it provides diagnostic categories that are compatible with the 10th edition of the International Classification of Diseases [17,33,34].
- Another limitation of this study is that it did not include children of single parents, for whom the impact of parental depression may be different than for children raised in a nuclear family. In addition, our findings could not be used to determine causality due to the nature of the study design. Parental depression may delay a child’s development, but a child’s development could also affect parental depression. Despite these limitations, this study used a large, nationally representative sample that provided reliable data on the effect of paternal depression on childhood development at the national level. The inclusion of fathers in the analysis, whom previous studies have tended to exclude, provides more data in an even broader context.
- Overall, our study findings highlight the need to diagnose and treat both maternal and paternal depression to maintain optimum childhood development. Parents and future parents who are at risk of depression should receive treatment before the onset of depression to prevent the negative influence of parental depression on their children’s development later in life. Furthermore, parents could benefit from a screening program for depression during the antenatal and postnatal periods. In addition, parenting counseling that helps parents better understand their parenting style and overcome their personal issues at home in order to improve the quality of their childcare should be more readily available.
DISCUSSION
SUPPLEMENTAL MATERIALS
Supplemental Material 2.
-
CONFLICT OF INTEREST
The authors have no conflicts of interest associated with the material presented in this paper.
-
FUNDING
None.
Notes
ACKNOWLEDGEMENTS
-
AUTHOR CONTRIBUTIONS
Conceptualization: IS, S, AR. Data curation: IS. Formal analysis: IS. Funding acquisition: None. Methodology: IS, S. Visualization: IS, AR, PPA, Writing – original draft: IS, AR, PPA, S, IBM. Writing – review and editing: IS, AR, PPA, S, IBM.
Notes
| Variables |
Likelihood of delayed development1 |
||||
|---|---|---|---|---|---|
| Model 1 | Model 2 | Model 3 | |||
| OR (95% CI) | aOR (95% CI) | aOR (95% CI) | |||
| Exposure variable | |||||
| Depression | |||||
| Non-depressed | 1.00 (reference) | 1.00 (reference) | 1.00 (reference) | ||
| Maternal depression only | 1.62 (1.03, 2.53)* | 1.54 (0.97, 2.43) | 1.44 (0.90, 2.30) | ||
| Paternal depression only | 1.44 (0.80, 2.61) | 1.46 (0.82, 2.61) | 1.32 (0.75, 2.33) | ||
| Depression of both parents | 5.38 (2.12, 13.68)*** | 5.36 (2.21, 12.99)*** | 4.72 (1.83, 12.15)*** | ||
| Biological factors | |||||
| Child’s age (y) | |||||
| 3 | - | 1.00 (reference) | 1.00 (reference) | ||
| 4 | - | 0.61 (0.48, 0.77)*** | 0.60 (0.47, 0.76)*** | ||
| Child’s sex | |||||
| Male | - | 1.68 (1.33, 2.11)*** | 1.68 (1.34, 2.12)*** | ||
| Female | - | 1.00 (reference) | 1.00 (reference) | ||
| Birth weight (g) | |||||
| ≥2500 | - | 1.00 (reference) | 1.00 (reference) | ||
| <2500 | - | 1.13 (0.73, 1.77) | 1.06 (0.67, 1.68) | ||
| Child’s nutritional status | |||||
| Stunted | - | 1.15 (0.91, 1.45) | 1.03 (0.81, 1.31) | ||
| Normal | - | 1.00 (reference) | 1.00 (reference) | ||
| Birth order | |||||
| 1 | - | 1.00 (reference) | 1.00 (reference) | ||
| 2 | - | 1.02 (0.78, 1.35) | 1.10 (0.75, 1.60) | ||
| ≥3 | - | 1.20 (0.91, 1.60) | 1.25 (0.83, 1.87) | ||
| Parental and social factors | |||||
| Type of residence | |||||
| Rural | - | - | 0.92 (0.72, 1.18) | ||
| Urban | - | - | 1.00 (reference) | ||
| Mother’s age (y) | |||||
| ≤25 | - | - | 1.00 (reference) | ||
| 26-35 | - | - | 0.83 (0.53, 1.29) | ||
| 36-45 | - | - | 0.88 (0.52, 1.49) | ||
| >45 | - | - | 0.77 (0.31, 1.92) | ||
| Maternal education level | |||||
| Low | - | - | 0.59 (0.41, 0.85)** | ||
| Middle | - | - | 0.74 (0.53, 1.03) | ||
| High | - | - | 1.00 (reference) | ||
| Paternal education level | |||||
| Low | - | - | 1.57 (1.08, 2.29)* | ||
| Middle | - | - | 1.24 (0.89, 1.73) | ||
| High | - | - | 1.00 (reference) | ||
| Mother’s work status | |||||
| Unemployed | - | - | 1.00 (reference) | ||
| Civil/private employer | - | - | 0.56 (0.34, 0.92)* | ||
| Entrepreneur | - | - | 0.93 (0.63, 1.36) | ||
| Laborer | - | - | 0.78 (0.56, 1.09) | ||
| Other | - | - | 0.99 (0.67, 1.46) | ||
| Father’s work status | |||||
| Unemployed | - | - | 1.00 (reference) | ||
| Civil/private employer | - | - | 0.90 (0.35, 2.35) | ||
| Entrepreneur | - | - | 1.13 (0.44, 2.93) | ||
| Laborer | - | - | 1.43 (0.56, 3.70) | ||
| Other | - | - | 1.18 (0.41, 3.38) | ||
| Economic status | |||||
| Lower | - | - | 1.57 (0.99, 2.47) | ||
| Lower-middle | - | - | 1.23 (0.77, 1.97) | ||
| Middle | - | - | 1.24 (0.79, 1.95) | ||
| Upper-middle | - | - | 1.30 (0.82, 2.07) | ||
| Upper | - | - | 1.00 (reference) | ||
| Mother’s morbidity | |||||
| No | - | - | 1.00 (reference) | ||
| Yes | - | - | 2.08 (0.94, 4.60) | ||
| Father’s morbidity | |||||
| No | - | - | 1.00 (reference) | ||
| Yes | - | - | 1.81 (0.91, 3.61) | ||
- 1. McCoy DC, Peet ED, Ezzati M, Danaei G, Black MM, Sudfeld CR, et al. Early childhood developmental status in low- and middle-income countries: national, regional, and global prevalence estimates using predictive modeling. PLoS Med 2016;13(6):e1002034ArticlePubMedPMC
- 2. Dickerson A, Popli GK. Persistent poverty and children’s cognitive development: evidence from the UK Millennium Cohort Study. J R Stat Soc Ser A Stat Soc 2016;179(2):535-558Article
- 3. Raikes A, Yoshikawa H, Britto PR, Iruka I. Children, youth and developmental science in the 2015-2030 global sustainable development goals. Soc Policy Rep 2017;30(3):1-23Article
- 4. Grantham-McGregor S, Cheung YB, Cueto S, Glewwe P, Richter L, Strupp B, et al. Developmental potential in the first 5 years for children in developing countries. Lancet 2007;369(9555):60-70ArticlePubMedPMC
- 5. McDonald S, Kehler H, Bayrampour H, Fraser-Lee N, Tough S. Risk and protective factors in early child development: results from the All Our Babies (AOB) pregnancy cohort. Res Dev Disabil 2016;58: 20-30ArticlePubMed
- 6. Ministry of Health of Indonesia. Indonesia Basic Health Survey (RISKESDAS) 2018. Jakarta: National Institute of Health Research and Development; 2018. p. 227 (Indonesian)
- 7. Ministry of Health of Indonesia. Indonesia Basic Health Survey (RISKESDAS) 2013. Jakarta: National Institute of Health Research and Development; 2013. p. 116 (Indonesian)
- 8. Shen H, Magnusson C, Rai D, Lundberg M, Lê-Scherban F, Dalman C, et al. Associations of parental depression with child school performance at age 16 years in Sweden. JAMA Psychiatry 2016;73(3):239-246ArticlePubMed
- 9. Tuovinen S, Lahti-Pulkkinen M, Girchenko P, Lipsanen J, Lahti J, Heinonen K, et al. Maternal depressive symptoms during and after pregnancy and child developmental milestones. Depress Anxiety 2018;35(8):732-741ArticlePubMed
- 10. Caccese C, Lew J, Jones SL, Nguyen TA, Rompotinos D, Wu M, et al. Paradoxical effects of paternal anxiety and depression on child cognition and behaviour. Biol Psychiatry 2020;87(9):S427Article
- 11. Madsen KB, Rask CU, Olsen J, Niclasen J, Obel C. Depression-related distortions in maternal reports of child behaviour problems. Eur Child Adolesc Psychiatry 2020;29(3):275-285ArticlePubMed
- 12. Paulson JF, Keefe HA, Leiferman JA. Early parental depression and child language development. J Child Psychol Psychiatry 2009;50(3):254-262ArticlePubMed
- 13. Takehara K, Suto M, Kakee N, Tachibana Y, Mori R. Prenatal and early postnatal depression and child maltreatment among Japanese fathers. Child Abuse Negl 2017;70: 231-239ArticlePubMed
- 14. Ramchandani P, Stein A, Evans J, O’Connor TG; ALSPAC study team. Paternal depression in the postnatal period and child development: a prospective population study. Lancet 2005;365(9478):2201-2205ArticlePubMed
- 15. Loizillon A, Petrowski N, Britto P, Cappa C. Development of the Early Childhood Development Index in MICS surveys. 2017 [cited 2021 Mar 1]. Available from: https://mics.unicef.org/files?job=W1siZiIsIjIwMTcvMDkvMTUvMjEvMTUvNDMvMzc4L01JQ1NfTWV0aG9kb2xvZ2ljYWxfUGFwZXJfNi5wZGYiXV0&sha=85c096f0b2c5b0c8
- 16. Miller AC, Garchitorena A, Rabemananjara F, Cordier L, Randriamanambintsoa M, Rabeza V, et al. Factors associated with risk of developmental delay in preschool children in a setting with high rates of malnutrition: a cross-sectional analysis of data from the IHOPE study, Madagascar. BMC Pediatr 2020;20(1):108ArticlePubMedPMC
- 17. Pettersson A, Modin S, Wahlström R, Af Winklerfelt Hammarberg S, Krakau I. The Mini-International Neuropsychiatric Interview is useful and well accepted as part of the clinical assessment for depression and anxiety in primary care: a mixed-methods study. BMC Fam Pract 2018;19(1):19ArticlePubMedPMC
- 18. Ashaba S, Rukundo GZ, Beinempaka F, Ntaro M, LeBlanc JC. Maternal depression and malnutrition in children in southwest Uganda: a case control study. BMC Public Health 2015;15: 1303ArticlePubMedPMC
- 19. Lecrubier Y, Weiller E, Hergueta T, Amorim P, Bonorn LL, Lépine JP, et al. Mini International Neuropsychiatric Interview version ICD-10. Jakarta: Yayasan Depresi Indonesia; 2007. p. 5 (Indonesian)
- 20. Hanington L, Ramchandani P, Stein A. Parental depression and child temperament: assessing child to parent effects in a longitudinal population study. Infant Behav Dev 2010;33(1):88-95ArticlePubMedPMC
- 21. Evans J, Melotti R, Heron J, Ramchandani P, Wiles N, Murray L, et al. The timing of maternal depressive symptoms and child cognitive development: a longitudinal study. J Child Psychol Psychiatry 2012;53(6):632-640ArticlePubMed
- 22. Brennan PA, Hammen C, Andersen MJ, Bor W, Najman JM, Williams GM. Chronicity, severity, and timing of maternal depressive symptoms: relationships with child outcomes at age 5. Dev Psychol 2000;36(6):759-766ArticlePubMed
- 23. Cogill SR, Caplan HL, Alexandra H, Robson KM, Kumar R. Impact of maternal postnatal depression on cognitive development of young children. Br Med J (Clin Res Ed) 1986;292(6529):1165-1167ArticlePubMedPMC
- 24. Sutter-Dallay AL, Cosnefroy O, Glatigny-Dallay E, Verdoux H, Rascle N. Evolution of perinatal depressive symptoms from pregnancy to two years postpartum in a low-risk sample: the MATQUID cohort. J Affect Disord 2012;139(1):23-29ArticlePubMed
- 25. Canadian Paediatric Society. Maternal depression and child development. Paediatr Child Health 2004;9(8):575-598ArticlePubMedPMC
- 26. Adani S, Cepanec M. Sex differences in early communication development: behavioral and neurobiological indicators of more vulnerable communication system development in boys. Croat Med J 2019;60(2):141-149ArticlePubMedPMC
- 27. Perić M, Masnjak RF. Differences between boys and girls in developmental areas. In: Proceedings of Eurlyaid Connference 2017; 2017 Oct 6-8; Belgrade. Belgrade: University of Belgrade; 2017. p. 351-359
- 28. Lewis C, Lamb ME. Fathers’ influences on children’s development: the evidence from two-parent families. Eur J Psychol Educ 2003;18(2):211-228Article
- 29. Spielberger J, Gouvea M, Dinata E, Fleischman L. Father involvement in early childhood development: a brief report from the Palm Beach County Family Study. 2015 [cited 2021 Mar 1]. Available from: https://www.chapinhall.org/wp-content/uploads/Father-Involvement-in-Early-Childhood-Development.pdf
- 30. Han YS, Jun WP. Parental involvement in child’s development: father vs. mother. Open J Med Psychol 2013;2: 1-6
- 31. Lamb ME, Pleck JH, Charnov EL, Levine JA. A biosocial perspective on paternal behavior and involvement. In: Lancaster JB, Altmann J, Rossi AS, Sherrod LR, editors. Parenting across the life span: biosocial dimensions. London: Routledge; 2017. p. 111-142
- 32. Bales RF, Parsons T. Family: socialization and interaction process. London: Routledge; 2014. p. 329-334
- 33. Pradeep BS, Gururaj G, Varghese M, Benegal V, Rao GN, Sukumar GM, et al. National Mental Health Survey of India, 2016 - rationale, design and methods. PLoS One 2018;13(10):e0205096ArticlePubMedPMC
- 34. Sheehan DV, Lecrubier Y, Sheehan KH, Amorim P, Janavs J, Weiller E. The Mini-International Neuropsychiatric Interview (M.I.N.I.): the development and validation of a structured diagnostic psychiatric interview for DSM-IV and ICD-10. J Clin Psychiatry 1998;59(Suppl 20):22-33
REFERENCES
Figure & Data
References
Citations
- Impact of adverse childhood experiences (ACE) on the development of 18-months-old children
Mariana Lacerda Gontijo, Janaína Matos Moreira, Thiago Rosental Silva, Claudia Regina Lindgren Alves
Journal of Affective Disorders Reports.2022; 10: 100401. CrossRef
 PubReader
 ePub Link
 Cite
Cite- Figure
-

- Related articles
-
- Association Between Objective Social Isolation and Unmet Medical Needs: A Nationwide Cross-sectional Study in Korea
- Impact of Physical Activity on the Association Between Unhealthy Adolescent Behaviors and Anxiety Among Korean Adolescents: A Cross-sectional Study
- Association Between Tobacco Smoking and Dental Caries in the Indonesian Population: Results of a National Study in 2018

