Articles
- Page Path
- HOME > J Prev Med Public Health > Volume 57(2); 2024 > Article
-
Original Article
Mortality Burden Due to Short-term Exposure to Fine Particulate Matter in Korea -
Jongmin Oh1,2,3,4
 , Youn-Hee Lim5, Changwoo Han6, Dong-Wook Lee7, Jisun Myung8, Yun-Chul Hong3,9, Soontae Kim10, Hyun-Joo Bae11
 -
Journal of Preventive Medicine and Public Health 2024;57(2):185-196.
DOI: https://doi.org/10.3961/jpmph.23.514
Published online: March 29, 2024
- 1,050 Views
- 39 Download
1Department of Environmental Medicine, Ewha Womans University College of Medicine, Seoul, Korea
2Institute of Ewha-SCL for Environmental Health (IESEH), Ewha Womans University College of Medicine, Seoul, Korea
3Department of Human Systems Medicine, Seoul National University College of Medicine, Seoul, Korea
4Integrated Major in Innovative Medical Science, Seoul National University Graduate School, Seoul, Korea
5Section of Environmental Health, Department of Public Health, University of Copenhagen, Copenhagen, Denmark
6Department of Preventive Medicine, Chungnam National University College of Medicine, Daejeon, Korea
7Department of Occupational and Environmental Medicine, Inha University Hospital, Inha University, Incheon, Korea
8Inha Research Institute for Medical Science, Inha University College of Medicine, Incheon, Korea
9Institute of Environmental Medicine, Medical Research Center, Seoul National University, Seoul, Korea
10Department of Environmental and Safety Engineering, Ajou University, Suwon, Korea
11Division of Environmental Health, Korea Environment Institute, Sejong, Korea
- Corresponding author: Hyun-Joo Bae, Division of Environmental Health, Korea Environment Institute, 370 Sicheong-daero, Sejong 30147, Korea E-mail: hjbae@kei.re.kr
Copyright © 2024 The Korean Society for Preventive Medicine
This is an Open Access article distributed under the terms of the Creative Commons Attribution Non-Commercial License (http://creativecommons.org/licenses/by-nc/4.0/) which permits unrestricted non-commercial use, distribution, and reproduction in any medium, provided the original work is properly cited.
ABSTRACT
-
Objectives:
- Excess mortality associated with long-term exposure to fine particulate matter (PM2.5) has been documented. However, research on the disease burden following short-term exposure is scarce. We investigated the cause-specific mortality burden of short-term exposure to PM2.5 by considering the potential non-linear concentration–response relationship in Korea.
-
Methods:
- Daily cause-specific mortality rates and PM2.5 exposure levels from 2010 to 2019 were collected for 8 Korean cities and 9 provinces. A generalized additive mixed model was employed to estimate the non-linear relationship between PM2.5 exposure and cause-specific mortality levels. We assumed no detrimental health effects of PM2.5 concentrations below 15 μg/m3. Overall deaths attributable to short-term PM2.5 exposure were estimated by summing the daily numbers of excess deaths associated with ambient PM2.5 exposure.
-
Results:
- Of the 2 749 704 recorded deaths, 2 453 686 (89.2%) were non-accidental, 591 267 (21.5%) were cardiovascular, and 141 066 (5.1%) were respiratory in nature. A non-linear relationship was observed between all-cause mortality and exposure to PM2.5 at lag0, whereas linear associations were evident for cause-specific mortalities. Overall, 10 814 all-cause, 7855 non-accidental, 1642 cardiovascular, and 708 respiratory deaths were attributed to short-term exposure to PM2.5. The estimated number of all-cause excess deaths due to short-term PM2.5 exposure in 2019 was 1039 (95% confidence interval, 604 to 1472).
-
Conclusions:
- Our findings indicate an association between short-term PM2.5 exposure and various mortality rates (all-cause, non-accidental, cardiovascular, and respiratory) in Korea over the period from 2010 to 2019. Consequently, action plans should be developed to reduce deaths attributable to short-term exposure to PM2.5.
- Many epidemiological studies have investigated the health burden of long-term exposure to fine particulate matter (PM2.5) [1-4]. A global study estimated that in 2019, air pollution was responsible for 6.7 million deaths, with 4.5 million of these attributed to ambient PM2.5 and ground-level ozone [1]. Previously, our research group assessed the mortality impact of chronic PM2.5 exposure in Korea, identifying 11 924 premature deaths associated with PM2.5 in 2015 [5].
- Many studies have reported an association between short-term exposure to PM2.5 and mortality [6-10]. Most of these investigations have been conducted in Asia, Europe, and North America. However, research on attributable deaths (ADs) due to short-term exposure to PM2.5 remains scarce relative to studies on chronic effects.
- Additionally, although the exposure–response relationship between PM2.5 and cause-specific mortality may vary across regions, most studies have applied uniform concentration–response (C-R) functions. In studies of long-term exposure, results from several cohorts have been combined to present C-R functions for cause-specific mortality [2,3,11]. However, evidence for C-R functions in the context of short-term exposure is insufficient.
- North America and Europe exhibit lower concentrations of PM2.5 than Asian countries, including Korea. Research from the former indicates a linear relationship between short-term exposure to PM2.5 and mortality [6]. In contrast, studies from Asia have identified a supralinear (non-linear) association between short-term PM2.5 exposure and death [9,10,12]. However, little research has been published in the form of health impact assessments that consider the non-linearity of short-term PM2.5 exposure effects.
- To address this issue, we previously estimated the mortality burden associated with ambient PM2.5 exposure in Korea by generating country-specific C-R functions [10]. We assumed a non-linear relationship between PM2.5 levels and mortality between 2006 and 2016 and estimated the excess deaths attributable to short-term exposure to PM2.5 [10].
- However, we did not address cause-specific mortality or temporal trends (namely, the annual rate of change [ARC]) in deaths related to PM2.5 exposure. Additionally, we referenced the World Health Organization (WHO) air quality guidelines that were in place prior to their 2021 update [13].
- According to studies by Ramachandran and Rajesh [14], and by Cheng et al. [15] Asian countries often experience days with sharp increases in PM2.5 concentrations. Although Korea’s annual trends in PM2.5 concentrations exhibit a decreasing pattern, spikes still occur frequently. These short-term elevations in PM2.5 levels can impact the mortality burden. Moreover, ongoing population aging may alter the annual temporal trends in mortality associated with short-term exposure to PM2.5.
- Therefore, in this study, we aimed to establish a country-specific C-R function for the relationship between short-term exposure to PM2.5 and cause-specific mortality (including allcause, non-accidental, cardiovascular, and respiratory mortality) in Korea. Additionally, we sought to estimate the causespecific mortality burden attributable to short-term exposure to PM2.5.
INTRODUCTION
- Daily Death Count Data
- We obtained cause-of-death statistics for the years 2010-2019 from the Microdata Integrated Service system of the Korea National Statistical Office (https://mdis.kostat.go.kr). The dataset included the date of death, cause of death, age at death, and region, the last of which encompassed cities and provinces. The regions included 8 metropolitan cities (Seoul, Busan, Daegu, Incheon, Gwangju, Daejeon, Ulsan, and Sejong) and 9 provinces (Gyeonggi, Gangwon, Chungcheongbuk, Chungcheongnam, Jeollabuk, Jeollanam, Gyeongsangbuk, Gyeongsangnam, and Jeju). We categorized cause-specific mortalities into 4 groups: all-cause (A00-Z99), non-accidental (A00-R99), cardiovascular disease (CVD; I00-I99), and respiratory disease (J00-J99), following the International Classification of Diseases, 10th edition. In our subgroup analyses, which considered gender and age group, we excluded 453 deaths from the total of 2 750 157 due to missing age information. We then calculated daily cause-specific mortality counts across the 17 regions from 2010 to 2019.
- Fine Particulate Matter Data
- We utilized data from fixed monitoring stations and modeled them to estimate PM2.5 concentrations. Korea has been recording PM2.5 levels since 2015; as a result, direct measurement data from before this year are not available across the various regions. In 2015, Korea had 260 active air pollution monitoring stations, which increased to 333 by 2018 [16]. The regional distribution of monitoring stations varied, with as few as 4 stations in Jeju and as many as 81 in Gyeonggi.
- For the years 2010 to 2015, we therefore utilized modeled PM2.5 data, generated with the Community Multiscale Air Quality (CMAQ) model, version 4.7.1 [17]. The CMAQ model, developed and distributed by the US Environmental Protection Agency (https://www.epa.gov/cmaq), is an atmospheric chemistry transport model that addresses a broad spectrum of air quality issues, including PM2.5, ozone, and various toxic pollutants. It was applied with a horizontal resolution of 27 km for Northeast Asia and 9 km for the Korean region. The model calculates the 3-dimensional distributions of both gaseous and particulate air pollutants in each grid cell on an hourly basis. Meteorological input data for air quality modeling were generated using the Weather Research and Forecasting model, version 3.4.1. The initial fields for this model were derived from the 1×1 Final Operational Global Analysis data provided by the National Centers for Environmental Prediction, which were obtained through the National Oceanic and Atmospheric Administration reanalysis. Previous studies have provided more detailed information on the exposure model data [5,10,18]. As such, we calculated the daily mean PM2.5 concentration for each region.
- From 2016 to 2019, we collected hourly PM2.5 data from the Korea Environment Corporation (https://www.airkorea.or.kr/web). We calculated the daily PM2.5 averages for each region by averaging these hourly levels. A day’s data were deemed invalid if 25% or more of the hourly measurements were missing.
- The correlation coefficient (ρ=0.99) was calculated between the nationwide daily CMAQ modeled data and the monitored PM2.5 data for 2015, when the exposure data overlapped.
- Meteorological Data
- Meteorological data for each region, which included daily mean temperature, humidity, and dew point, were sourced from the Korea Meteorological Administration for the years 2010 to 2019. Utilizing this daily meteorological data, we calculated the daily apparent temperature (AT) using the following formula: AT=-2.653+0.994×daily mean temperature+ (0.0153×[daily dew point temperature]2) [19,20].
- Statistical Analysis
- We conducted a 2-stage statistical analysis to estimate the number of deaths attributable to short-term exposure to ambient PM2.5. First, we employed a generalized additive mixed model (GAMM) with an assumed Poisson distribution to estimate the country-specific relative risk (RR) associated with daily air pollution and cause-specific mortality. Within the GAMM, adjustments were made for time trends, day of the week, and AT, incorporating a random intercept for the regions, per the following formula.
- Here, E represents the expected number of daily deaths, while i and j indicate the day and region, respectively. The term s denotes the penalized spline term, and dow signifies the day of the week, from Sunday to Saturday. Consistent with prior research, we employed a penalized spline to account for non-linear relationships with PM2.5, time, and AT. The degrees of freedom (df) for the time trend, PM2.5, and AT were established based on findings from earlier studies [7,10,21] and a model evaluation index, which included generalized cross-validation and the Akaike information criterion. Specifically, we chose to use 6 df per year for the time trend, resulting in a total of 60 df over the 10-year study period, and we selected appropriate df values for PM2.5 and AT.
- The C-R function depicting the association between daily exposure to PM2.5 and cause-specific mortality is illustrated in Supplemental Material 1.
- By incorporating a lag structure, we accounted for the delayed association between daily exposure to PM2.5 and mortality. To identify the optimal lag day for the main analysis, we evaluated lag days up to day 6, then selected lag0 according to the best-fit model (Supplemental Material 2).
- Estimates of the association between daily exposure to PM2.5 and mortality are expressed as RRs and 95% confidence intervals (CIs) for each concentration level—ranging from 0 μg/m3 to 230 μg/m3 at 1 μg/m3 intervals—compared with the reference concentration. Since the maximum observed PM2.5 concentration was 230 μg/m3, we presented an RR and 95% CI for each increment from 1 μg/m3 to 230 μg/m3 (Supplemental Material 3).
- We assumed that concentrations below 15 μg/m3 posed no risk. These values are based on the updated WHO Air Quality Guidelines for a 24-hour period [13]. For comparison with the results of the non-linear association, we estimated the number of excess deaths attributable to PM2.5 under the assumption of a linear association.
- Estimated Excess Deaths
- The population attributable fraction (PAF) and AD were calculated as follows:
- Here, cf indicates the counterfactual concentration. If the PM2.5 concentration fell below the reference concentration, we presumed that no associated risk was present. Furthermore, we estimated the excess deaths under various scenarios with differing reference concentrations. Specifically, we posited that no risk was conferred when the daily PM2.5 concentration was less than 10 μg/m3 or less than 5 μg/m3. The resulting reference concentrations of 15 μg/m3, 10 μg/m3, and 5 μg/m3 were applied as concentration scenarios 1, 2, and 3, respectively.
- Similarly, the 95% CIs for excess deaths attributable to short-term exposure to PM2.5 were calculated using the lower and upper bounds of the RR.
- Annual Rate of Change
- We considered the ARC for ADs resulting from short-term exposure to PM2.5 over the years 2010 to 2019 across Korea. The formula used to determine the ARC is as follows [22]:
- Here, A and B denote the number of excess deaths in 2010 and 2019, respectively, while t represents the number of years in the interval (the study period).
- Subgroup Analysis
- We performed subgroup analyses stratified by gender and age group (under 65 vs. 65 years and older). These analyses followed the 2-stage statistical approach previously described. In the first stage, we conducted a time-series analysis using GAMM for each gender and age category. In the second stage, we utilized the RR associated with each PM2.5 concentration interval, as determined by each model, to estimate excess deaths. Notably, because the results vary across models, the sum of the estimated excess deaths for each subgroup may not equate to the total estimated excess deaths.
- All analyses were conducted using R version 4.2.1 (packages: dplyr, ggplot2, gamm4, and gridExtra; R Foundation for Statistical Computing, Vienna, Austria).
- Ethics Statement
- This study was exempted from review by the Institutional Review Board of Seoul National University Hospital in Korea (IRB No. E-2105-043-1218).
METHODS
- We analyzed a total of 2 749 704 deaths that occurred in Korea from 2010 to 2019. Of these, 2 453 686 (89.2%) were non-accidental, 591 267 (21.5%) were due to cardiovascular causes, and 141 066 (5.1%) were respiratory-related deaths. In 2019, the death rates per 100 000 people were 574.7 for all causes, 521.6 for non-accidental causes, 117.3 for cardiovascular causes, and 71.4 for respiratory causes, respectively. The daily mean PM2.5 levels varied, with the lowest at 14.7 µg/m3 (recorded in Jeju) and the highest at 28.4 µg/m3 (observed in Chungbuk) (Table 1, Supplemental Material 4).
- Supplemental Material 5 presents the daily counts of cause-specific deaths, PM2.5 concentrations, and AT throughout the study period. An upward trend was observed in the number of cause-specific deaths over time.
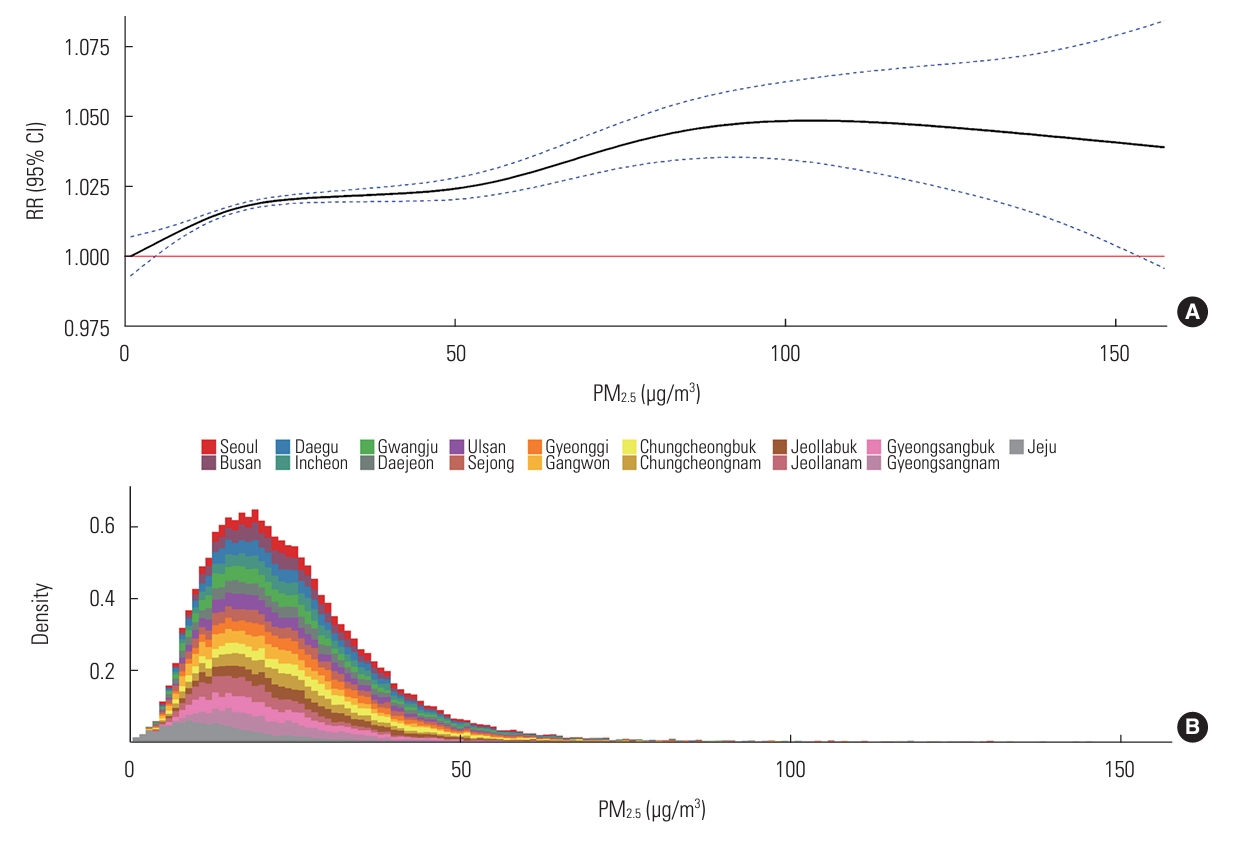
- The distribution of deaths in relation to PM2.5 exposure concentration exhibited a right-skewed pattern (Figure 1). Between 2010 and 2019, approximately 76.5% of the days recorded PM2.5 concentrations exceeding the WHO’s recommended air quality limit for a 24-hour period, which is 15 μg/m3 (Supplemental Material 6).
- The relationship between exposure to PM2.5 at lag0 and all-cause mortality exhibited a linear association from 0 μg/m3 to 104 μg/m3. In contrast, the RR decreased at high concentrations (>104 μg/m3) (Figure 1). However, short-term exposure to PM2.5 was positively associated with non-accidental, CVD, and respiratory deaths, demonstrating a linear relationship (Supplemental Material 7).
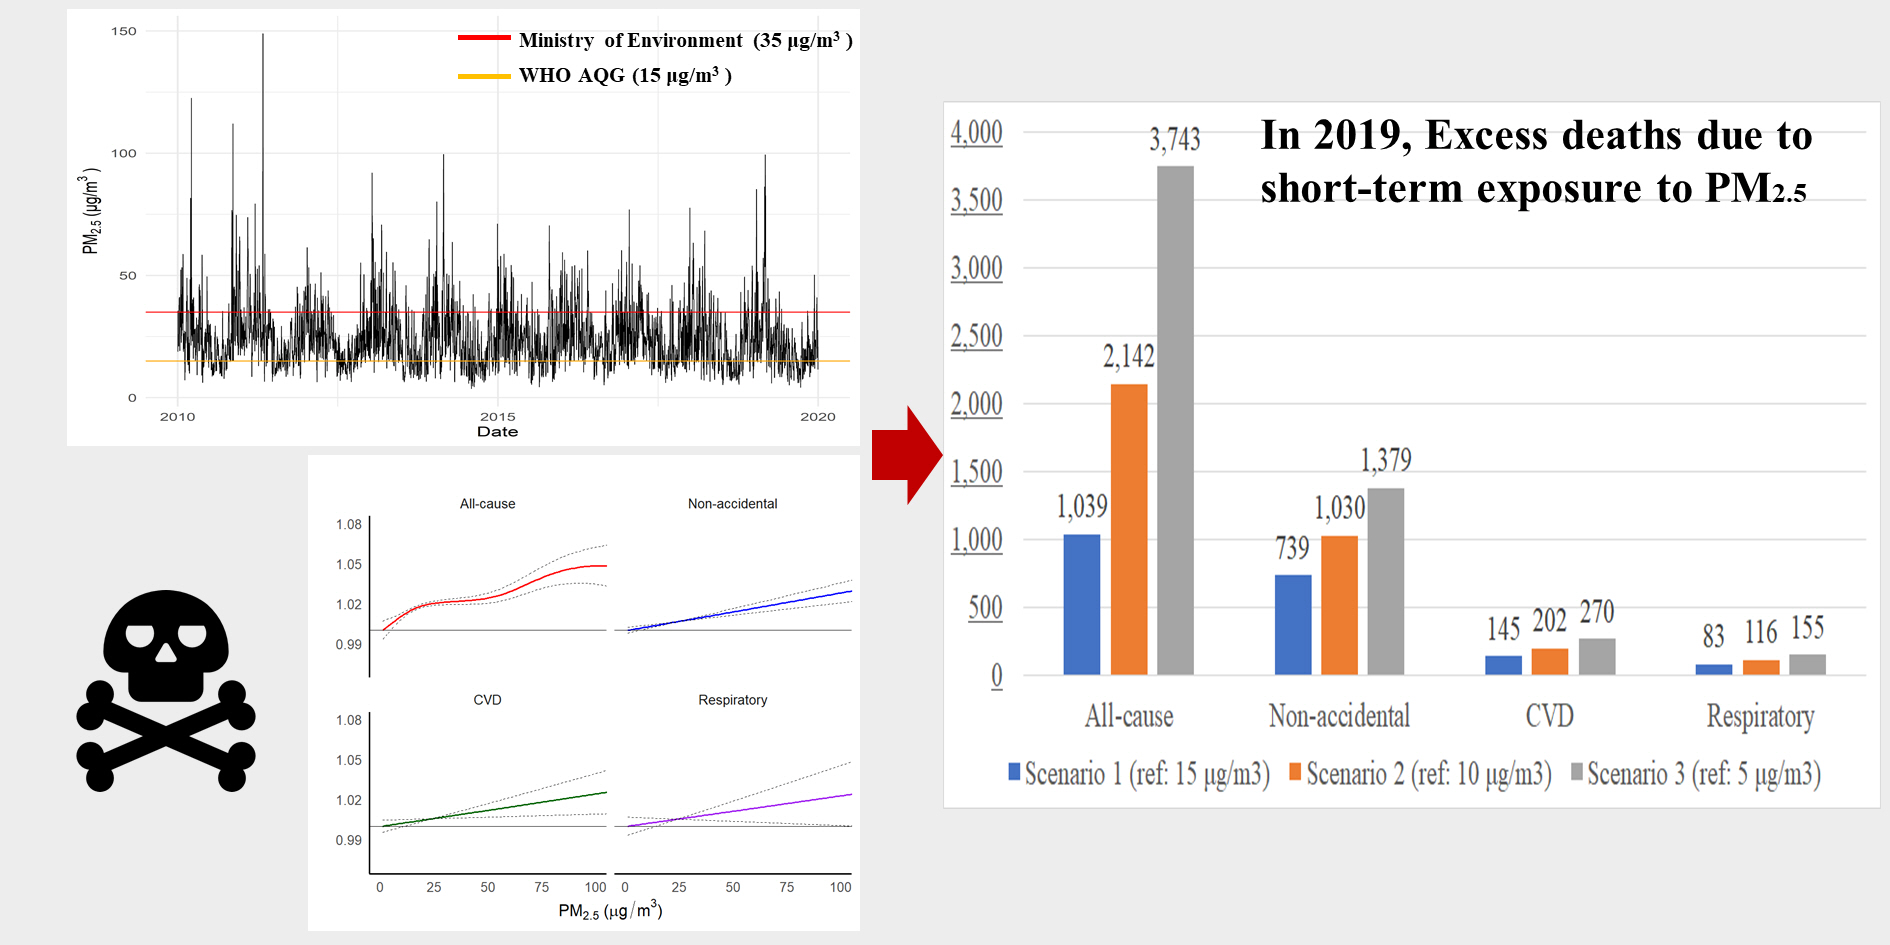
- During the study period (2010-2019), there were 10 814 (95% CI, 6428 to 15 183) all-cause deaths, 7855 (95% CI, 6142 to 9563) non-accidental deaths, 1642 (95% CI, 801 to 2480) cardiovascular deaths, and 708 (95% CI, 135 to 1278) respiratory deaths attributable to short-term exposure to PM2.5, according to the WHO guidelines (Table 2). In 2019, excess deaths due to short-term exposure to PM2.5 were estimated at 1039 (95% CI, 604 to 1472). The years with the highest and lowest numbers of excess deaths due to short-term PM2.5 exposure were 2013 (n=1172; 95% CI, 709 to 1634) and 2012 (n=953; 95% CI, 568 to 1337), respectively. The estimated excess all-cause deaths due to short-term exposure based on non-linear (n=10 814; 95% CI, 6428 to 15 183) and linear (n=10 407; 95% CI, 7550 to 13 256) assumptions were similar (Supplemental Materials 8 and 9).
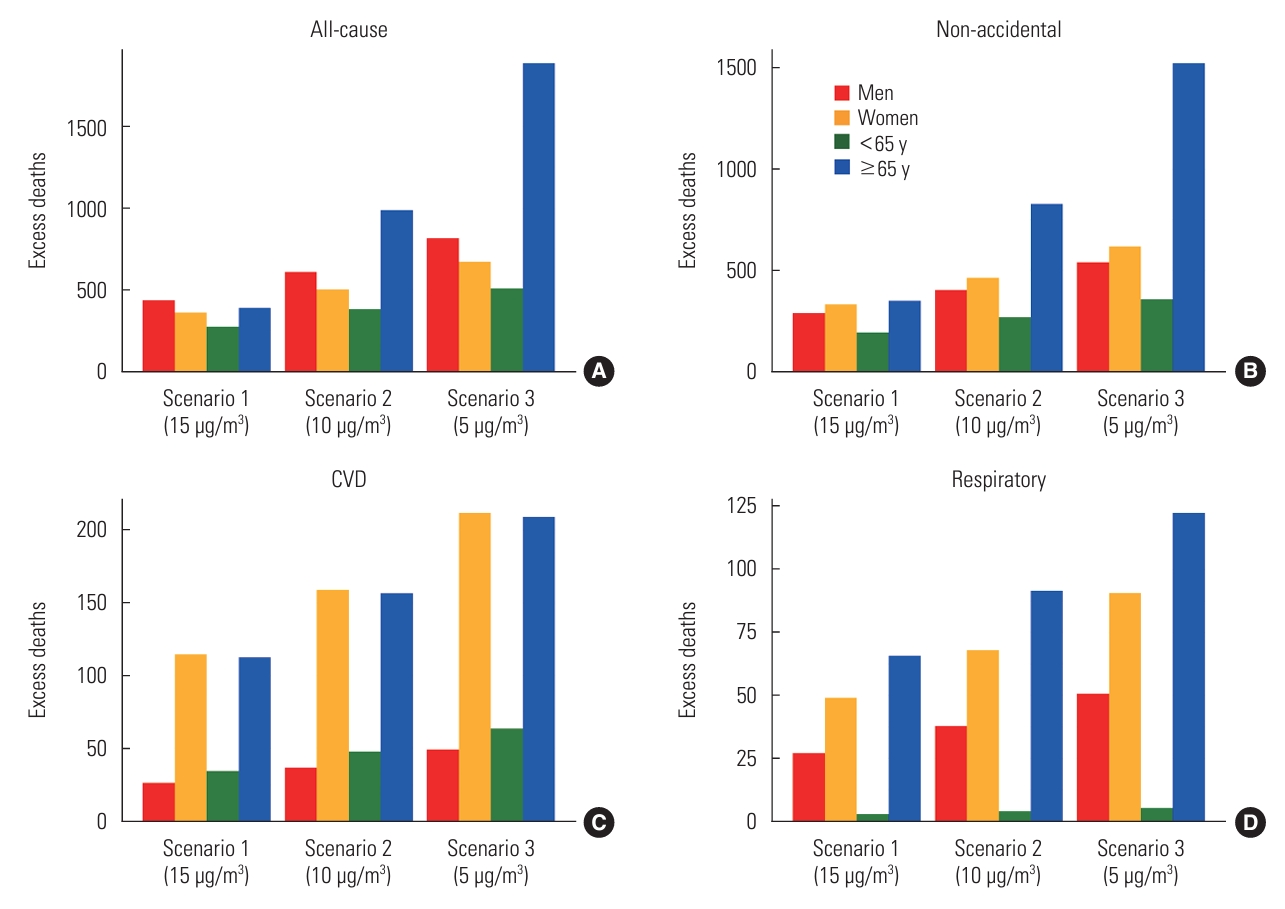
- By applying various concentration scenarios, we found that a lower reference concentration of PM2.5 was associated with a higher number of excess deaths attributed to daily exposure to PM2.5 in 2019 (Table 3). Specifically, when comparing scenario 1 (reference concentration: 15 µg/m3) to scenario 3 (5 µg/m3), the estimated number of all-cause attributable deaths approximately tripled under the latter conditions (scenario 1: 1039 deaths vs. scenario 3: 3743 deaths).
- In the subgroup analyses, we demonstrated a non-linear association between PM2.5 exposure and all-cause as well as non-accidental mortality in the elderly group (age at death ≥65 years) (Supplemental Material 10). The other results indicated linear associations. In 2019, the estimated attributable all-cause mortality in scenario 3 was approximately twice as high for men, women, and younger participants, and 5 times higher for older individuals, compared to scenario 1 (Figure 2).
- Compared to men, women experienced higher rates of non-accidental, cardiovascular, and respiratory deaths associated with short-term exposure to PM2.5 (Figure 2). The elderly participants recorded more deaths than the younger group (age of death <65 years), with further pronounced disparities across exposure scenarios. For instance, for the elderly group, scenario 1 was associated with 389 deaths (95% CI, 19 to 757), while scenario 3 corresponded to 1888 deaths (95% CI, 1355 to 2419).
- From 2010 to 2019, regarding deaths due to short-term exposure to PM2.5, the ARC was -1.1% for all-cause mortality, -1.2% for non-accidental mortality, and -2.0% for CVD deaths. In contrast, the ARC for respiratory deaths was positive, at 5.3% (Supplemental Material 11).
RESULTS
- We established country-specific C-R functions relating daily exposure to PM2.5 with cause-specific mortality, then used these functions to calculate the excess burden attributable to PM2.5 in Korea. The country-specific C-R function demonstrated a non-linear relationship, plateauing at concentrations greater than 104 μg/m3, while exhibiting a linear relationship at lower concentrations. Over the 10-year study period, the estimated excess deaths totaled 10 814 for all causes, 7855 for non-accidental causes, 1642 for cardiovascular causes, and 708 for respiratory causes. The burden was disproportionately higher among women and the elderly compared to men and younger participants.
- A previous Korean study estimated that chronic exposure to PM2.5 resulted in 11 924 premature deaths in 2015 [5]. That study utilized an integrated exposure-response function to assess the mortality burden from 4 major causes of death: ischemic heart disease, stroke, chronic obstructive pulmonary disease, and lung cancer. In our analysis, we estimated that short-term exposure to PM2.5 was responsible for 1033 deaths in that same year. Another study of disease burden indicated that the health impact of short-term PM2.5 exposure in Korea was smaller than that of long-term exposure [10]. When compared with the 2016 findings of Lim et al. [10], our study estimated a lower number of excess non-accidental deaths attributable to PM2.5 (850 vs. 1638). This difference may stem from variations in the study periods (2010-2019 vs. 2006-2016) and the range of lag days considered (lag0 vs. lag0-7).
- Li et al. [9] identified non-linear associations between daily mean PM2.5 exposure and all-cause mortality across 104 counties in China from 2013 to 2015. In the present study, we observed a lower number of excess deaths (2.04 vs. 13.78 per 100 000 people). This discrepancy largely stems from variations in population characteristics, such as the study period, population size, and mortality rate, as well as differences in exposure levels. Specifically, the daily mean concentration of PM2.5 was 24.4 μg/m3 in our study compared to 61.6 μg/m3 in the study by Li et al. [9].
- We observed a non-linear association between daily exposure to PM2.5 and all-cause mortality, with the RR attenuated at high concentrations (>104 μg/m3). This pattern aligns with previous studies that have reported non-linear associations in Asian populations [7,9]. In a 2019 study, Cho and Kim [23] surveyed 171 Koreans regarding their perceptions of ambient PM2.5 levels and their corresponding adaptive behaviors. The participants indicated that they checked the daily PM2.5 levels or avoided outdoor activities on days when the concentrations were high. The observed decrease in RR at elevated concentrations may be attributed to several factors, including the potential tendency to stay indoors or wear masks when PM2.5 levels are high.
- PM2.5 exposure was more strongly associated with respiratory mortality than with mortality from the other examined causes. The ARC for respiratory deaths due to daily PM2.5 exposure (5.3%) indicated an increase between 2010 and 2019. In contrast, the number of excess deaths for all causes, non-accidental causes, and CVDs declined over the same period, with decreases of 1.1%, 1.2%, and 2.0%, respectively. These trends may reflect the sharp rise in deaths from respiratory disease linked to the rapid aging of the population [24]. Consequently, the data suggest that the number of excess deaths from respiratory diseases attributable to short-term PM2.5 exposure increased by an average of 5.3% annually from 2010 to 2019.
- Excess deaths attributable to air pollution depend on data regarding population size, exposure levels, and the effect size (that is, RR). As the proportion of the elderly—a predominantly vulnerable demographic—grows annually, the concentration of PM2.5 has been observed to decrease each year. Consequently, the count of excess deaths fluctuates in response to these 3 variables: population numbers, exposure concentrations, and RR. The ARC may also vary. This study underscores how shifts in excess deaths resulting from short-term exposure to PM2.5 could be influenced by daily concentration variations and an increase in underlying deaths due to an aging population.
- To account for demographic shifts due to population aging and regional population variations, we incorporated population density in our model as an offset term for sensitivity analysis. When population density was considered, the estimated number of excess deaths attributable to short-term exposure to PM2.5 was marginally lower (all-cause: 8628 [95% CI, 6909 to 10 343]; non-accidental: 6307 [95% CI, 4770 to 7840]; CVD: 1336 [95% CI, 965 to 1707]; respiratory: 569 [95% CI, 399 to 739]) than the primary findings (all-cause: 10 814 [95% CI, 6428 to 15 183]; non-accidental: 7855 [95% CI, 6142 to 9563]; CVD: 1642 [95% CI, 801 to 2480]; respiratory: 708 [95% CI, 135 to 1278]), as detailed in Supplemental Material 12.
- In this study, women and the elderly exhibited higher mortality due to short-term PM2.5 exposure relative to men and younger groups. These disparities could be attributed to a range of factors, including biological mechanisms, socioeconomic status (such as income and occupation), lifestyle choices (including the frequency of alcohol consumption, smoking habits, and levels of physical activity), and population aging [25-28]. In particular, the population of Korea is aging at an unprecedented rate [27]. Consequently, if the current levels of PM2.5 concentration persist, we may see an increase in excess deaths associated with short-term exposure to PM2.5.
- Quantifying the health burden of air pollution is instrumental in crafting effective public health interventions, which include defining, evaluating, and reviewing air quality standards [29,30]. Qu et al. [30] conducted a study on the PM2.5-related health and economic benefits of an Air Improvement Action Plan, reporting 21 384 premature deaths in Wuhan from 2013 to 2017. In Korea, the Special Act on the Reduction and Management of Fine Dust (Fine Dust Act) has been in effect since February 15, 2019. Assessing the health impacts and benefits associated with PM2.5 reduction is essential. Moreover, air quality recommendations differ across countries, and few meet the WHO air quality guidelines for a 24-hour period (which stipulate a limit of 15 μg/m3). The Korean Ministry of Environment has set a more lenient daily air quality guideline for PM2.5 at 35 μg/m3 [31].
- From 2010 to 2019, we found that 23.5% of days had an average daily PM2.5 concentration of 15 μg/m3 or less; 7.0%, had concentrations of 10 μg/m3 or less; and 0.2% had concentrations of 5 μg/m3 or less. Hence, the population is still exposed to concentrations above the exposure limit recommended by the WHO. Based on our exposure scenario analysis, differences in the burden of death are pronounced (scenario 1 [15 μg/m3]: 1039 deaths vs. scenario 3 [5 μg/m3]: 3743 deaths). Therefore, reducing exposure levels through air pollution management and reduction strategies can decrease the mortality burden associated with short-term exposure to PM2.5.
- This study evaluated the disease burden of cause-specific mortality associated with daily PM2.5 exposure. Three reference concentration scenarios were considered. Should the government or policymakers intensify their efforts to reduce PM2.5 levels in Korea, premature deaths associated with short-term exposure to these pollutants may be prevented. Furthermore, the estimated ARC for excess mortality linked to PM2.5 could inform policy improvements. Previous research has employed a non-linear (specifically, supralinear) approach to estimate the global exposure-response function (incorporating both the global exposure mortality model and the integrated exposure-response) for long-term exposure to PM2.5, drawing on data from multiple cohort studies [2,3,11]. However, a global exposure-response function for short-term exposure to PM2.5 has yet to be established.
- Due to heterogeneity in exposure levels and population density across regions, the association between short-term exposure to PM2.5 and mortality may not be statistically significant in certain areas. Furthermore, the nature of the exposure-response relationships can differ. In this study, we estimated a unified RR for the association between short-term exposure to PM2.5 and mortality on a national scale. Our findings can assist in estimating the mortality burden and inform the global response to short-term exposure to PM2.5.
- The present study had several limitations. First, we cannot rule out the possibility of measurement errors and misclassification of exposure levels. Although such misclassifications can introduce bias towards null or event outcomes, this is unlikely to occur in the case of Berkson-type errors. Therefore, we remain confident that the significance of our findings is not due to measurement error [32]. Future research should aim to connect high-resolution exposure data with more precise exposure allocation. Second, any establishment of a causal relationship was limited by the nature of our study, which relied on ecological time-series data from the population. Third, our analysis was based on aggregated data from the general population, which precluded the examination of individual characteristics such as income level, disability, and underlying diseases. It is possible that socioeconomically vulnerable groups or patients with certain conditions may exhibit greater sensitivity to PM2.5 [28,33,34]. Consequently, additional research is necessary to assess the disease burden while reflecting individual characteristics.
- In conclusion, we estimated the health burden attributable to daily exposure to PM2.5 in Korea from 2010 to 2019. Our findings can assist in air pollution management, regulation, and policy-making. Since lower reference levels markedly increased ADs, immediate action plans are needed to protect the population from daily PM2.5 exposure. Furthermore, our findings may be applicable to other Asian countries with similar PM2.5 concentrations.
DISCUSSION
Supplemental Materials
Supplemental Material 1.
Supplemental Material 2.
Supplemental Material 3.
Supplemental Material 4.
Supplemental Material 5.
Supplemental Material 6.
Supplemental Material 7.
Supplemental Material 8.
Supplemental Material 9.
Supplemental Material 10.
Supplemental Material 11.
Supplemental Material 12.
-
Conflict of Interest
The authors have no conflicts of interest associated with the material presented in this paper.
-
Funding
This work was supported by the Korea Environment Industry & Technology Institute (KEITI) through the Digital Infrastructure Building Project for Monitoring, Surveying, and Evaluating Environmental Health, funded by the Korea Ministry of Environment (MOE) [grant No. RS-2021-KE001615].
-
Author Contributions
Conceptualization: Oh J, Lim YH, Bae HJ. Data curation: Oh J, Kim S. Formal analysis: Oh J, Lim YH. Funding acquisition: Bae HJ. Methodology: Oh J, Lim YH, Han C, Lee DW, Myung J, Hong YC, Bae HJ. Project administration: Bae HJ. Visualization: Oh J. Writing – original draft: Oh J, Lim YH, Han C, Lee DW, Myung J, Hong YC, Bae HJ. Writing – review & editing: Oh J, Lim YH, Han C, Lee DW, Myung J, Hong YC, Kim S, Bae HJ.
Notes
Acknowledgements

| City/Province | Population (2019) |
All-cause |
Non-accidental |
CVD |
Respiratory |
Daily mean±SD |
||||||
|---|---|---|---|---|---|---|---|---|---|---|---|---|
| Count (2010-2019) | Mortality (2019)1 | Count (2010-2019) | Mortality (2019)1 | Count (2010-2019) | Mortality (2019)1 | Count (2010-2019) | Mortality (2019)1 | Deaths (all-cause) | PM2.5 (μg/m3) | AT (°C) | ||
| Seoul | 9 578 975 | 424 690 | 457.4 | 380 394 | 416.9 | 82 511 | 90.6 | 35 437 | 48.5 | 116.3±13.8 | 27.7±16.6 | 12.8±12.1 |
| Busan | 3 390 160 | 208 296 | 656.2 | 188 489 | 597.8 | 51 864 | 151.1 | 19 357 | 60.0 | 57.0±9.0 | 24.6±12.6 | 15.4±10.4 |
| Daegu | 2 431 140 | 129 953 | 565.6 | 116 776 | 512.0 | 31 000 | 117.4 | 12 693 | 72.3 | 35.6±6.8 | 24.7±13.6 | 14.5±11.3 |
| Incheon | 2 927 320 | 136 196 | 516.8 | 121 219 | 467.7 | 29 555 | 100.8 | 12 789 | 58.4 | 37.3±7.0 | 26.7±15.2 | 12.8±12.4 |
| Gwangju | 1 448 843 | 71 482 | 527.0 | 63 858 | 478.8 | 14 307 | 98.1 | 7829 | 76.8 | 19.6±4.7 | 23.7±14.6 | 14.5±12.1 |
| Daejeon | 1 471 770 | 68 274 | 509.7 | 60 310 | 460.7 | 13 349 | 84.7 | 6218 | 68.8 | 18.7±(4.7 | 26.0±16.3 | 13.4±12.6 |
| Ulsan | 1 145 705 | 48 285 | 459.8 | 42 518 | 410.7 | 11 278 | 106.6 | 4280 | 39.5 | 13.2±3.9 | 24.5±13.7 | 14.7±10.9 |
| Sejong | 326 245 | 9485 | 374.3 | 8422 | 335.0 | 2013 | 72.3 | 1271 | 44.1 | 2.6±1.7 | 26.6±17.4 | 18.1±11.5 |
| Gyeonggi | 13 043 732 | 534 922 | 464.3 | 473 711 | 419.6 | 111 328 | 95.2 | 47 131 | 54.4 | 146.5±19.4 | 27.4±15.6 | 11.8±12.4 |
| Gangwon | 1 528 656 | 112 181 | 778.6 | 99 622 | 703.7 | 24 108 | 157.4 | 13 470 | 114.5 | 30.7±6.1 | 22.2±12.4 | 11.2±11.3 |
| Chungcheongbuk | 1 589 355 | 106 228 | 714.8 | 94 630 | 650.3 | 21 624 | 140.3 | 12 846 | 107.7 | 29.1±5.9 | 28.4±16.9 | 11.6±12.0 |
| Chungcheongnam | 2 110 584 | 144 490 | 738.8 | 127 260 | 663.0 | 29 512 | 145.9 | 15 553 | 101.0 | 39.6±7.3 | 25.4±14.7 | 12.3±12.7 |
| Jeollabuk | 1 816 001 | 138 201 | 799.6 | 123 494 | 730.1 | 28 954 | 158.0 | 15 570 | 120.3 | 37.8±7.0 | 27.1±15.5 | 12.7±12.2 |
| Jeollanam | 1 863 279 | 165 208 | 900.6 | 147 782 | 827.7 | 34 854 | 184.4 | 18 141 | 119.7 | 45.2±7.7 | 20.2±11.3 | 13.8±11.5 |
| Gyeongsangbuk | 2 653 916 | 208 758 | 817.5 | 187 561 | 746.6 | 48 059 | 172.9 | 24 531 | 124.6 | 57.2±9.0 | 22.1±12.5 | 12.5±11.3 |
| Gyeongsangnam | 3 348 258 | 208 686 | 660.0 | 186 865 | 599.2 | 50 819 | 144.4 | 21 419 | 83.4 | 57.1±9.2 | 22.8±11.9 | 14.0±11.2 |
| Jeju | 663 489 | 34 369 | 596.2 | 30 235 | 533.8 | 6132 | 97.5 | 3572 | 86.5 | 9.4±3.3 | 14.7±11.0 | 16.6±10.6 |
| Total | 51 337 424 | 2 749 704 | 574.7 | 2 453 686 | 521.6 | 591 267 | 117.3 | 272 107 | 71.4 | 752.9±69.3 | 24.4±12.7 | 13.4±11.6 |
- 1. Fuller R, Landrigan PJ, Balakrishnan K, Bathan G, Bose-O’Reilly S, Brauer M, et al. Pollution and health: a progress update. Lancet Planet Health 2022;6(6):e535-e547. https://doi.org/10.1016/S2542-5196(22)00090-0ArticlePubMed
- 2. Cohen AJ, Brauer M, Burnett R, Anderson HR, Frostad J, Estep K, et al. Estimates and 25-year trends of the global burden of disease attributable to ambient air pollution: an analysis of data from the Global Burden of Diseases Study 2015. Lancet 2017;389(10082):1907-1918. https://doi.org/10.1016/S0140-6736(17)30505-6ArticlePubMedPMC
- 3. Burnett R, Chen H, Szyszkowicz M, Fann N, Hubbell B, Pope CA 3rd, et al. Global estimates of mortality associated with long-term exposure to outdoor fine particulate matter. Proc Natl Acad Sci U S A 2018;115(38):9592-9597. https://doi.org/10.1073/pnas.1803222115ArticlePubMedPMC
- 4. Sang S, Chu C, Zhang T, Chen H, Yang X. The global burden of disease attributable to ambient fine particulate matter in 204 countries and territories, 1990-2019: a systematic analysis of the Global Burden of Disease Study 2019. Ecotoxicol Environ Saf 2022;238: 113588ArticlePubMed
- 5. Han C, Kim S, Lim YH, Bae HJ, Hong YC. Spatial and temporal trends of number of deaths attributable to ambient PM2.5 in the Korea. J Korean Med Sci 2018;33(30):e193. https://doi.org/10.3346/jkms.2018.33.e193ArticlePubMedPMC
- 6. Orellano P, Reynoso J, Quaranta N, Bardach A, Ciapponi A. Shortterm exposure to particulate matter (PM10 and PM2.5), nitrogen dioxide (NO2), and ozone (O3) and all-cause and causespecific mortality: systematic review and meta-analysis. Environ Int 2020;142: 105876. https://doi.org/10.1016/j.envint.2020.105876ArticlePubMed
- 7. Chen R, Yin P, Meng X, Liu C, Wang L, Xu X, et al. Fine particulate air pollution and daily mortality. A nationwide analysis in 272 Chinese cities. Am J Respir Crit Care Med 2017;196(1):73-81. https://doi.org/10.1164/rccm.201609-1862OCArticlePubMed
- 8. Chen C, Zhu P, Lan L, Zhou L, Liu R, Sun Q, et al. Short-term exposures to PM2.5 and cause-specific mortality of cardiovascular health in China. Environ Res 2018;161: 188-194. https://doi.org/10.1016/j.envres.2017.10.046ArticlePubMed
- 9. Li T, Guo Y, Liu Y, Wang J, Wang Q, Sun Z, et al. Estimating mortality burden attributable to short-term PM2.5 exposure: a national observational study in China. Environ Int 2019;125: 245-251. https://doi.org/10.1016/j.envint.2019.01.073ArticlePubMedPMC
- 10. Lim YH, Kim S, Han C, Bae HJ, Seo SC, Hong YC. Source country-specific burden on health due to high concentrations of PM2.5. Environ Res 2020;182: 109085. https://doi.org/10.1016/j.envres.2019.109085ArticlePubMed
- 11. Burnett RT, Pope CA 3rd, Ezzati M, Olives C, Lim SS, Mehta S, et al. An integrated risk function for estimating the global burden of disease attributable to ambient fine particulate matter exposure. Environ Health Perspect 2014;122(4):397-403. https://doi.org/10.1289/ehp.1307049ArticlePubMedPMC
- 12. Yan M, Wilson A, Bell ML, Peng RD, Sun Q, Pu W, et al. The shape of the concentration-response association between fine particulate matter pollution and human mortality in Beijing, China, and its implications for health impact assessment. Environ Health Perspect 2019;127(6):67007. https://doi.org/10.1289/EHP4464ArticlePubMed
- 13. World Health Organization. WHO global air quality guidelines: particulate matter (PM2.5 and PM10), ozone, nitrogen dioxide, sulfur dioxide and carbon monoxide; 2021 [cited 2024 Jan 2]. Available from: https://www.who.int/publications/i/item/9789240034228
- 14. Ramachandran S, Rajesh TA. Black carbon aerosol mass concentrations over Ahmedabad, an urban location in western India: comparison with urban sites in Asia, Europe, Canada, and the United States. J Geophys Res 2007;112: D06211. https://doi.org/10.1029/2006JD007488Article
- 15. Cheng Z, Luo L, Wang S, Wang Y, Sharma S, Shimadera H, et al. Status and characteristics of ambient PM2.5 pollution in global megacities. Environ Int 2016;89-90: 212-221. https://doi.org/10.1016/j.envint.2016.02.003ArticlePubMed
- 16. Kim J, Kim SY. Comparative analysis of administrative databases for particulate matter air pollution between South Korea and the United States. J Environ Policy Adm 2020;28(1):71-100. (Korean). https://doi.org/10.15301/jepa.2020.28.1.71Article
- 17. Byun D, Schere KL. Review of the governing equations, computational algorithms, and other components of the Models-3 Community Multiscale Air Quality (CMAQ) modeling system. Appl Mech Rev 2006;59(2):51-77. https://doi.org/10.1115/1.2128636Article
- 18. Lee S, Park H, Kim S, Lee EK, Lee J, Hong YS, et al. Fine particulate matter and incidence of metabolic syndrome in non-CVD patients: a nationwide population-based cohort study. Int J Hyg Environ Health 2019;222(3):533-540. https://doi.org/10.1016/j.ijheh.2019.01.010ArticlePubMed
- 19. Almeida SP, Casimiro E, Calheiros J. Effects of apparent temperature on daily mortality in Lisbon and Oporto, Portugal. Environ Health 2010;9: 12. https://doi.org/10.1186/1476-069X9-12ArticlePubMedPMC
- 20. Alessandrini E, Zauli Sajani S, Scotto F, Miglio R, Marchesi S, Lauriola P. Emergency ambulance dispatches and apparent temperature: a time series analysis in Emilia-Romagna, Italy. Environ Res 2011;111(8):1192-1200. https://doi.org/10.1016/j.envres.2011.07.005ArticlePubMed
- 21. Guan M, Sun C, Tang D, Kang H, Chen F. A time-series analysis on the association between fine particulate matter and daily mortality - Shijiazhuang city, Hebei Province, China, 2015-2020. China CDC Wkly 2022;4(11):226-231. https://doi.org/10.46234/ccdcw2022.052ArticlePubMedPMC
- 22. Shi Y, Xiao J, Shen Y, Yamaguchi Y. Quantifying the spatial differences of landscape change in the Hai River Basin, China, in the 1990s. Int J Remote Sens 2012;33(14):4482-4501. https://doi.org/10.1080/01431161.2011.649863Article
- 23. Cho ME, Kim MJ. Residents’ perceptions of and response behaviors to particulate matter—a case study in Seoul, Korea. Appl Sci 2019;9(18):3660. https://doi.org/10.3390/app9183660Article
- 24. Baik D, Kim BW, Ki M. Increasing trends in mortality and costs of infectious diseases in Korea: trends in mortality and costs of infectious diseases. Epidemiol Health 2022;44: e2022010. https://doi.org/10.4178/epih.e2022010ArticlePubMedPMC
- 25. Heo S, Son JY, Lim CC, Fong KC, Choi HM, Hernandez-Ramirez RU, et al. Effect modification by sex for associations of fine particulate matter (PM2.5) with cardiovascular mortality, hospitalization, and emergency room visits: systematic review and meta-analysis. Environ Res Lett 2022;17(5):053006. https://doi.org/10.1088/1748-9326/ac6cfbArticlePubMedPMC
- 26. Liao M, Braunstein Z, Rao X. Sex differences in particulate air pollution-related cardiovascular diseases: a review of human and animal evidence. Sci Total Environ 2023;884: 163803. https://doi.org/10.1016/j.scitotenv.2023.163803ArticlePubMed
- 27. Kim HK, Lee SH. The effects of population aging on South Korea’s economy: the National Transfer Accounts approach. J Econ Ageing 2021;20: 100340. https://doi.org/10.1016/j.jeoa.2021.100340Article
- 28. Boing AF, deSouza P, Boing AC, Kim R, Subramanian SV. Air pollution, socioeconomic status, and age-specific mortality risk in the United States. JAMA Netw Open 2022;5(5):e2213540. https://doi.org/10.1001/jamanetworkopen.2022.13540ArticlePubMedPMC
- 29. Schraufnagel DE, Balmes JR, De Matteis S, Hoffman B, Kim WJ, Perez-Padilla R, et al. Health benefits of air pollution reduction. Ann Am Thorac Soc 2019;16(12):1478-1487. https://doi.org/10.1513/AnnalsATS.201907-538CMEArticlePubMed
- 30. Qu Z, Wang X, Li F, Li Y, Chen X, Chen M. PM2.5-related health economic benefits evaluation based on air improvement action plan in Wuhan city, middle China. Int J Environ Res Public Health 2020;17(2):620. https://doi.org/10.3390/ijerph17020620ArticlePubMedPMC
- 31. Trnka D. OECD environment working papers No. 158: policies, regulatory framework and enforcement for air quality management: the case of Korea. 2020 [cited 2024 Jan 2]. Available from: https://doi.org/10.1787/19970900Article
- 32. Baker D, Nieuwenhuijsen MJ. Environmental epidemiology: study methods and application. Oxford: Oxford University Press; 2008. p. 93-112
- 33. Xi Y, Richardson DB, Kshirsagar AV, Wade TJ, Flythe JE, Whitsel EA, et al. Effects of short-term ambient PM2.5 exposure on cardiovascular disease incidence and mortality among U.S. hemodialysis patients: a retrospective cohort study. Environ Health 2022;21(1):33. https://doi.org/10.1186/s12940-022-00836-0ArticlePubMedPMC
- 34. Ward-Caviness CK, Weaver AM, Buranosky M, Pfaff ER, Neas LM, Devlin RB, et al. Associations between long-term fine particulate matter exposure and mortality in heart failure patients. J Am Heart Assoc 2020;9(6):e012517. https://doi.org/10.1161/JAHA.119.012517ArticlePubMedPMC
 PubReader
 ePub Link
 Cite
Cite