
Articles
- Page Path
- HOME > J Prev Med Public Health > Volume 54(5); 2021 > Article
-
Original Article
Association Between Cohabitation Status and Sleep Quality in Families of Persons With Dementia in Korea: A Cross-sectional Study -
Seung Hoon Kim1,2
 , Minah Park2,3, Sung Hoon Jeong2,3, Sung-In Jang1,2, Eun-Cheol Park1,2
 -
Journal of Preventive Medicine and Public Health 2021;54(5):317-329.
DOI: https://doi.org/10.3961/jpmph.21.077
Published online: August 14, 2021
1Department of Preventive Medicine, Yonsei University College of Medicine, Seoul, Korea
2Institute of Health Services Research, Yonsei University, Seoul, Korea
3Department of Public Health, Graduate School, Yonsei University, Seoul, Korea
- Corresponding author: Eun-Cheol Park Department of Preventive Medicine Yonsei University College of Medicine, 50-1 Yonsei-ro, Seodaemun-gu, Seoul 03722, Korea E-mail: ecpark@yuhs.ac
Copyright © 2021 The Korean Society for Preventive Medicine
This is an Open Access article distributed under the terms of the Creative Commons Attribution Non-Commercial License (http://creativecommons.org/licenses/by-nc/4.0/) which permits unrestricted non-commercial use, distribution, and reproduction in any medium, provided the original work is properly cited.
ABSTRACT
-
Objectives
- The aim of this study was to identify the association between cohabitation status and sleep quality in family members of people with dementia (PwDs).
-
Methods
- Data of 190 365 participants aged ≥19 years from the 2018 Korea Community Health Survey were analyzed. Participants were categorized according to their cohabitation status with PwDs. Multiple logistic regression and ordinal logistic regression analyses were performed to evaluate the relationship between the cohabitation status of PwDs’ relatives and sleep quality measured using the Pittsburgh Sleep Quality Index (PSQI) and PSQI subscales.
-
Results
- Compared to participants without PwDs in their families, both cohabitation and non-cohabitation with PwDs were associated with poor sleep quality (cohabitation, male: odds ratio [OR],1.28; 95% confidence interval [CI], 1.08 to 1.52; female: OR, 1.40; 95% CI, 1.20 to 1.64; non-cohabitation, male: OR, 1.14; 95% CI, 1.05 to 1.24; female: OR, 1.23; 95% CI, 1.14 to 1.33). In a subgroup analysis, non-cohabiting family members showed the highest odds of experiencing poor sleep quality when the PwD lived alone (male: OR, 1.48; 95% CI, 1.14 to 1.91; female: OR, 1.58; 95% CI, 1.24 to 2.01). Cohabiting male and female participants had higher odds of poor subjective sleep quality and use of sleeping medications than non-cohabiting male and female participants, respectively.
-
Conclusions
- The residence of PwDs and cohabitation status may contribute to poor sleep quality among PwDs’ family members. The circumstances faced by cohabiting and non-cohabiting family members should be considered when evaluating sleep quality in family members of PwDs, and appropriate interventions may be needed to improve sleep quality in both cohabiting and non-cohabiting family members.
- Approximately 50 million people have dementia worldwide, and nearly 10 million new cases occur every year [1]. As no treatment to date is available to cure dementia or to alter its progressive course, dementia is one of the representative diseases that cause disabling and burdensome health issues [2]. A loved one’s diagnosis of dementia can be one of the saddest events in a person’s life and comes with special challenges. Since a dementia diagnosis is confirmed well after the onset of symptoms, the family of a person with dementia (PwD) may not be able to understand the PwD’s behavior before a diagnosis is established [3]. Because PwDs experience relentless cognitive deterioration and corresponding behavioral changes, they require the support of caregivers for many hours of the day; moreover, family members may feel confused about their newfound roles as caregivers post-diagnosis. Although approximately 90% of PwDs are institutionalized before their death, approximately 84% of PwDs worldwide live at home until their family cannot care for them [4,5].
- Family members of PwDs may not only experience physical burdens, but also psychological or emotional burdens such as guilt arising from the belief that it is their responsibility to care for their relative [6,7]. Thus, being a caregiver may be associated with exposure to stress, a decrease in subjective physical health and social networking, and an increased risk of depression and mortality [8-10].
- Another problem of long-term care for dementia patients is sleep disturbances in their family members. Sleep disturbances are associated with a high risk of cardiovascular disease, depressive symptoms, and all-cause mortality [11,12]. A previous study reported that approximately two-thirds of caregivers for PwDs experienced sleep disturbances [13,14]; and most studies on sleep quality in family members of PwDs have focused on family caregivers living with PwDs. However, family members may feel guilty and lonely even if they do not live with a PwD [15], and strong negative and weak positive emotions can affect sleep quality in non-cohabiting family members [16].
- Although the existence of dementia patients in the family may adversely affect the sleep quality of family members, no study has yet examined sleep quality according to the cohabitation status of family members of PwDs. Therefore, this study investigated the association between the cohabitation status of family members of PwDs and sleep quality based on the quantitative and subjective aspects of sleep using the Korean version of the Pittsburgh Sleep Quality Index (PSQI-K) [17].
INTRODUCTION
- Study Population and Data
- The study data were obtained from the Korea Community Health Survey (KCHS) in 2018. The KCHS is a nationwide survey of public health and health behaviors that has been administered by the Korea Disease Control and Prevention Agency (formerly the Korea Centers for Disease Control and Prevention) since 2008. The dataset used in this study is publicly available on the KCHS’s official website (https://chs.kdca.go.kr/chs/). Stratified cluster sampling methods were used to select sample areas, and systematic sampling methods were used to select sample households in the KCHS. A trained interviewer personally visited the households selected for the sample and conducted a survey with adults aged ≥19 years living within these households. The questionnaire comprised approximately 201 items in 21 areas and included questions on demographic characteristics, subjective health levels, health-related behaviors, and chronic disease history.
- In total, 228 340 people participated in the 2018 KCHS. Participants who did not identify their cohabitation status with a PwD or had missing data on covariates were excluded from this study. People from single-person households whose sleep quality was unlikely to be affected by other family members and participants with dementia were also excluded. Finally, 190 365 participants were included.
- Variables
- The main dependent variable was sleep quality, which was measured using the PSQI-K, a tool for evaluating sleep quality and quantity during the past month. The Pittsburgh Sleep Quality Index (PSQI) is the gold standard screening tool for evaluating sleep dysfunction and has been validated in both clinical and non-clinical samples [18,19]. The PSQI-K also showed high sensitivity and specificity and was previously validated [17]. The PSQI-K comprises 18 questions using a 4-point Likert scale (0-3) that are categorized into 7 subscales for sleep and daytime functions: subjective sleep quality, sleep latency, sleep duration, habitual sleep efficiency, sleep disturbance, use of sleeping medication, and daytime dysfunction. The questions on the PSQI-K and the detailed method of calculating the scores for the 7 components based on each question are presented in Supplemental Material 1. The global PSQI score is the sum of the scores for each subscale and ranges from 0 to 21. In this study, a score of ≤5 indicated good sleep quality, and a score of >5 indicated poor sleep quality [20]. Previous research validated the use of a cut-off point of 5 in the PSQI-K [21,22]. Furthermore, the internal reliability of the PSQI-K used in this study was examined using Cronbach’s alpha coefficient for internal consistency. Cronbach’s alpha was 0.75 for the total PSQI-K score, indicating high reliability.
- The independent variable was the cohabitation status of family members of PwDs. Participants were classified into the following 3 groups depending on whether they had a PwD in their family and whether they lived with the PwD: family members without a PwD (reference group), non-cohabiting family members of a PwD, and family members cohabiting with a PwD. Furthermore, the non-cohabiting family members were subdivided based on the residence of the PwD.
- This study included demographic and socioeconomic characteristics (age, marital status, the number of family members and cohabiting generations, educational level, income level, and employment status), the number of chronic diseases (hypertension and diabetes mellitus), depressive symptoms, and health-related behaviors (smoking status, alcohol consumption, and physical activity) as covariates. Depressive symptoms were evaluated using the Patient Health Questionnaire-9 (PHQ-9), and categorized as either present (PHQ-9 score ≥10) or absent (PHQ-9 score <10) [23]. Participants with high physical activity levels were defined as those who walked ≥30 min/d for ≥5 d/wk.
- Statistical Analysis
- All analyses were conducted separately for male and female in consideration of the factors influencing sex differences in sleep quality [22,24]. We used the chi-square test to assess differences in the frequencies and proportions of categorical variables. Multiple logistic regression analysis was performed to examine the association between cohabitation status and sleep quality after adjusting for covariates. Subgroup analyses were conducted to evaluate the association of the residence of PwDs with sleep quality in their family members, and then the data were analyzed by cohabitation status using multiple logistic regression analyses. Finally, for the dependent subgroup analyses, multivariable ordinal logistic regression analysis was conducted to investigate the association between cohabitation status and the PSQI components. The response variables for dependent subgroup analyses were categorical variables that had 4 possible levels with an ordinal nature (e.g., subjective sleep quality: very good, fairly good, fairly bad, and very bad) [25]. All statistical analyses were performed using SAS version 9.4 (SAS Institute Inc., Cary, NC, USA), and a weighted logistic regression procedure was used to account for the complex and stratified sampling design of the KCHS. Two-sided p-values <0.05 were considered to indicate statistical significance.
- Ethics Statement
- Since the KCHS is a survey conducted by the government for the public welfare, ethics approval for the KCHS was waived by the Bioethics and Safety Act, 2015.
METHODS
- The participants’ general characteristics are described in Table 1. Of the 190 365 participants, 89 197 (46.9%) were male. 30 814 (34.5%) of the male participants and 45 496 (45.0%) of the female participants experienced poor sleep quality. Among the male family members of a PwD, 1174 lived with the PwD and 4034 lived separately from the PwD. Moreover, 526 (44.8%) cohabiting male family members of PwDs and 1497 (37.1%) non-cohabiting family members experienced poor sleep quality. In contrast, 736 (56.5%) of the 1302 cohabiting female family members and 2220 (48.3%) of the 4596 non-cohabiting female family members reported poor sleep quality. Table 2 outlines the general characteristics of participants with cohabitation status. Overall, family members living with PwDs were more likely to be divorced, have ≥5 family members, live with ≥2 generations, have low income, be unemployed, or have depression or chronic disease. In contrast, non-cohabiting family members of PwDs were more likely to have a higher family income and education level.
- Table 3 presents the factors associated with poor sleep quality. After adjusting for covariates, cohabiting family members of PwDs were more likely to have poor sleep quality than members of families without a PwD. These results were significant in both male (odds ratio [OR],1.28; 95% confidence interval [CI], 1.08 to 1.52) and female (OR, 1.40; 95% CI, 1.20 to 1.64). Furthermore, non-cohabiting family members of PwDs also showed higher odds of poor sleep quality than family members without a PwD (male: OR, 1.14; 95% CI, 1.05 to 1.24; female: OR, 1.23; 95% CI, 1.14 to 1.33). In subgroup analyses, a very low family income level and the presence of depressive symptoms were associated with poor sleep quality in both sexes among noncohabiting family members of PwDs. A low-level of education was associated with poor sleep quality in male participants (Supplemental Material 2). Among cohabiting family members with PwDs, an age of 50-59 years, a very low family income level, a low-level of education, and depressive symptoms were associated with poor sleep quality in both sexes. Divorced male participants were also more likely to have poor sleep quality than married male participants (Supplemental Material 3).
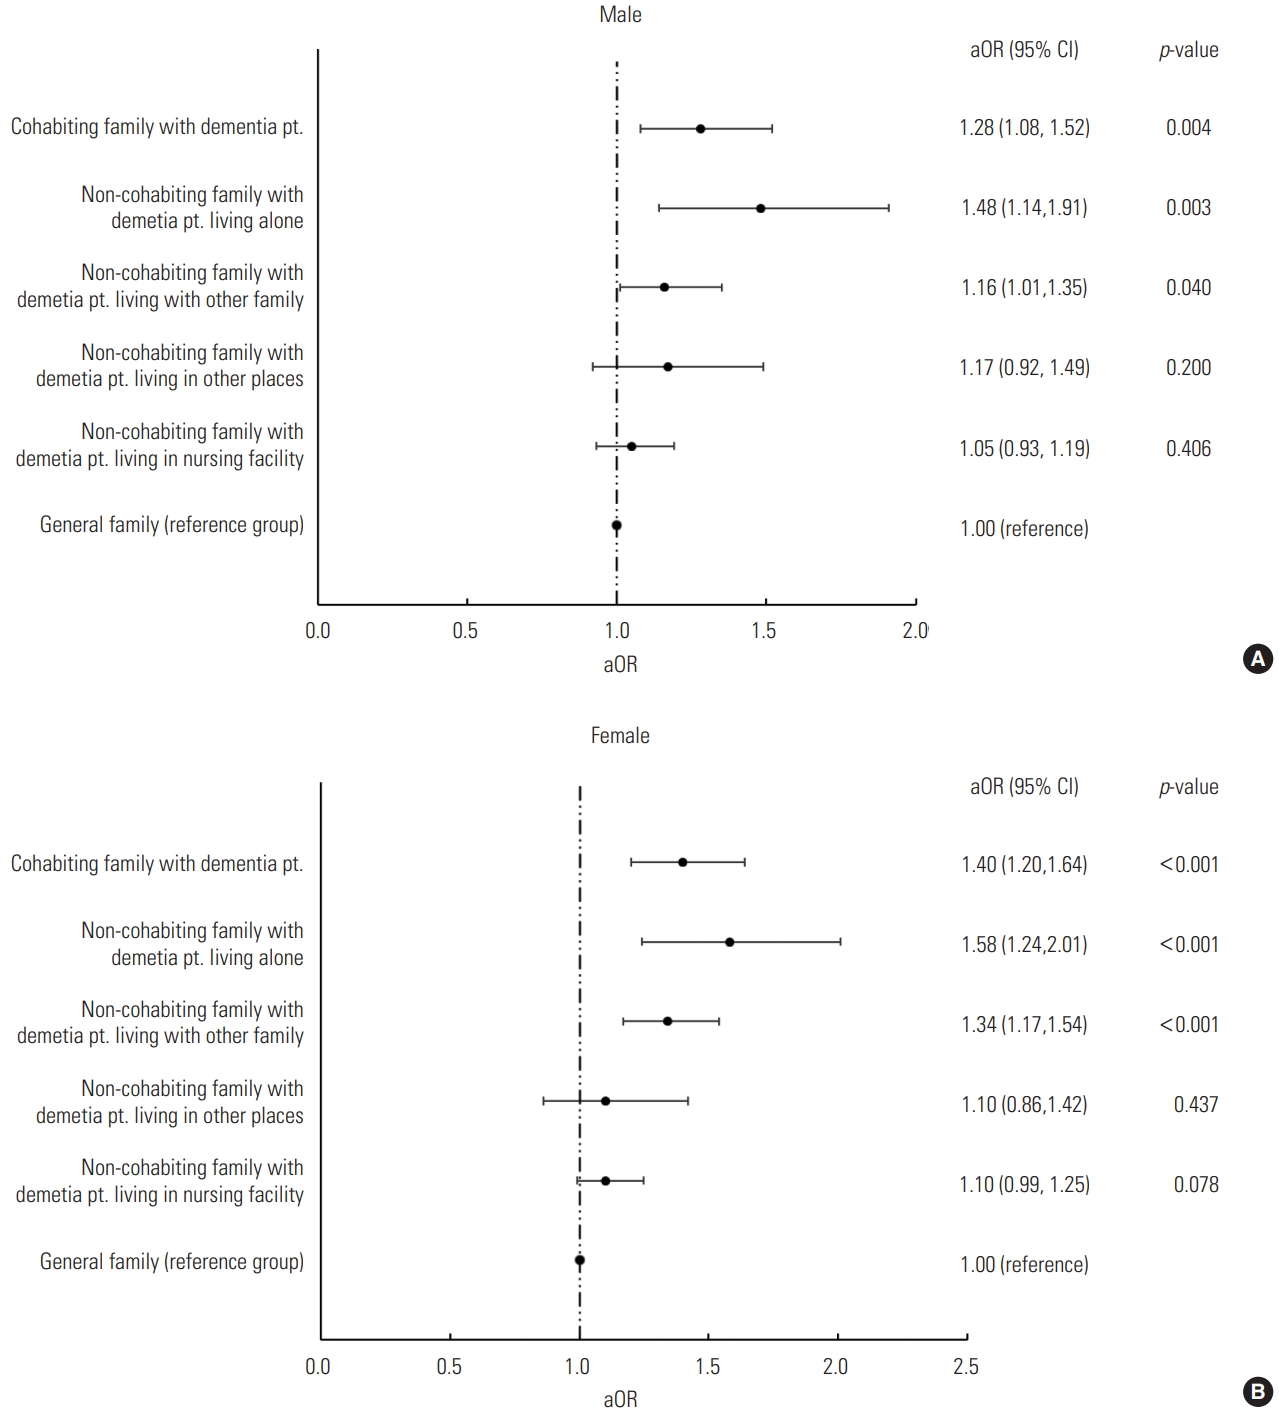
- Figure 1 presents the analysis of sleep quality in family members of PwDs according to the PwD’s residence. Among noncohabiting relatives, the odds of having poor sleep quality significantly increased when the PwD lived alone (male: OR, 1.48; 95% CI, 1.14 to 1.91; female: OR, 1.58; 95% CI, 1.24 to 2.01) or with other family members (male: OR, 1.16; 95% CI, 1.01 to 1.35; female: OR, 1.34; 95% CI, 1.17 to 1.54). However, when the PwD lived in a nursing facility, the sleep quality of non-cohabiting family members did not differ from that of family members without a PwD.
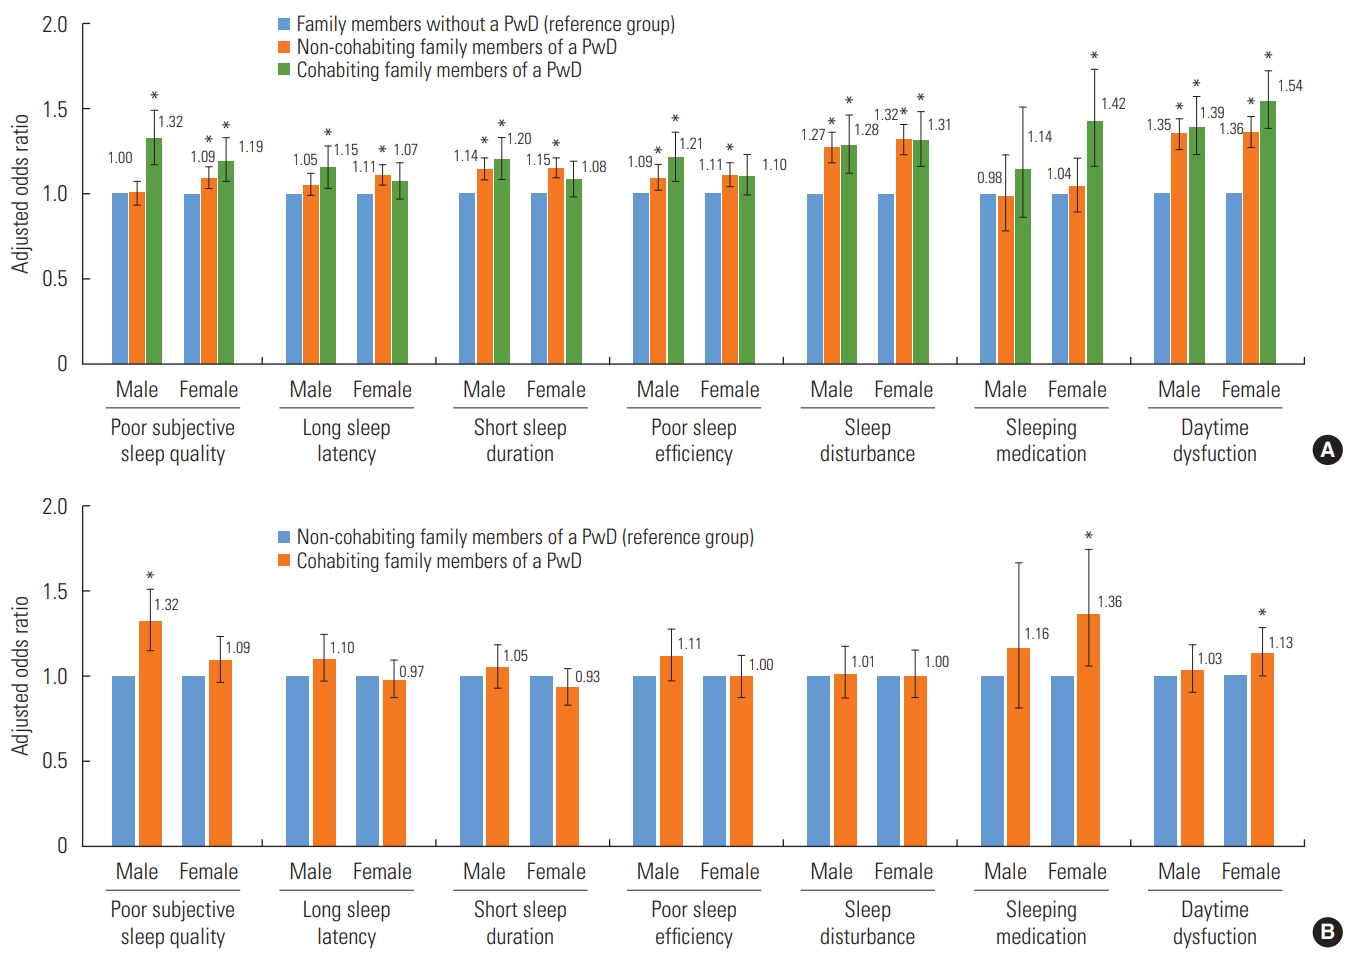
- Figure 2 shows the results of multivariable ordinal logistic regression analysis of the association between the cohabitation status of family members of PwDs and PSQI subscales. In female participants, the presence of a PwD in the family regardless of cohabitation status was significantly associated with poor subjective sleep quality, sleep disturbances, and daytime dysfunction. In male participants, the presence of a PwD in the family regardless of cohabitation status was associated with short sleep duration, poor sleep efficiency, sleep disturbances, and daytime dysfunction. Additionally, cohabiting male participants had a higher probability of poor subjective sleep quality (OR, 1.32; 95% CI, 1.15 to 1.51) and cohabiting female participants were more likely to use sleeping medications (OR, 1.36; 95% CI, 1.06 to 1.74) and experience daytime dysfunction (OR, 1.13; 95% CI, 1.00 to 1.27) than non-cohabiting male and female relatives of PwDs.
RESULTS
- This study revealed that family members living with PwDs had significantly higher odds of experiencing poor sleep quality, similar to the results of previous studies [13]. Among family members living with PwDs, a very low family income level and low-level of education were associated with poor sleep quality in both male and female participants. As in previous studies, people living with PwDs were more likely to have depression or chronic diseases than their counterparts [13].
- In 2019, more than 16 million family members and other unpaid caregivers provided about 18.6 billion hours of care to individuals with dementia, worth nearly US$244 billion [26]. Moreover, the caregivers’ burden is known to be higher in those who care for individuals with dementia than in those who care for individuals with other chronic diseases [27]. Individuals living with a PwD may face various challenges in caring for the PwD every day and may need to make care-related decisions [28]. However, caregivers are often unprepared for their roles and responsibilities, are not very familiar with treatment options, are uncertain about patient preferences, and often do not get expert support in making decisions [28,29]. In this study, a low-level of education may have been related to inexperience in responding to unpredictable situations in caring for dementia patients, which may have been linked to poor sleep quality. Our findings demonstrated the need to develop and to apply appropriate interventions such as education for caring for dementia patients, as well as financial support, to reduce the caregiving burden on family members living with a PwD to improve their sleep quality.
- Interestingly, even family members not living with a PwD were more likely to have poor sleep quality than family members without a PwD. Factors associated with poor sleep quality among the non-cohabiting group were a very low family income level and presence of depressive symptoms in both sexes and a low-level of education in male participants. These results imply that a low economic level—that is, the economic burden—in non-cohabiting family members of PwDs, as with cohabiting family members, may adversely affect sleep quality [30]. In addition, low-levels of education, which were associated with poor sleep quality in male participants, are inseparable from the economic burden. This can be explained by the traditional Korean gender role for men, who are primarily responsible for household finances [31]. Depressive symptoms were also found to be highly associated with poor sleep quality in cohabitating and non-cohabitating family members, so they are essential to consider when planning a management policy for the families of PwDs [30,31].
- Furthermore, the results of subgroup analyses based on the PwDs’ residence showed that non-cohabiting family members of a PwD had significantly higher odds of having poor sleep quality when the PwD lived alone or with other family members. When the PwD lived alone, the probability of a family member experiencing poor sleep quality was the most prominent, which was presumably due to guilt and anxiety about not caring for the PwD directly [32]. Previous research reported that approximately 65% of caregivers for PwDs express feelings of guilt [33,34] and caregiving–related distress predicted sleep problems [35]. In contrast, when the PwD lived in a nursing facility, there was no significant difference in sleep quality between family members of a PwD and those without a PwD. This may be explained by the results of a previous study, which reported that family members of PwDs felt relief, but also had a troubled conscience, when placing a relative with dementia in a nursing home [36]. In other words, family members who relocated the PwD to a nursing facility showed ambivalence, and it can be assumed that this was reflected in sleep quality. These results imply that non-cohabiting family members of a PwD, especially those of a PwD who lives alone, may require appropriate interventions that consider the differences in their circumstances such as the “New Orange Plan,” a comprehensive support system for PwDs via home-visit nurses in Japan [32].
- Another notable finding was that cohabiting male and female relatives of a PwD had a higher probability of poor subjective sleep quality and use of sleeping medications than non-cohabiting male and female family members of a PwD, respectively. These results indicate that when investigating the cause of poor sleep quality and developing appropriate interventions in family members of PwDs, researchers should consider the difference between male and female family members.
- Our study has some limitations. First, it was not possible to identify the exact roles of the family members regarding caregiving and the burden of caregivers, since there were no survey data on caring for home-dwelling persons with dementia. The perceived health of caregivers varies depending on the level of the caregivers’ burden, and this burden is not the same for all family members [37]. Therefore, the sleep quality of family members can be affected by the relationship with the PwD and the role of other family members. Second, it was not possible to consider the type and severity of dementia, because the KCHS did not contain this information. The caregiving burden and quality of life of caregivers may vary according to the type of dementia, such as frontotemporal dementia or Alzheimer’s disease, as well as the severity or symptoms of dementia; thus, further studies are needed to consider these factors [38]. Third, the duration of caregiving may affect caregivers’ sleep quality, although we were unable to consider these factors in our study. Fourth, ordinal logistic regression was used to analyze the association between cohabitation status and the PSQI subscales because the items corresponding to each score were not uniform and previous studies were conducted through ordinal logistic regression [25,39], but there is a great deal of controversy about whether to use an ordinal model or a continuous model with respect to Likert-scale measurements [40]. Finally, the study’s cross-sectional nature did not allow us to clearly identify the direction of the relationship between cohabitation status and sleep quality. Further longitudinal studies are required to establish a causal relationship.
- Despite these limitations, our research has notable strengths. First, this study was based on nationwide representative data collected from 253 community health centers and 35 universities. Second, to the best of our knowledge, this is the first study to evaluate the association between the cohabitation status of family members of PwDs and sleep quality measured by the PSQI, a suitable tool for measuring sleep quality in the general population. Our research implies that appropriate interventions for improving sleep quality in family members of PwDs need to be developed and applied, regardless of whether family members live with a PwD.
- In conclusion, our research suggests that cohabitation status, the place where the PwD lives, and financial status can all affect sleep quality. Therefore, it is necessary to understand the circumstances influencing cohabiting and non-cohabiting family members when evaluating sleep quality in family members of PwDs, and appropriate interventions may be needed to improve sleep quality in both cohabiting and non-cohabiting family members.
DISCUSSION
SUPPLEMENTAL MATERIALS
-
CONFLICT OF INTEREST
The authors have no conflicts of interest associated with the material presented in this paper.
-
FUNDING
None.
Notes
ACKNOWLEDGEMENTS
-
AUTHOR CONTRIBUTIONS
Conceptualization: SHK, ECP. Data curation: SHK, MP, SHJ. Formal analysis: SHK. Funding acquisition: None. Methodology: SHK, ECP. Visualization: SHK, MP, SHJ. Writing – original draft: SHK. Writing – review & editing: MP, SHJ, SIJ, ECP.
Notes

| Characteristics |
Sleep quality |
||||||||
|---|---|---|---|---|---|---|---|---|---|
|
Male (n=89 197) |
Female (n=101 168) |
||||||||
| Total | Poor (PSQI>5) | Good (PSQI≤5) | p-value | Total | Poor (PSQI>5) | Good (PSQI≤5) | p-value | ||
| Total (n = 190 365) | 89 197 | 30 814 (34.5) | 58 383 (65.5) | 101 168 | 45 496 (45.0) | 55 672 (55.0) | |||
| Cohabitation status | <0.001 | <0.001 | |||||||
| Cohabiting family members of a PwD | 1174 | 526 (44.8) | 648 (55.2) | 1302 | 736 (56.5) | 566 (43.5) | |||
| Non-cohabiting family members of a PwD | 4034 | 1497 (37.1) | 2537 (62.9) | 4596 | 2220 (48.3) | 2376 (51.7) | |||
| Family members without a PwD | 83 989 | 28 791 (34.3) | 55 198 (65.7) | 95 270 | 42 540 (44.7) | 52 730 (55.3) | |||
| Age (y) | <0.001 | <0.001 | |||||||
| 19-29 | 9905 | 2907 (29.3) | 6998 (70.7) | 11 052 | 4099 (37.1) | 6953 (62.9) | |||
| 30-39 | 11 557 | 3839 (33.2) | 7718 (66.8) | 13 959 | 5613 (40.2) | 8346 (59.8) | |||
| 40-49 | 15 508 | 5174 (33.4) | 10 334 (66.6) | 18 178 | 6935 (38.2) | 11 243 (61.8) | |||
| 50-59 | 17 534 | 5807 (33.1) | 11 727 (66.9) | 21 549 | 9608 (44.6) | 11 941 (55.4) | |||
| 60-69 | 16 794 | 5835 (34.7) | 10 959 (65.3) | 18 552 | 9193 (49.6) | 9359 (50.4) | |||
| ≥70 | 17 899 | 7252 (40.5) | 10 647 (59.5) | 17 878 | 10 048 (56.2) | 7830 (43.8) | |||
| Marital status | <0.001 | <0.001 | |||||||
| Never married | 14 844 | 4725 (31.8) | 10 119 (68.2) | 12 317 | 4441 (36.1) | 7876 (63.9) | |||
| Divorced, widowed or separated | 3398 | 1510 (44.4) | 1888 (55.6) | 12 493 | 6604 (52.9) | 5889 (47.1) | |||
| Married | 70 955 | 24 579 (34.6) | 46 376 (65.4) | 76 358 | 34 451 (45.1) | 41 907 (54.9) | |||
| No. of family members | 0.004 | <0.001 | |||||||
| 2-4 | 81 036 | 28 113 (34.7) | 52 923 (65.3) | 90 503 | 41 001 (45.3) | 49 502 (54.7) | |||
| ≥5 | 8161 | 2701 (33.1) | 5460 (66.9) | 10 665 | 4495 (42.1) | 6170 (57.9) | |||
| No. of cohabiting generations | <0.001 | <0.001 | |||||||
| Over two generations | 6572 | 2218 (33.7) | 4354 (66.3) | 9397 | 4280 (45.5) | 5117 (54.5) | |||
| Two generations | 46 790 | 15 839 (33.9) | 30 951 (66.1) | 54 582 | 23 369 (42.8) | 31 213 (57.2) | |||
| One (couple) | 35 835 | 12 757 (35.6) | 23 078 (64.4) | 37 189 | 17 847 (48.0) | 19 342 (52.0) | |||
| Family income level | <0.001 | <0.001 | |||||||
| Very low | 12 060 | 4997 (41.4) | 7063 (58.6) | 13 648 | 7255 (53.2) | 6393 (46.8) | |||
| Low | 26 006 | 9599 (36.9) | 16 407 (63.1) | 29 420 | 14 506 (49.3) | 14 914 (50.7) | |||
| High | 24 447 | 7883 (32.2) | 16 564 (67.8) | 27 859 | 11 742 (42.1) | 16 117 (57.9) | |||
| Very high | 26 684 | 8335 (31.2) | 18 349 (68.8) | 30 241 | 11 993 (39.7) | 18 248 (60.3) | |||
| Highest level of education | <0.001 | <0.001 | |||||||
| Illiterate | 3364 | 1513 (45.0) | 1851 (55.0) | 10 553 | 6023 (57.1) | 4530 (42.9) | |||
| Elementary school | 11 363 | 4553 (40.1) | 6810 (59.9) | 16 212 | 8664 (53.4) | 7548 (46.6) | |||
| Middle school | 9953 | 3797 (38.1) | 6156 (61.9) | 10 857 | 5323 (49.0) | 5534 (51.0) | |||
| High school | 33 281 | 11 018 (33.1) | 22 263 (66.9) | 33 035 | 13 925 (42.2) | 19 110 (57.8) | |||
| College and above | 31 236 | 9933 (31.8) | 21 303 (68.2) | 30 511 | 11 561 (37.9) | 18 950 (62.1) | |||
| Employment status | <0.001 | <0.001 | |||||||
| Unemployed | 22 448 | 8741 (38.9) | 13 707 (61.1) | 46 324 | 22 689 (49.0) | 23 635 (51.0) | |||
| Blue-collar worker | 37 603 | 12 827 (34.1) | 24 776 (65.9) | 20 460 | 9389 (45.9) | 11 071 (54.1) | |||
| Pink-collar worker | 8948 | 2875 (32.1) | 6073 (67.9) | 15 467 | 6465 (41.8) | 9002 (58.2) | |||
| White-collar worker | 20 198 | 6371 (31.5) | 13 827 (68.5) | 18 917 | 6953 (36.8) | 11 964 (63.2) | |||
| Alcohol consumption (times/wk) | <0.001 | <0.001 | |||||||
| >1 | 32 293 | 11 624 (36.0) | 20 669 (64.0) | 10 966 | 5086 (46.4) | 5880 (53.6) | |||
| 0-1 | 37 771 | 12 303 (32.6) | 25 468 (67.4) | 51 879 | 22 327 (43.0) | 29 552 (57.0) | |||
| Never | 19 133 | 6887 (36.0) | 12 246 (64.0) | 38 323 | 18 083 (47.2) | 20 240 (52.8) | |||
| Smoking status | <0.001 | <0.001 | |||||||
| Current | 30 289 | 10 836 (35.8) | 19 453 (64.2) | 2474 | 1477 (59.7) | 997 (40.3) | |||
| Past | 34 227 | 12 419 (36.3) | 21 808 (63.7) | 2050 | 1144 (55.8) | 906 (44.2) | |||
| Never | 24 681 | 7559 (30.6) | 17 122 (69.4) | 96 644 | 42 875 (44.4) | 53 769 (55.6) | |||
| Physical activity | <0.001 | <0.001 | |||||||
| Low | 48 500 | 17 371 (35.8) | 31 129 (64.2) | 56 457 | 26 180 (46.4) | 30 277 (53.6) | |||
| High | 40 697 | 13 443 (33.0) | 27 254 (67.0) | 44 711 | 19 316 (43.2) | 25 395 (56.8) | |||
| Depressive symptoms | <0.001 | <0.001 | |||||||
| No | 87 151 | 29 050 (33.3) | 58 101 (66.7) | 97 224 | 41 943 (43.1) | 55 281 (56.9) | |||
| Yes | 2046 | 1764 (86.2) | 282 (13.8) | 3944 | 3553 (90.1) | 391 (9.9) | |||
| No. of chronic diseases1 | <0.001 | <0.001 | |||||||
| ≥1 | 28 526 | 10 931 (38.3) | 17 595 (61.7) | 28 143 | 14 954 (53.1) | 13 189 (46.9) | |||
| 0 | 60 671 | 19 883 (32.8) | 40 788 (67.2) | 73 025 | 30 542 (41.8) | 42 483 (58.2) | |||
| Variables |
Cohabitation status |
||||||
|---|---|---|---|---|---|---|---|
| Total | Family members without a PwD | Non-cohabiting family members of a PwD | Cohabiting family members of a PwD | p-value | |||
| Male (n = 89 197) | 89 197 | 83 989 (94.2) | 4034 (4.5) | 1174 (1.3) | |||
| Age (y) | <0.001 | ||||||
| 19-29 | 9905 | 9224 (11.0) | 590 (14.6) | 91 (7.8) | |||
| 30-39 | 11 557 | 11 180 (13.3) | 318 (7.9) | 59 (5.0) | |||
| 40-49 | 15 508 | 14 647 (17.4) | 717 (17.8) | 144 (12.3) | |||
| 50-59 | 17 534 | 16 070 (19.1) | 1187 (29.4) | 277 (23.6) | |||
| 60-69 | 16 794 | 15 731 (18.7) | 840 (20.8) | 223 (19.0) | |||
| ≥70 | 17 899 | 17 137 (20.4) | 382 (9.5) | 380 (32.4) | |||
| Marital status | <0.001 | ||||||
| Never married | 14 844 | 13 887 (16.5) | 749 (18.6) | 208 (17.7) | |||
| Divorced, widowed or separated | 3398 | 3203 (3.8) | 89 (2.2) | 106 (9.0) | |||
| Married | 70 955 | 66 899 (79.7) | 3196 (79.2) | 860 (73.3) | |||
| No. of family members | <0.001 | ||||||
| 2-4 | 81 036 | 76 401 (91.0) | 3678 (91.2) | 957 (81.5) | |||
| ≥5 | 8161 | 7588 (9.0) | 356 (8.8) | 217 (18.5) | |||
| No. of cohabiting generations | <0.001 | ||||||
| Over two generations | 6572 | 6050 (7.2) | 201 (5.0) | 321 (27.3) | |||
| Two generations | 46 790 | 43 864 (52.2) | 2409 (59.7) | 517 (44.0) | |||
| One (couple) | 35 835 | 34 075 (40.6) | 1424 (35.3) | 336 (28.6) | |||
| Family income level | <0.001 | ||||||
| Very low | 12 060 | 11 431 (13.6) | 378 (9.4) | 251 (21.4) | |||
| Low | 26 006 | 24 646 (29.3) | 959 (23.8) | 401 (34.2) | |||
| High | 24 447 | 23 084 (27.5) | 1099 (27.2) | 264 (22.5) | |||
| Very high | 26 684 | 24 828 (29.6) | 1598 (39.6) | 258 (22.0) | |||
| Highest level of education | <0.001 | ||||||
| Illiterate | 3364 | 3225 (3.8) | 65 (1.6) | 74 (6.3) | |||
| Elementary school | 11 363 | 10 841 (12.9) | 318 (7.9) | 204 (17.4) | |||
| Middle school | 9953 | 9426 (11.2) | 367 (9.1) | 160 (13.6) | |||
| High school | 33 281 | 31 125 (37.1) | 1714 (42.5) | 442 (37.6) | |||
| College and above | 31 236 | 29 372 (35.0) | 1570 (38.9) | 294 (25.0) | |||
| Employment status | <0.001 | ||||||
| Unemployed | 22 448 | 21 113 (25.1) | 870 (21.6) | 465 (39.6) | |||
| Blue-collar worker | 37 603 | 35 479 (42.2) | 1653 (41.0) | 471 (40.1) | |||
| Pink-collar worker | 8948 | 8404 (10.0) | 469 (11.6) | 75 (6.4) | |||
| White-collar worker | 20 198 | 18 993 (22.6) | 1042 (25.8) | 163 (13.9) | |||
| Alcohol consumption (times/wk) | <0.001 | ||||||
| >1 | 32 293 | 30 404 (36.2) | 1498 (37.1) | 391 (33.3) | |||
| 0-1 | 37 771 | 35 487 (42.3) | 1859 (46.1) | 425 (36.2) | |||
| Never | 19 133 | 18 098 (21.5) | 677 (16.8) | 358 (30.5) | |||
| Smoking status | 0.134 | ||||||
| Current | 30 289 | 28 525 (34.0) | 1386 (34.4) | 378 (32.2) | |||
| Past | 34 227 | 32 181 (38.3) | 1554 (38.5) | 492 (41.9) | |||
| Never | 24 681 | 23 283 (27.7) | 1094 (27.1) | 304 (25.9) | |||
| Physical activity | 0.003 | ||||||
| Low | 48 500 | 45 632 (54.3) | 2172 (53.8) | 696 (59.3) | |||
| High | 40 697 | 38 357 (45.7) | 1862 (46.2) | 478 (40.7) | |||
| Depressive symptoms | <0.001 | ||||||
| No | 87 151 | 82 096 (97.7) | 3944 (97.8) | 1111 (94.6) | |||
| Yes | 2046 | 1893 (2.3) | 90 (2.2) | 63 (5.4) | |||
| No. of chronic diseases1 | <0.001 | ||||||
| ≥1 | 28 526 | 26 877 (32.0) | 1191 (29.5) | 458 (39.0) | |||
| 0 | 60 671 | 57 112 (68.0) | 2843 (70.5) | 716 (61.0) | <0.001 | ||
| Female (n = 101 168) | |||||||
| Age (y) | 101 168 | 95 270 (94.2) | 4596 (4.5) | 1302 (1.3) | |||
| 19-29 | 11 052 | 10 356 (10.9) | 599 (13.0) | 97 (7.5) | |||
| 30-39 | 13 959 | 13 477 (14.1) | 420 (9.1) | 62 (4.8) | |||
| 40-49 | 18 178 | 16 902 (17.7) | 1094 (23.8) | 182 (14.0) | |||
| 50-59 | 21 549 | 19 846 (20.8) | 1425 (31.0) | 278 (21.4) | |||
| 60-69 | 18 552 | 17 569 (18.4) | 752 (16.4) | 231 (17.7) | |||
| ≥70 | 17 878 | 17 120 (18.0) | 306 (6.7) | 452 (34.7) | |||
| Marital status | <0.001 | ||||||
| Never married | 12 317 | 11 497 (12.1) | 670 (14.6) | 150 (11.5) | |||
| Divorced, widowed, or separated | 12 493 | 11 892 (12.5) | 344 (7.5) | 257 (19.7) | |||
| Married | 76 358 | 71 881 (75.4) | 3582 (77.9) | 895 (68.7) | |||
| No. of family members | <0.001 | ||||||
| 2-4 | 90 503 | 85 296 (89.5) | 4162 (90.6) | 1045 (80.3) | |||
| ≥5 | 10 665 | 9974 (10.5) | 434 (9.4) | 257 (19.7) | |||
| No. of cohabiting generations | <0.001 | ||||||
| Over two generations | 9397 | 8762 (9.2) | 247 (5.4) | 388 (29.8) | |||
| Two generations | 54 582 | 51 201 (53.7) | 2805 (61.0) | 576 (44.2) | |||
| One (couple) | 37 189 | 35 307 (37.1) | 1544 (33.6) | 338 (26.0) | |||
| Family income level | <0.001 | ||||||
| Very low | 13 648 | 12 927 (13.6) | 438 (9.5) | 283 (21.7) | |||
| Low | 29 420 | 27 888 (29.3) | 1087 (23.7) | 445 (34.2) | |||
| High | 27 859 | 26 264 (27.6) | 1295 (28.2) | 300 (23.0) | |||
| Very high | 30 241 | 28 191 (29.6) | 1776 (38.6) | 274 (21.0) | |||
| Highest level of education | <0.001 | ||||||
| Illiterate | 10 553 | 10 102 (10.6) | 186 (4.0) | 265 (20.4) | |||
| Elementary school | 16 212 | 15 473 (16.2) | 453 (9.9) | 286 (22.0) | |||
| Middle school | 10 857 | 10 207 (10.7) | 506 (11.0) | 144 (11.1) | |||
| High school | 33 035 | 30 799 (32.3) | 1877 (40.8) | 359 (27.6) | |||
| College and above | 30 511 | 28 689 (30.1) | 1574 (34.2) | 248 (19.0) | |||
| Employment status | <0.001 | ||||||
| Unemployed | 46 324 | 43 701 (45.9) | 1912 (41.6) | 711 (54.6) | |||
| Blue-collar worker | 20 460 | 19 410 (20.4) | 802 (17.4) | 248 (19.0) | |||
| Pink-collar worker | 15 467 | 14 402 (15.1) | 854 (18.6) | 211 (16.2) | |||
| White-collar worker | 18 917 | 17 757 (18.6) | 1028 (22.4) | 132 (10.1) | |||
| Alcohol consumption (times/wk) | <0.001 | ||||||
| >1 | 10 966 | 10 295 (10.8) | 556 (12.1) | 115 (8.8) | |||
| 0-1 | 51 879 | 48 703 (51.1) | 2626 (57.1) | 550 (42.2) | |||
| Never | 38 323 | 36 272 (38.1) | 1414 (30.8) | 637 (48.9) | |||
| Smoking status | 0.004 | ||||||
| Current | 2474 | 2334 (2.4) | 120 (2.6) | 20 (1.5) | |||
| Past | 2050 | 1913 (2.0) | 94 (2.0) | 43 (3.3) | |||
| Never | 96 644 | 91 023 (95.5) | 4382 (95.3) | 1239 (95.2) | |||
| Physical activity | <0.001 | ||||||
| Low | 56 457 | 53 196 (55.8) | 2461 (53.5) | 800 (61.4) | |||
| High | 44 711 | 42 074 (44.2) | 2135 (46.5) | 502 (38.6) | |||
| Depressive symptoms | <0.001 | ||||||
| No | 97 224 | 91 639 (96.2) | 4404 (95.8) | 1181 (90.7) | |||
| Yes | 3944 | 3631 (3.8) | 192 (4.2) | 121 (9.3) | |||
| No. of chronic diseases1 | <0.001 | ||||||
| ≥1 | 28 143 | 26 665 (28.0) | 963 (21.0) | 515 (39.6) | |||
| 0 | 73 025 | 68 605 (72.0) | 3633 (79.0) | 787 (60.4) | |||
| Variables |
Poor sleep quality (PSQI>5) |
||
|---|---|---|---|
| Male | Female | ||
| Cohabitation status | |||
| Cohabiting family members of a PwD | 1.28 (1.08, 1.52) | 1.40 (1.20, 1.64) | |
| Non-cohabiting family members of a PwD | 1.14 (1.05, 1.24) | 1.23 (1.14, 1.33) | |
| Family members without a PwD | 1.00 (reference) | 1.00 (reference) | |
| Age (y) | |||
| 19-29 | 0.86 (0.77, 0.96) | 0.82 (0.74, 0.92) | |
| 30-39 | 1.04 (0.95, 1.14) | 0.84 (0.78, 0.93) | |
| 40-49 | 0.97 (0.89, 1.06) | 0.77 (0.72, 0.85) | |
| 50-59 | 0.92 (0.85, 0.99) | 0.89 (0.83, 0.96) | |
| 60-69 | 0.90 (0.84, 0.96) | 0.94 (0.88, 1.01) | |
| ≥70 | 1.00 (reference) | 1.00 (reference) | |
| Marital status | |||
| Never married | 1.00 (0.93, 1.07) | 0.79 (0.73, 0.85) | |
| Divorced, widowed or separated | 1.32 (1.20, 1.45) | 1.03 (0.97, 1.09) | |
| Married | 1.00 (reference) | 1.00 (reference) | |
| No. of family members | |||
| 2–4 | 1.00 (0.93, 1.08) | 1.05 (0.98, 1.13) | |
| ≥5 | 1.00 (reference) | 1.00 (reference) | |
| No. of cohabiting generations | |||
| Over two generations | 1.05 (0.96, 1.16) | 1.04 (0.96, 1.13) | |
| Two generations | 1.12 (1.07, 1.17) | 1.08 (1.03, 1.13) | |
| One (couple) | 1.00 (reference) | 1.00 (reference) | |
| Family income level | |||
| Very low | 1.21 (1.13, 1.30) | 1.20 (1.12, 1.29) | |
| Low | 1.15 (1.09, 1.22) | 1.14 (1.08, 1.19) | |
| High | 1.01 (0.96, 1.06) | 1.01 (0.97, 1.06) | |
| Very high | 1.00 (reference) | 1.00 (reference) | |
| Highest level of education | |||
| Illiterate | 1.41 (1.25, 1.59) | 1.44 (1.32, 1.58) | |
| Elementary school | 1.31 (1.21, 1.41) | 1.45 (1.35, 1.57) | |
| Middle school | 1.27 (1.18, 1.36) | 1.30 (1.22, 1.40) | |
| High school | 1.05 (1.00, 1.10) | 1.09 (1.04, 1.14) | |
| College and above | 1.00 (reference) | 1.00 (reference) | |
| Employment status | |||
| Unemployed | 1.08 (1.01,1.15) | 1.12 (1.06, 1.17) | |
| Blue-collar worker | 1.01 (0.96, 1.07) | 0.99 (0.93, 1.06) | |
| Pink-collar worker | 0.97 (0.91, 1.04) | 0.98 (0.92, 1.04) | |
| White-collar worker | 1.00 (reference) | 1.00 (reference) | |
| Alcohol consumption (times/wk) | |||
| >1 | 1.18 (1.12, 1.25) | 1.26 (1.18, 1.33) | |
| 0-1 | 1.05 (1.00, 1.11) | 1.11 (1.07, 1.15) | |
| Never | 1.00 (reference) | 1.00 (reference) | |
| Smoking status | |||
| Current | 1.21 (1.15, 1.27) | 1.52 (1.36, 1.71) | |
| Past | 1.19 (1.13, 1.25) | 1.52 (1.36, 1.71) | |
| Never | 1.00 (reference) | 1.00 (reference) | |
| Physical activity | |||
| Low | 1.10 (1.06, 1.14) | 1.11 (1.07, 1.14) | |
| High | 1.00 (reference) | 1.00 (reference) | |
| Depressive symptoms | |||
| No | 0.09 (0.07, 0.10) | 0.09 (0.08, 0.10) | |
| Yes | 1.00 (reference) | 1.00 (reference) | |
| No. of chronic disease1 | |||
| ≥1 | 1.18 (1.13, 1.23) | 1.18 (1.12, 1.23) | |
| 0 | 1.00 (reference) | 1.00 (reference) | |
Values are presented as adjusted odds ratio (95% confidence interval).
PSQI, Pittsburgh Sleep Quality Index; PwD, person with dementia.
1 A chronic disease was defined as a diagnosis of hypertension or diabetes mellitus; The number of chronic diseases is the sum of the number of the above diagnoses.
- 1. World Health Organization. Dementia. [cited 2021 Jan 14]. Available from: https://www.who.int/news-room/fact-sheets/detail/dementia
- 2. Cova I, Markova A, Campini I, Grande G, Mariani C, Pomati S. Worldwide trends in the prevalence of dementia. J Neurol Sci 2017;379: 259-260ArticlePubMed
- 3. Speechly CM, Bridges-Webb C, Passmore E. The pathway to dementia diagnosis. Med J Aust 2008;189(9):487-489ArticlePubMed
- 4. Walter E, Pinquart M. How effective are dementia caregiver interventions? An updated comprehensive meta-analysis. Gerontologist 2020;60(8):609-619ArticlePubMed
- 5. Wimo A. Establishing and funding long term care infrastructure. In: the 33rd International Conference of Alzheimer’s Disease International. 2018 July 26-29; Chicago, USA: 2018. 26-29
- 6. Prunty MM, Foli KJ. Guilt experienced by caregivers to individuals with dementia: a concept analysis. Int J Older People Nurs 2019;14(2):e12227ArticlePubMed
- 7. Gallego-Alberto L, Losada A, Cabrera I, Romero-Moreno R, Pérez-Miguel A, Pedroso-Chaparro MDS, et al. “I feel guilty”. Exploring guilt-related dynamics in family caregivers of people with dementia. Clin Gerontol. 2020. 1-10ArticlePubMed
- 8. Almberg B, Grafström M, Krichbaum K, Winblad B. The interplay of institution and family caregiving: relations between patient hassles, nursing home hassles and caregivers’ burnout. Int J Geriatr Psychiatry 2000;15(10):931-939ArticlePubMed
- 9. Schulz R, Beach SR. Caregiving as a risk factor for mortality: the Caregiver Health Effects Study. JAMA 1999;282(23):2215-2219ArticlePubMed
- 10. Alzheimer’s Disease International. World Alzheimer report 2018. The state of the art of dementia research: new frontiers. 2018 [cited 2021 Jan 14]. Available from: https://www.alzint.org/u/WorldAlzheimerReport2018.pdf
- 11. Yin J, Jin X, Shan Z, Li S, Huang H, Li P, et al. Relationship of sleep duration with all-cause mortality and cardiovascular events: a systematic review and dose-response meta-analysis of prospective cohort studies. J Am Heart Assoc 2017;6(9):e005947ArticlePubMedPMC
- 12. Fang H, Tu S, Sheng J, Shao A. Depression in sleep disturbance: a review on a bidirectional relationship, mechanisms and treatment. J Cell Mol Med 2019;23(4):2324-2332ArticlePubMedPMC
- 13. McCurry SM, Logsdon RG, Teri L, Vitiello MV. Sleep disturbances in caregivers of persons with dementia: contributing factors and treatment implications. Sleep Med Rev 2007;11(2):143-153ArticlePubMedPMC
- 14. Gao C, Chapagain NY, Scullin MK. Sleep duration and sleep quality in caregivers of patients with dementia: a systematic review and meta-analysis. JAMA Netw Open 2019;2(8):e199891ArticlePubMedPMC
- 15. Høgsnes L, Melin-Johansson C, Norbergh KG, Danielson E. The existential life situations of spouses of persons with dementia before and after relocating to a nursing home. Aging Ment Health 2014;18(2):152-160ArticlePubMed
- 16. Baglioni C, Spiegelhalder K, Lombardo C, Riemann D. Sleep and emotions: a focus on insomnia. Sleep Med Rev 2010;14(4):227-238ArticlePubMed
- 17. Sohn SI, Kim DH, Lee MY, Cho YW. The reliability and validity of the Korean version of the Pittsburgh Sleep Quality Index. Sleep Breath 2012;16(3):803-812ArticlePubMed
- 18. Buysse DJ, Reynolds CF 3rd, Monk TH, Hoch CC, Yeager AL, Kupfer DJ. Quantification of subjective sleep quality in healthy elderly men and women using the Pittsburgh Sleep Quality Index (PSQI). Sleep 1991;14(4):331-338PubMed
- 19. Mollayeva T, Thurairajah P, Burton K, Mollayeva S, Shapiro CM, Colantonio A. The Pittsburgh sleep quality index as a screening tool for sleep dysfunction in clinical and non-clinical samples: a systematic review and meta-analysis. Sleep Med Rev 2016;25: 52-73ArticlePubMed
- 20. Buysse DJ, Reynolds CF 3rd, Monk TH, Berman SR, Kupfer DJ. The Pittsburgh Sleep Quality Index: a new instrument for psychiatric practice and research. Psychiatry Res 1989;28(2):193-213ArticlePubMed
- 21. Choi H, Kim S, Kim B, Kim I. Psychometric properties of the Korean versions of three sleep evaluation questionnaires. Clin Nurs Res 2015;24(5):526-538ArticlePubMed
- 22. Lee SY, Ju YJ, Lee JE, Kim YT, Hong SC, Choi YJ, et al. Factors associated with poor sleep quality in the Korean general population: providing information from the Korean version of the Pittsburgh Sleep Quality Index. J Affect Disord 2020;271: 49-58ArticlePubMed
- 23. Kroenke K, Spitzer RL, Williams JB. The PHQ-9: validity of a brief depression severity measure. J Gen Intern Med 2001;16(9):606-613ArticlePubMedPMC
- 24. Chang AK, Choi J. Predictors of sleep quality among young adults in Korea: gender differences. Issues Ment Health Nurs 2016;37(12):918-928ArticlePubMed
- 25. Habibi F, Mahdavi SB, Khaniabadi BM, Habibi ME, Gharavinia A, Baghaei A, et al. Sleep quality and associated factors in Iranian inflammatory bowel disease patients. J Res Med Sci 2019;24: 59ArticlePubMedPMC
- 26. 2020 Alzheimer’s disease facts and figures. Alzheimers Dement 2020;16(3):391-460ArticlePDF
- 27. Schoenmakers B, Buntinx F, DeLepeleire J. Supporting the dementia family caregiver: the effect of home care intervention on general well-being. Aging Ment Health 2010;14(1):44-56ArticlePubMed
- 28. Xie B, Champion JD, Kwak J, Fleischmann KR. Mobile health, information preferences, and surrogate decision-making preferences of family caregivers of people with dementia in rural hispanic communities: cross-sectional questionnaire study. J Med Internet Res 2018;20(12):e11682ArticlePubMedPMC
- 29. Gessert CE, Forbes S, Bern-Klug M. Planning end-of-life care for patients with dementia: roles of families and health professionals. Omega (Westport) 2000;42(4):273-291ArticlePubMed
- 30. Peng HL, Lorenz RA, Chang YP. Factors associated with sleep in family caregivers of individuals with dementia. Perspect Psychiatr Care 2019;55(1):95-102ArticlePubMed
- 31. Jang SI, Bae HC, Shin J, Jang SY, Hong S, Han KT, et al. Depression in the family of patients with dementia in Korea. Am J Alzheimers Dis Other Demen 2016;31(6):481-491ArticlePubMedPMC
- 32. Kitamura T, Tanimoto C, Oe S, Kitamura M, Hino S. Familial caregivers’ experiences with home-visit nursing for persons with dementia who live alone. Psychogeriatrics 2019;19(1):3-9ArticlePubMed
- 33. Gonyea JG, Paris R, de Saxe Zerden L. Adult daughters and aging mothers: the role of guilt in the experience of caregiver burden. Aging Ment Health 2008;12(5):559-567ArticlePubMed
- 34. Roach L, Laidlaw K, Gillanders D, Quinn K. Validation of the Caregiver Guilt Questionnaire (CGQ) in a sample of British dementia caregivers. Int Psychogeriatr 2013;25(12):2001-2010ArticlePubMed
- 35. Wilson SJ, Padin AC, Birmingham DJ, Malarkey WB, Kiecolt-Glaser JK. When distress becomes somatic: dementia family caregivers’ distress and genetic vulnerability to pain and sleep problems. Gerontologist 2019;59(5):e451-e460ArticlePubMed
- 36. Seiger Cronfalk B, Ternestedt BM, Norberg A. Being a close family member of a person with dementia living in a nursing home. J Clin Nurs 2017;26(21-22):3519-3528ArticlePubMed
- 37. Andrén S, Elmståhl S. The relationship between caregiver burden, caregivers’ perceived health and their sense of coherence in caring for elders with dementia. J Clin Nurs 2008;17(6):790-799ArticlePubMed
- 38. Riedijk SR, De Vugt ME, Duivenvoorden HJ, Niermeijer MF, Van Swieten JC, Verhey FR, et al. Caregiver burden, health-related quality of life and coping in dementia caregivers: a comparison of frontotemporal dementia and Alzheimer’s disease. Dement Geriatr Cogn Disord 2006;22(5-6):405-412ArticlePubMed
- 39. Wang L, Qin P, Zhao Y, Duan S, Zhang Q, Liu Y, et al. Prevalence and risk factors of poor sleep quality among Inner Mongolia Medical University students: a cross-sectional survey. Psychiatry Res 2016;244: 243-248ArticlePubMed
- 40. Harpe SE. How to analyze Likert and other rating scale data. Curr Pharm Teach Learn 2015;7(6):836-850Article
REFERENCES
Figure & Data
References
Citations
- Factors related to cognitive performance among black caregivers of persons living with a chronic illness: An exploratory study
Glenna Brewster, Irene Yang, Jordan Pelkmans, Melinda Higgins, Drenna Waldrop, Sandra B. Dunbar, Katherine A. Yeager
Geriatric Nursing.2024; 59: 159. CrossRef - Association Between Sleep Quality and Anxiety in Korean Adolescents
Hyunkyu Kim, Seung Hoon Kim, Sung-In Jang, Eun-Cheol Park
Journal of Preventive Medicine and Public Health.2022; 55(2): 173. CrossRef - Association of compliance with COVID-19 public health measures with depression
Ju An Byun, Tae Jun Sim, Tae Yoon Lim, Sung-In Jang, Seung Hoon Kim
Scientific Reports.2022;[Epub] CrossRef
 PubReader
 ePub Link
 Cite
Cite- Figure
-

- Related articles
-
- Association Between Objective Social Isolation and Unmet Medical Needs: A Nationwide Cross-sectional Study in Korea
- Impact of Physical Activity on the Association Between Unhealthy Adolescent Behaviors and Anxiety Among Korean Adolescents: A Cross-sectional Study
- Association Between Sleep Quality and Anxiety in Korean Adolescents

