
Articles
- Page Path
- HOME > J Prev Med Public Health > Volume 47(3); 2014 > Article
-
Original Article
The Effect of Sleep Duration on the Risk of Unintentional Injury in Korean Adults - Yeon-Yong Kim1, Un-Na Kim1, Jin-Seok Lee1,2, Jong-Heon Park2
-
Journal of Preventive Medicine and Public Health 2014;47(3):150-157.
DOI: https://doi.org/10.3961/jpmph.2014.47.3.150
Published online: May 30, 2014
1Department of Health Policy and Management, Seoul National University College of Medicine, Seoul, Korea.
2Institute of Health Policy and Management, Medical Research Center, Seoul National University, Seoul, Korea.
- Corresponding author: Jong-Heon Park, MD, PhD. 311 Dongmak-ro, Mapo-gu, Seoul 121-749, Korea. Tel: +82-2-3270-9699, Fax: +82-2-3275-8024, parkjh@nhis.or.kr
• Received: October 16, 2013 • Accepted: April 25, 2014
Copyright © 2014 The Korean Society for Preventive Medicine
This is an Open Access article distributed under the terms of the Creative Commons Attribution Non-Commercial License (http://creativecommons.org/licenses/by-nc/3.0/) which permits unrestricted non-commercial use, distribution, and reproduction in any medium, provided the original work is properly cited.
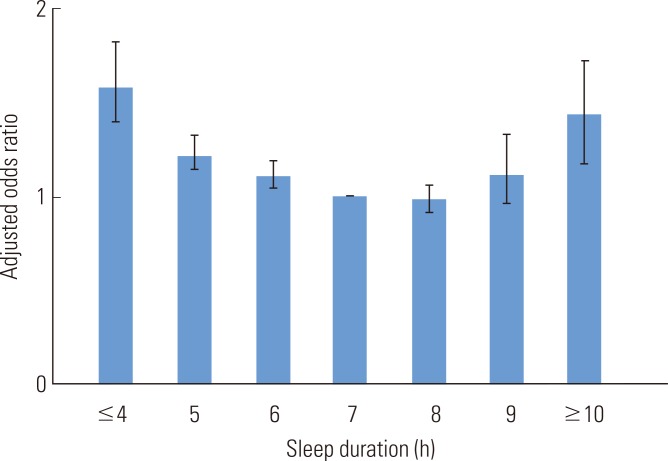
Figure & Data
References
Citations
Citations to this article as recorded by 
- Musculoskeletal injuries in UK Service Personnel and the impact of in-theatre rehabilitation during Cold Weather Warfare training: Exercise CETUS 2020
David H Ferraby, D Hayhurst, R Strachan, H Knapman, S Wood, J L Fallowfield
BMJ Military Health.2023; 169(6): 517. CrossRef - Prevalence and behavioural associations of unintentional injuries among Chinese college students: a 50-University population-based study
Dan Wu, Tingzhong Yang, Randall R Cottrell, Huan Zhou, Xueying Feng
Injury Prevention.2019; 25(1): 52. CrossRef - Association of physical activity, sedentary time, and sleep duration on the health-related quality of life of college students in Northeast China
Yinjian Ge, Shimeng Xin, Dechun Luan, Zhili Zou, Mengting Liu, Xue Bai, Qian Gao
Health and Quality of Life Outcomes.2019;[Epub] CrossRef - Risk factors for unintentional injuries among the rural elderly: a county-based cross-sectional survey
Hongping Zhang, Feng Wei, Mo Han, Jianquan Chen, Songxu Peng, Yukai Du
Scientific Reports.2017;[Epub] CrossRef - Unintentional Injuries among Psychiatric Outpatients with Major Depressive Disorder
Ching-I Hung, Chia-Yih Liu, Ching-Hui Yang, Yinglin Xia
PLOS ONE.2016; 11(12): e0168202. CrossRef - The Effect of Sleep Duration and Relief of Fatigue after Sleep on the Risk of Injury at School among Korean Adolescents
Jungok Yu, Jungsoon Kim
Journal of Korean Academy of Community Health Nursing.2015; 26(2): 100. CrossRef
 PubReader
 ePub Link
 Cite
Cite

