
Articles
- Page Path
- HOME > J Prev Med Public Health > Volume 55(1); 2022 > Article
-
Systematic Review
Low Social Support and Risk for Depression in People With Type 2 Diabetes Mellitus: A Systematic Review and Meta-analysis -
Akhmad Azmiardi1,2
 , Bhisma Murti1, Ratih Puspita Febrinasari3, Didik Gunawan Tamtomo1
 -
Journal of Preventive Medicine and Public Health 2022;55(1):37-48.
DOI: https://doi.org/10.3961/jpmph.21.490
Published online: January 10, 2022
1Doctoral Program on Public Health, Universitas Sebelas Maret, Surakarta, Indonesia
2Department of Public Health, Universitas Veteran Bangun Nusantara, Sukoharjo, Indonesia
3Department of Pharmacology, Faculty of Medicine, Universitas Sebelas Maret, Surakarta, Indonesia
- Corresponding author: Akhmad Azmiardi, Doctoral Program on Public Health, Universitas Sebelas Maret, 36 Ir. Sutami Street, Surakarta 57126, Indonesia E-mail: aazmiardi@gmail.com
• Received: September 12, 2021 • Accepted: October 31, 2021
Copyright © 2022 The Korean Society for Preventive Medicine
This is an Open Access article distributed under the terms of the Creative Commons Attribution Non-Commercial License (http://creativecommons.org/licenses/by-nc/4.0/) which permits unrestricted non-commercial use, distribution, and reproduction in any medium, provided the original work is properly cited.
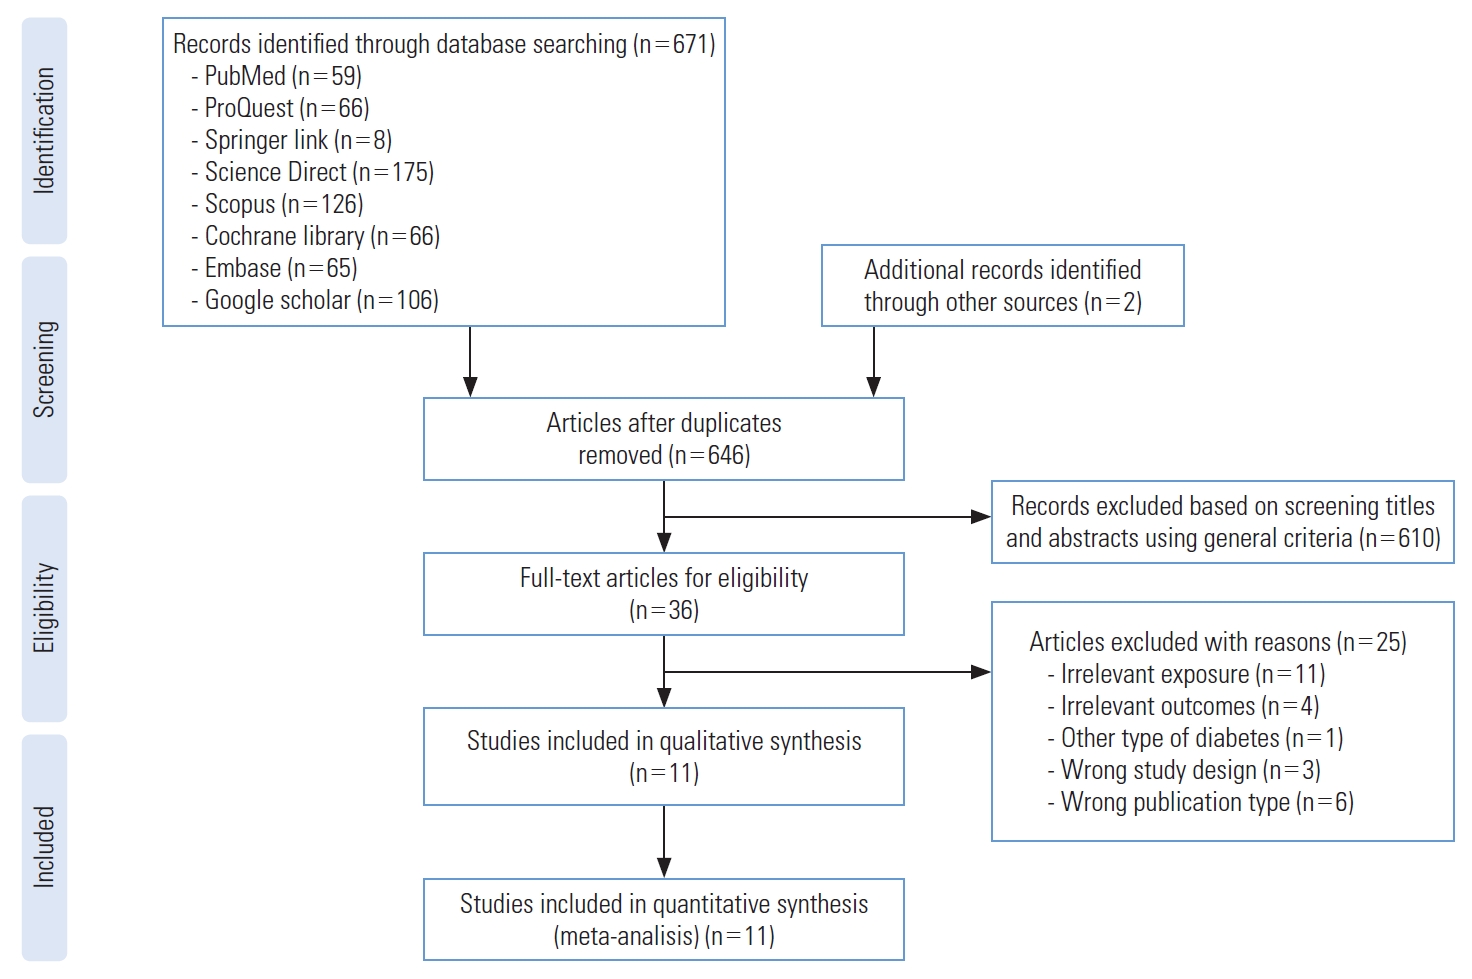


Figure & Data
References
Citations
Citations to this article as recorded by 
- Staying connected: An umbrella review of meta-analyses on the push-and-pull of social connection in depression
Luisa De Risio, Mauro Pettorruso, Rebecca Collevecchio, Barbara Collacchi, Marta Boffa, Mario Santorelli, Massimo Clerici, Giovanni Martinotti, Francesca Zoratto, Marta Borgi
Journal of Affective Disorders.2024; 345: 358. CrossRef - The risk factors for mental health disorders in patients with type 2 diabetes: An umbrella review of systematic reviews with and without meta-analysis
Amani Busili, Kanta Kumar, Laura Kudrna, Idris Busaily
Heliyon.2024; 10(7): e28782. CrossRef - Distress and Coping Strategy among Indonesian Men with Type-2 Diabetes Mellitus
Fajar Ari Nugroho, Rico Budhiarta Chandra, Nike Laila, Sera Rukia, Inggita Kusumastuty, Anggun Rindang Cempaka, Lola Ayu Istifiani, Atifa Nafia Hasantie Latif
Nurse Media Journal of Nursing.2024;[Epub] CrossRef - Effectiveness of social support-based interventions in preventing depression in people without clinical depression: A systematic review and meta-analysis of randomized controlled trials
Henar Campos-Paíno, Patricia Moreno-Peral, Irene Gómez-Gómez, Sonia Conejo-Cerón, Santiago Galán, Sara Reyes-Martín, Juan Ángel Bellón
International Journal of Social Psychiatry.2023; 69(2): 253. CrossRef - Individuelle Behandlung bei Glaukompatienten mit einem Diabetes mellitus
Jan Luebke
Klinische Monatsblätter für Augenheilkunde.2023; 240(02): 142. CrossRef - Prevalence of comorbid depression and associated factors among hospitalized patients with type 2 diabetes mellitus in Hunan, China
Rehanguli Maimaitituerxun, Wenhang Chen, Jingsha Xiang, Atipatsa C. Kaminga, Xin Yin Wu, Letao Chen, Jianzhou Yang, Aizhong Liu, Wenjie Dai
BMC Psychiatry.2023;[Epub] CrossRef - The prevalence and predictors of depression and disability in older adults and elderly patients with Diabetes in India: Cross-sectional analysis from the Longitudinal Study on Ageing
Baani Sodhi, Mansi Malik, Paras Agarwal, Saurav Basu
Diabetes & Metabolic Syndrome: Clinical Research & Reviews.2023; 17(4): 102765. CrossRef - Depression and determinants among diabetes mellitus patients in Ethiopia, a systematic review and meta-analysis
Kirubel Dagnaw Tegegne, Natnael Atnafu Gebeyehu, Mesfin Wudu Kassaw
BMC Psychiatry.2023;[Epub] CrossRef - Individuelle Behandlung bei Glaukompatienten mit einem Diabetes mellitus
Jan Lübke
Diabetes aktuell.2023; 21(02): 68. CrossRef - Diabetes and Mental Health
David J. Robinson, Kimberley Hanson, Akshay B. Jain, Jessica C. Kichler, Gaurav Mehta, Osnat C. Melamed, Michael Vallis, Harpreet S. Bajaj, Tracy Barnes, Jeremy Gilbert, Kristin Honshorst, Robyn Houlden, James Kim, Joanne Lewis, Barbara MacDonald, Dylan M
Canadian Journal of Diabetes.2023; 47(4): 308. CrossRef - The association between screen time and depression symptoms severity among adults with diabetes: A cross-sectional study
Layan Sukik, Bushra Hoque, Linda Boutefnouchet, Mohamed Elhadary, Hiba Bawadi, Mujahed Shraim
Primary Care Diabetes.2023; 17(6): 619. CrossRef
 PubReader
 ePub Link
 Cite
Cite


