
Articles
- Page Path
- HOME > J Prev Med Public Health > Volume 55(1); 2022 > Article
-
Original Article
A Regionalization Model to Increase Equity of Access to Maternal and Neonatal Care Services in Iran -
Zahra Mohammadi Daniali1
 , Mohammad Mehdi Sepehri2, Farzad Movahedi Sobhani1, Mohammad Heidarzadeh3
 -
Journal of Preventive Medicine and Public Health 2022;55(1):49-59.
DOI: https://doi.org/10.3961/jpmph.21.401
Published online: December 28, 2021
1Department of Industrial Engineering, Science and Research Branch, Islamic Azad University, Tehran, Iran
2Department of Healthcare Systems Engineering, Faculty of Industrial and Systems Engineering, Tarbiat Modares University, Tehran, Iran
3Department of Pediatrics, Tabriz University of Medical Science, Tabriz, Iran
- Corresponding author: Mohammad Mehdi Sepehri, Department of Healthcare Systems Engineering, Faculty of Industrial and Systems Engineering, Tarbiat Modares University, Jalal Al-e-Ahmad Highway, Tehran 1411713116, Iran E-mail: mehdi.sepehri@modares.ac.ir
Copyright © 2022 The Korean Society for Preventive Medicine
This is an Open Access article distributed under the terms of the Creative Commons Attribution Non-Commercial License (http://creativecommons.org/licenses/by-nc/4.0/) which permits unrestricted non-commercial use, distribution, and reproduction in any medium, provided the original work is properly cited.
ABSTRACT
-
Objectives
- Access to maternal and neonatal care services (MNCS) is an important goal of health policy in developing countries. In this study, we proposed a 3-level hierarchical location-allocation model to maximize the coverage of MNCS providers in Iran.
-
Methods
- First, the necessary criteria for designing an MNCS network were explored. Birth data, including gestational age and birth weight, were collected from the data bank of the Iranian Maternal and Neonatal Network national registry based on 3 service levels (I, II, and III). Vehicular travel times between the points of demand and MNCS providers were considered. Alternative MNCS were mapped in some cities to reduce access difficulties.
-
Results
- It was found that 130, 121, and 86 MNCS providers were needed to respond to level I, II, and III demands, respectively, in 373 cities. Service level III was not available in 39 cities within the determined travel time, which led to an increased average travel time of 173 minutes to the nearest MNCS provider.
-
Conclusions
- This study revealed inequalities in the distribution of MNCS providers. Management of the distribution of MNCS providers can be used to enhance spatial access to health services and reduce the risk of neonatal mortality and morbidity. This method may provide a sustainable healthcare solution at the policy and decision-making level for regional, or even universal, healthcare networks.
- The mortality rate among children under 5 years of age is one of the most significant indicators of a country’s national welfare [1]. According to statistics released by the World Health Organization, approximately 4 million of the 130 million infants born each year globally die within the first 28 days of life [2]. Unequal access and inaccessibility to basic maternal healthcare services have been identified as primary causes of global mortality [3].
- Accessibility is an estimation of the ease of access and quantity of facilities available to the public in any given area [4]. The effects of accessibility and travel time on healthcare outcomes have been investigated for prenatal centers [5-7], trauma centers [8], vaccine centers [9], human immunodeficiency virus centers [10], and cardiovascular centers [11].
- A very effective method for reducing the neonatal mortality rate is to increase equity in the public’s access to health services via regionalization, which was originally introduced in 1976 by 4 academic associations in the United States [12]. In regional healthcare planning, all the large and small hospitals in a region have a collaborative relationship in order to improve the quality of health services within a region [13]. The advantages of service regionalization are as follows: better healthcare due to easy access to experts, more in-depth training and opportunities for acceleration, cost savings, reduced potential risks to local healthcare systems, and increased equity in public access to health services [14-18].
- Providing quality care at the time of an infant’s delivery requires skilled medical personnel and specialized devices at various levels. The American Academy of Pediatrics and the American College of Obstetricians and Gynecologists identified 3 levels of maternal and neonatal care services (MNCS). Level I refers to uncomplicated obstetric and nursery care, level II refers to limited complicated care, and level III refers to the full complement of care [19]. For MNCS providers, comprehensive, or level III, services require intensive resources, and, as a result, not many hospitals can afford to provide such care in any given region. Adequate levels of service and well-equipped nurseries are needed by these centers in terms of neonatology, fetal-maternal medicine, pediatric subspecialties, and anesthesiology [19].
- Hierarchical facilities refer to facilities that function in the context of a multi-level system or facilities of varying levels that provide diverse services in collaboration with one another [20]. Education, emergency, healthcare, logistics, and firefighting facilities are among the facilities that can be categorized as hierarchical facilities [21]. As general hierarchical facilities, healthcare facilities have been broadly examined in the field of spatial accessibility. The development of well-organized hierarchical systems for healthcare facilities has been a goal for local/federal governments in many nations in recent years [22].
- The Iranian healthcare system is divided into 3 hierarchical levels, each with a specific set of leadership and governance responsibilities. The Supreme Council for Health and Food Security is responsible for fostering cross-sector cooperation and health-related decision-making. Designing healthcare packages is mainly the responsibility of the Supreme Council for Health Insurance. The Ministry of Health and Medical Education (MoHME) regulates the health system and makes decisions on public health, curative affairs, medical research, education, food, and drugs. It provides healthcare services to the whole population via 67 medical universities across 31 regions in Iran. Public, private, and non-profit organizations provide accessible healthcare services to Iran’s population. The public sector owns 80% of all hospital beds, and regional health networks oversee the operation of public hospitals. Medical centers and homes concentrating on public health and primary healthcare services are found at the third level and act as intermediaries for referrals to secondary and tertiary care [23]. The primary healthcare system in Iran has undergone steady structural improvements since 1984, which have led to dramatic decreases in infant, maternal, and neonatal mortality rates [24]. As a result, the neonatal mortality rate dropped from 31.2 deaths per 1000 live births in 1984 to 8.9 deaths in 2018 [25]. According to some studies, however, there is not yet an equal distribution of healthcare facilities in Iran [26-28].
- One of the essential data banks for tracking maternal and neonatal health is the Iranian Maternal and Neonatal Network (IMaN). The IMaN collects nearly all maternal and infant health data related to childbirth throughout the nation. Since 2014, the IMaN has tracked births that take place outside of hospitals, such as birthing centers, women’s homes, and other locations. Information on the demographic characteristics of mothers of newborns, relationships, gestational ages, the medical records of mothers, and birth characteristics of infants are recorded in the IMaN data bank [28].
- Regions with poor accessibility must be identified, and inequity of access should be examined in order to effectively plan health services. As a result of advanced data regarding the locations of facilities and enhanced technologies used to visualize such information in relation to the population via techniques such as geographical information systems (GIS), it has become easier to identify underserved regions with poor accessibility. In this study, GIS was used to investigate the inequity of access and spatial inaccessibility to MNCS providers in Iran. While this study drew upon past research in Iran [29], the present study differs from previous research in the following ways. The criteria for healthcare service distribution were examined by a panel of experts in order to develop a hierarchical optimization model to identify the quantity and spatial distribution of MNCS providers across 3 service levels. The model proposed in this study may be an effective solution for reducing inequity of healthcare access at both the policy and decision-making levels.
INTRODUCTION
- Review
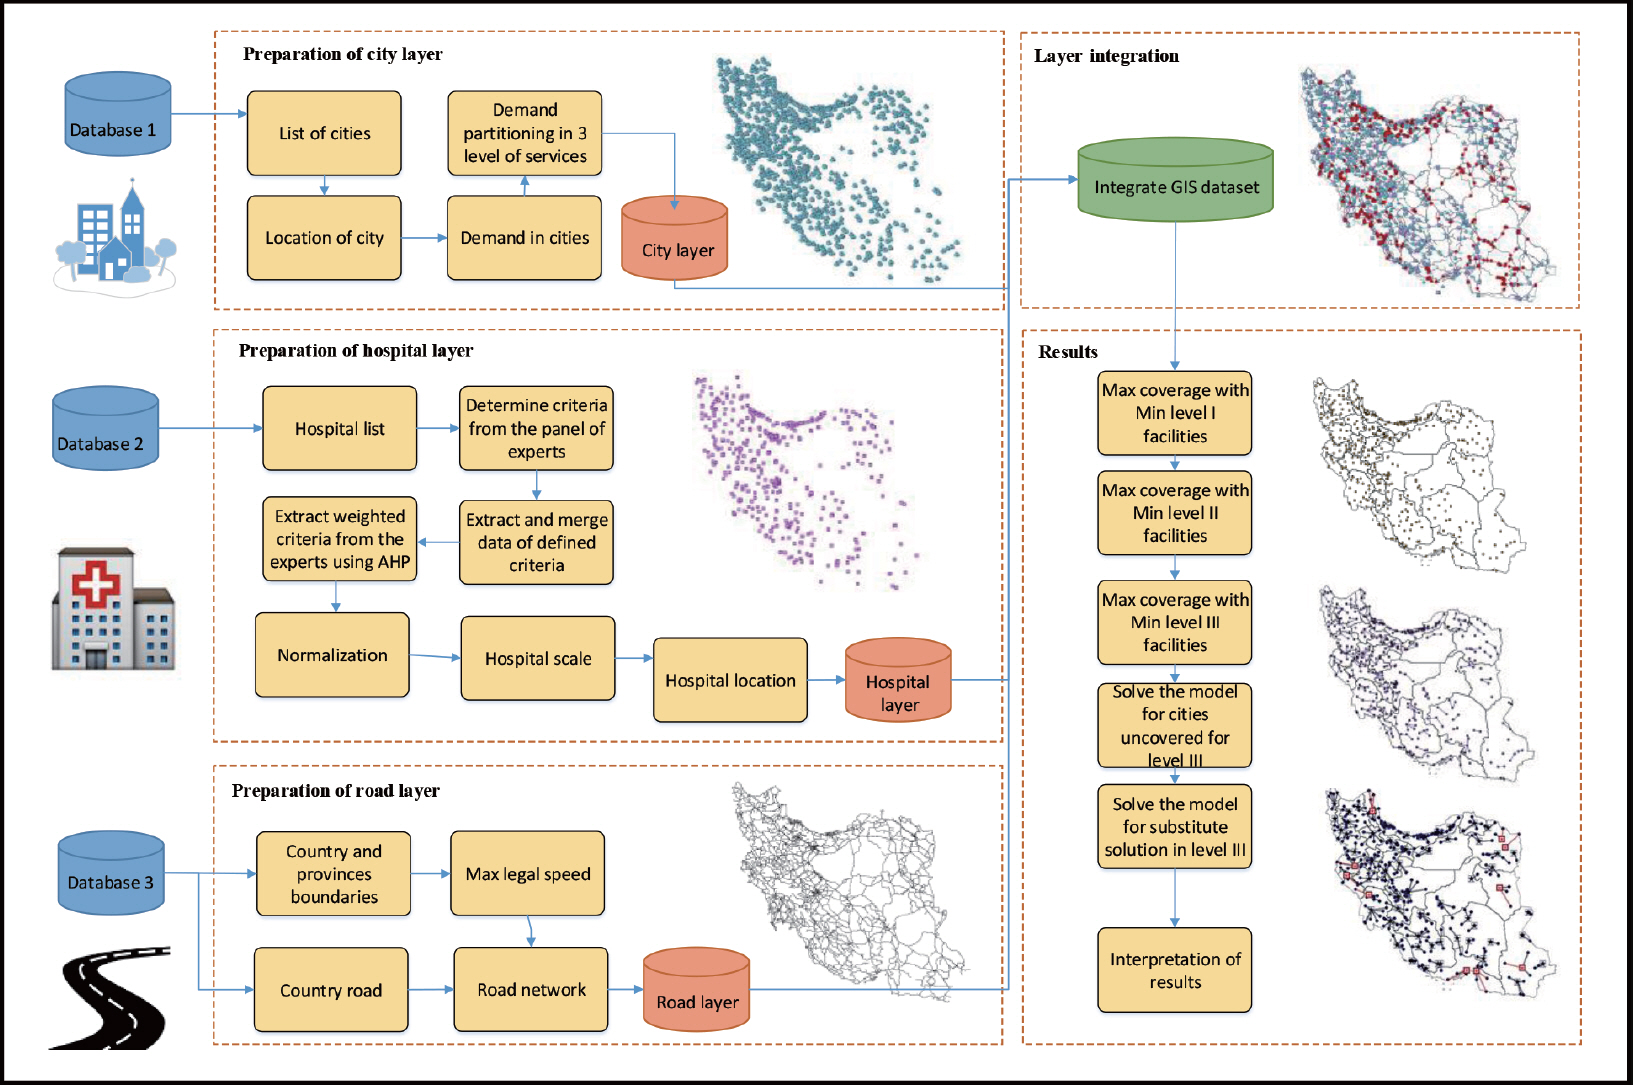
- With a population of approximately 82 million people and an area of 1 658 195 km2, Iran is the 18th most populous and 17th largest country in the world [1]. The present study aimed to determine the optimal spatial distribution of MNCS providers for the population of Iran. To better understand and address the situation, interviews were held with a panel of experts in order to identify and examine this real-life problem. The data required to conduct this study were extracted from different data banks. The data were then cleaned in order to collect only the relevant data on public demand for MNCS, MNCS facilities, and MNCS networks. Data on catchment areas, criteria, and criterion weights were extracted under the supervision of policymakers at a neonatal health office of the MoHME. The various data were then integrated, and a model was eventually created using GIS software. Figure 1 shows the in-sequence research methodology that was used in this study.
- Data
- There were 3 categories of newborn infants used in this study. Those above 34 weeks or 2000 g were considered late preterm, those between 32 weeks and 34 weeks or 1500-2000 g were considered moderately preterm, and those below 32 weeks or 1500 g were considered early preterm. Iran has 3 levels of MNCS. Level I refers to prenatal care to assess mothers’ and infants’ medical status and transfer late preterm infants to a higher level of care if needed. Level II provides care for moderately preterm infants who require treatment but are likely to recover fully. Level III provides care for early preterm or severely ill newborns wh need special care. Thus, assistance programs should be developed to meet the needs of those receiving each level of care. Early preterm neonates still have a significant risk of death [22].
- According to the IMaN data bank, 19 065 very preterm, 50 862 moderately preterm, and 245 056 late preterm neonates were hospitalized from March 2018 to March 2019. After examining hospitalization data, it was found that mothers often moved between cities to give birth. In order to develop an optimized regional model, the permanent residences of mothers should be considered instead of just the cities in which they gave birth as a factor affecting the potential demand for MNCS in each city. The demand for MNCS in each city was therefore extracted from the IMaN registry based on the 3 service levels and areas of residence of mothers.
- As of the time of this study, there were 1017 hospitals in Iran [23]. In order to accurately identify the most suitable hospital for each service level, the parameters that affected each level of care had to be determined. Thus, interviews were held with policymakers at a neonatal health office of the MoHME. The parameters identified for determining the suitability of level I and level II service providers were the demand for MNCS in each city and the radius of coverage. However, the suitability of level III service providers was additionally influenced by the following criteria:
- (1) Equipment: The 2 most essential pieces of equipment affecting mortality among neonates were identified as the number of ventilators and the number of neonatal intensive care unit (NICU) beds available. (2) Expert team: The number of neonatal experts and neonatal fellows employed at an institution providing MNCS was found to directly affect neonatal mortality. And (3) University type: There are 3 different classifications of university hospitals in Iran according to their management rankings as influenced by the scientific status of the university faculty and students. A hospital’s assigned rank directly correlates to the neonatal mortality rate. According to the most recent rankings, 4 hospitals, 6 hospitals, and 20 hospitals were categorized as types 1, 2, and 3, respectively. (4) Gravity: Based on an analysis released by the IMaN data bank, some mothers-to-be preferred to deliver their babies outside of their areas of residence. In this study, this phenomenon was referred to as “city gravity,” which is affected by various factors such as ethnicity, a preference for delivery in a large city, and a perception of certain centers providing better services. The following equation was used to determine a city’s gravity:
- The factors influencing the provision of level III services are shown in Supplemental Material 1.
- There are various decision-making tools and techniques for supporting the decision-making process in medical and healthcare contexts. The analytic hierarchy process (AHP) first proposed in a study by Saaty [30] is a decision-making technique for determining the priority levels of various alternatives when several criteria are available to be considered. When using this technique, the decisionmaker structures his or her problems as a series of integrated, hierarchical levels that include the criteria, the alternatives, and the goal. The primary benefit of the AHP is its use of pair-wise comparisons so that a ratio scale can be acquired and measured, which is a natural mechanism for comparing alternatives that allows one to measure both intangible and tangible factors [31]. In this study, a variation of the AHP method using a 9-point Likert scale was employed to quantify the weight of each hospital-related criterion. Using this method, the expert panelists (Supplemental Material 2) were asked to share their opinions about the importance of each criterion relative to another. The final weights of the factors were extracted using Expert Choice (Expert Choice, Inc., Arlington, VA, USA). The weights for university type, equipment, experts, and city gravity were 14%, 13%, 48%, and 25%, respectively.
- Saaty [30] proposed that a consistency index can be used by comparing it with another appropriate consistency index. If the value of the consistency ratio is less than or equal to 10%, the inconsistency is acceptable. If the consistency ratio is greater than 10%, the subjective judgments must be revised. In this paper, the calculated consistency ratio was 4%. Thus, the judgment of the experts could be trusted. The 3 types of universities also received scores of 30 points, 70 points, and 100 points. Cities without any university-based medical service providers scored 0 points. Finally, the score for each facility was obtained from the cumulative sum of the normalized values of each criterion multiplied by the assigned weight.
- To assess the reliability of the assigned weights, 12 different scenarios are defined (Supplemental Material 3). In each scenario, the weight of each criterion was increased by 10%, 20%, and 30%. The model was tested to determine the optimal number of MNCS providers in the second largest province of Iran, Sistan and Baluchestan, with different weight values. The results revealed that the number of MNCS providers did not change despite the different scenarios. Therefore, the model was found to be reliable up to a 30% change in the weights of the variables.
- Another critical factor examined in this study was the spatial distance between mothers’ residences and chosen MNCS providers. An initial examination of the data revealed that there were 7 different types of roads in a large country like Iran. Since travel time varies according to the road type, distance had to be translated into travel time to reflect the reality of travel time. For this reason, the maximum speed limits for the 92.604 road records were extracted from the databank of the Ministry of Roads and Urban Development, and distances were converted into travel times using the following equation:
- TTij is the travel time from city z to city k, D is the matrix of between cities road distances, S is the matrix of maximum speed limits of roads, and xij is a binary variable that is equal to 1 if the pregnant women need to use road to ij travel from city z to k in optimal solution or 0 if otherwise.
- The catchment area refers to the distance between a city and the nearest selected facility. According to the policymakers interviewed for this study, at least 1 level I, II, and III MNCS provider should be located 30 minutes, 60 minutes, and 120 minutes, respectively, from an expectant mother.
- The different layers of data on country borders, provinces, cities, hospitals, and road networks were integrated into the GIS software (Supplemental Material 4).
- The maximal covering location problem (MCLP) first presented in a study by Church and ReVelle [32] refers to the maximum servable population within a certain service time or distance for accessing a restricted quantity of facilities. For specific sets of facilities and demand locations, the MCLP requires the optimum location to maximize the weighted coverage objective function [33].
- In nested or successively inclusive hierarchical maximal covering models, each level of service can provide services of the lower levels as well [34]. Objective minimization was performed to determine the minimum number of facilities required to respond to maximum demand in a predetermined catchment area.
- The MCLP model used in this study in the first hierarchy of the model [27] is shown in Supplemental Material 5. The candidate inputs for the first hierarchy of service were as follows: all hospitals were the candidate facilities, all cities with late preterm neonates were the demand inputs, and 30 minutes was the catchment area. The MCLP was applied for the first level, and the outputs of this hierarchy were the set of MNCS providers with level I services and the cities allocated to these MNCS providers. The output of the first hierarchy was used as the input for candidate MNCS providers in the following hierarchy. The demand was moderately preterm neonates and the catchment area was considered 60 minutes. Like the first hierarchy, the outputs of the second hierarchy were the sets of MNCS providers with level II services and the cities allocated to these MNCS providers. The selected MNCS providers were used as the input for the third hierarchy. The factors shown in Supplemental Material 1 and their weights were another input at this level. In this hierarchy, the areas of residence of early preterm neonates were used as the demand layer, and the catchment area was considered 120 minutes. The nested feature of the problem and the inputs/outputs of each level are depicted in Supplemental Material 6. The MCLP presented in this study can be used to determine the required number of MNCS providers for each level of service independently. To integrate the complicated road and speed networks used to determine travel times, a model builder toolbox was used in ArcGIS. In this model, the MCLP was repeated in each hierarchy. The model builder toolbox was used to develop a flexible model. This methodology is advantageous since policymakers can easily modify the parameters. Moreover, the model builder is user-friendly and does not require any special computational programming knowledge to use. Figure 2 depicts the toolbox flowchart prepared for selecting a location-allocation for a level III MNCS provider.
- Ethics Statement
- The use of the IMaN data bank was approved by the Iranian Ethics Committee (IR.MODARES.REC.1399.221). This study does not contain any individual person’s data.
METHODS
Demand data
Facility data
Weight of criteria
Road data and estimating travel time
Determining the catchment area
Data integration
Hierarchical location-allocation model for maternal and neonatal care services
- Once the necessary layers of data were integrated in the GIS software, several models were applied for the location-allocation of MNCS providers under different conditions.
- Solving the Maximal Coverage Model With the Minimum Number of Facilities for Service Levels I, II, and III
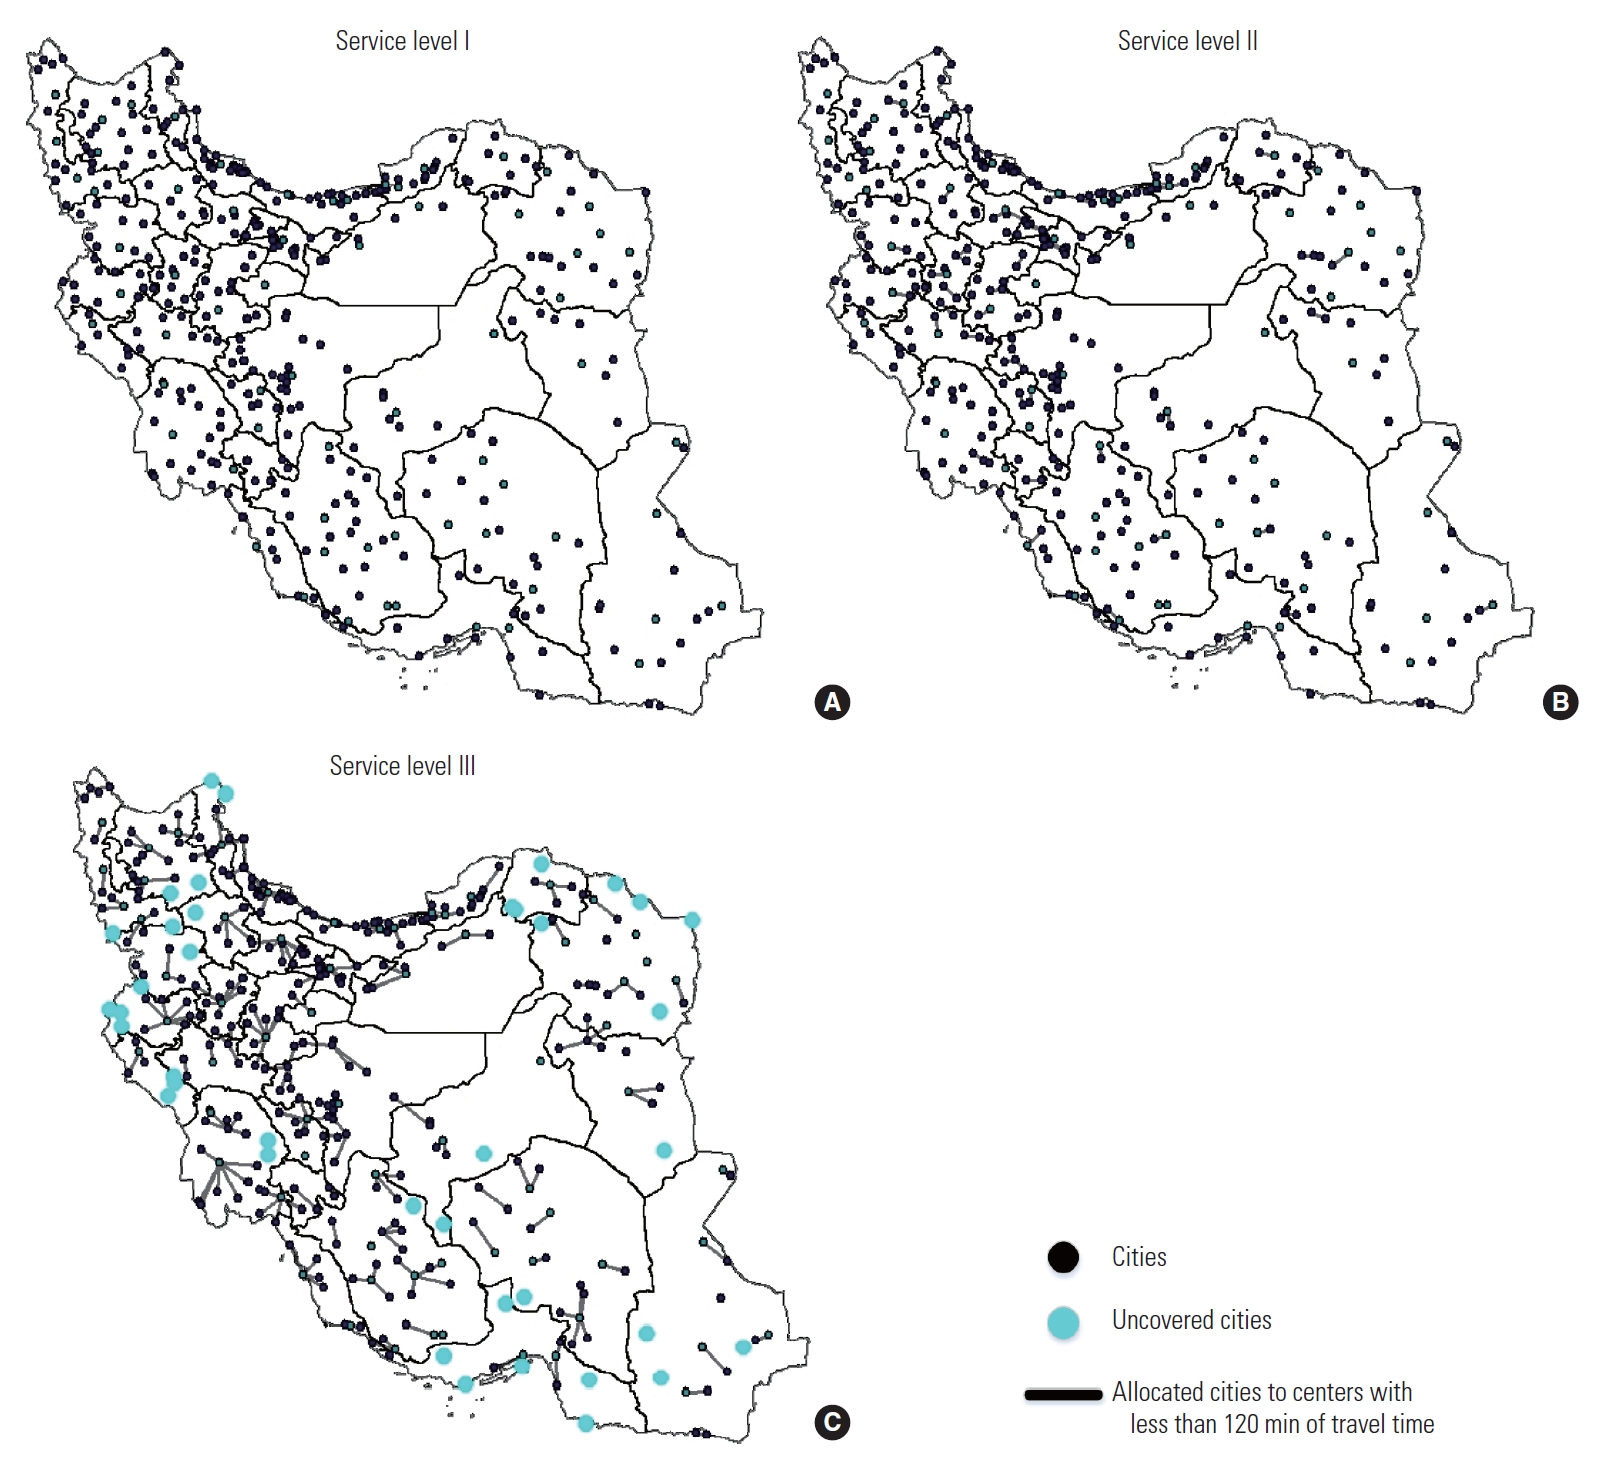
- The hierarchical maximal coverage model was created by minimizing the facility objective function to find the optimal location allocations of MNCS providers. The results are shown in the maps presented in Figure 3A-C. The results revealed that 130, 121, and 86 MNCS providers were needed to satisfy the demand for service levels I, II, and III at distances of 30 minutes, 60 minutes, and 120 minutes, respectively. According to these results, 96% of the demand for level III services could be covered within a 120-minute distance with 86 service centers. The 39 points highlighted on the map in Figure 3C represents cities that did not have an allocated level III MNCS provider. These cities are located at distances further than 120 minutes from the service demand points. Hence, the following new model was created to satisfy the demand for service among those who resided in these locations as well.
- Solving the Model for Cities Without Level III Service Coverage
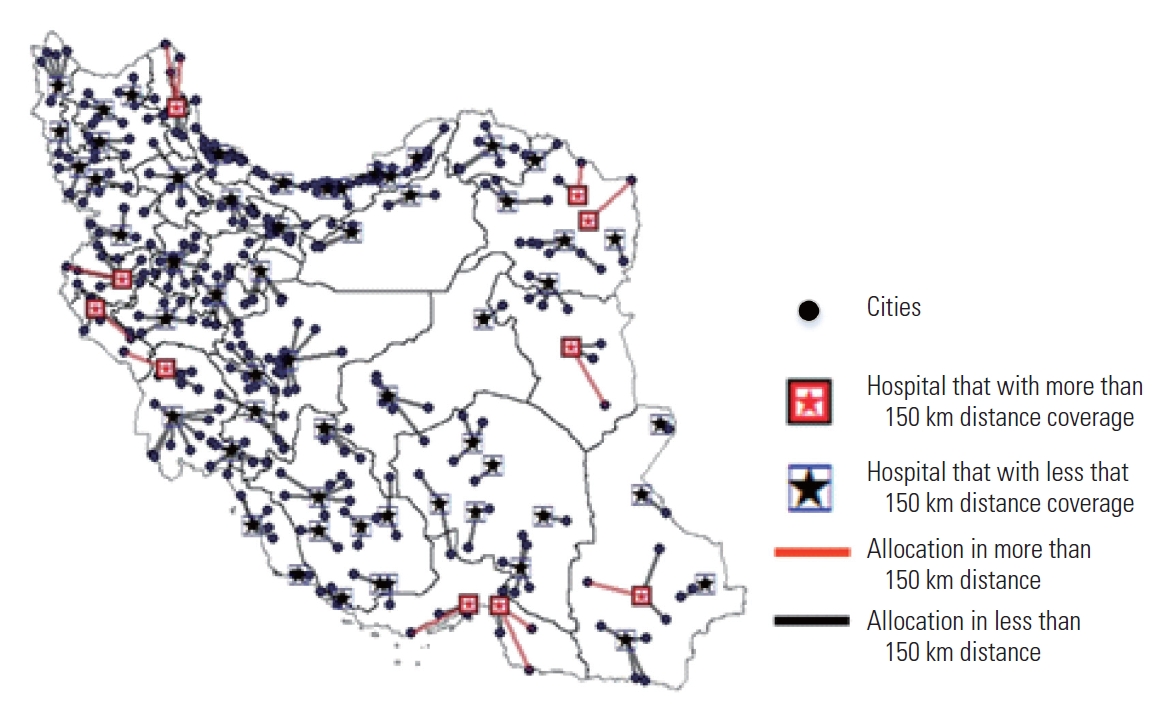
- In this model, 39 cities with 645 demands for level III services did not have facilities allocated for such services. The map in Figure 3C implies that most of the 39 cities were small border towns. A new maximal coverage model was created to satisfy these demands and find the optimal allocation of services to these towns without any catchment area constraints. The results are depicted in Figure 4. Based on the results, expectant mothers who live in these 39 cities have to travel for 173 minutes on average to reach the nearest facility.
- Solving the Maximal Coverage Model to Find Alternative Level III Maternal and Neonatal Care Services Providers
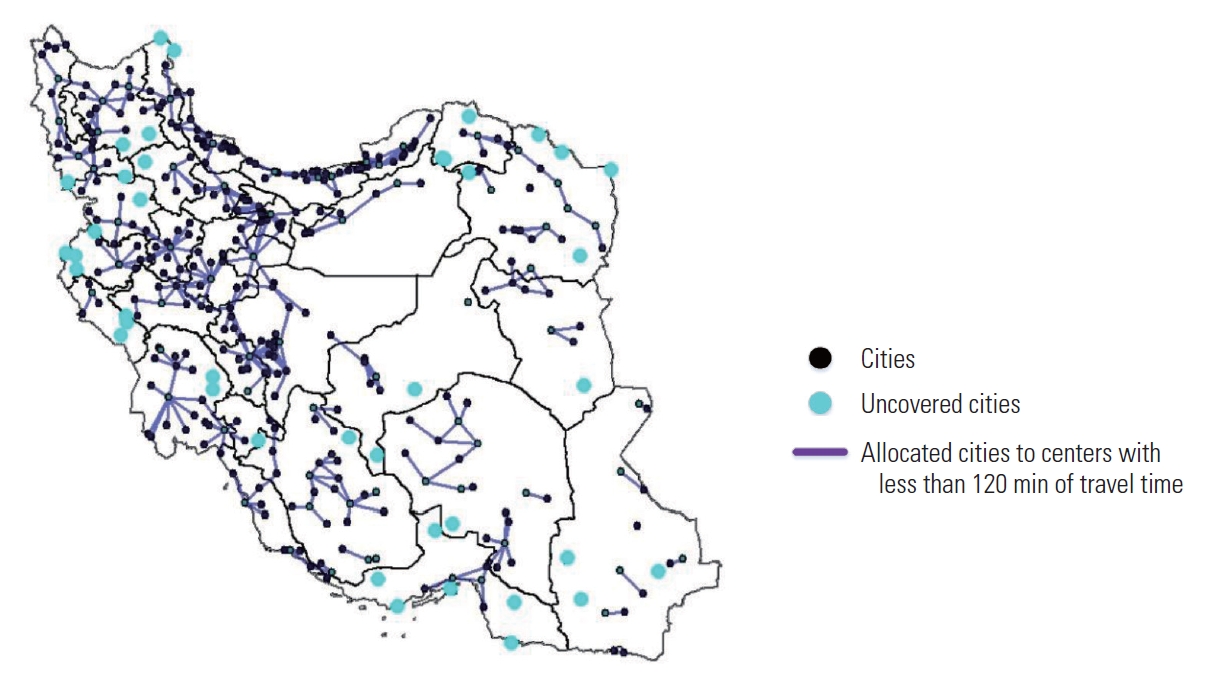
- To increase the reliability of the solution, the model developed herein was used to determine alternative level III service providers. The allocation of alternative centers is crucial for cities that are equidistant to 2 or more service centers. The results of applying this objective function are mapped in Figure 5. In this solution, alternative service providers were allocated to 140 cities.
RESULTS
- The objective of this study was to map the optimal spatial distribution of MNCS providers to increase equity in access to healthcare services. For this purpose, annual data on the weights and gestational ages of hospitalized neonates born in 373 different cities of Iran were collected. Next, data on hospitals that satisfied the essential criteria were gathered via expert interviews. In the following step, the characteristics of one state’s road networks were extracted. The data were then integrated, and a flexible model was generated using GIS software for identifying the necessary quantity of MNCS providers, the locations of MNCS providers, and MNCS referral networks at 3 different levels. The results revealed that the demand for level I, II, and III services would be satisfied by 130, 121, and 86 MNCS providers, respectively. However, a total of 39 cities remained located outside of the range for service level III. In order to ensure complete coverage, a new model was designed for these uncovered cities to identify the nearest MNCS providers. The selected centers are indicated by red stars in Figure 4. The average travel time for this solution was found to be 173 minutes. Based on these results, MNCS providers that serve cities at distances of more than 120 minutes need extra equipment to respond adequately to demand. Other potential solutions include mobile or helicopter transport system. Policymakers should take measures to supply routine care and education for pregnant women in these 39 cities.
- Since the model was designed and implemented in Iran, which ranks fifth among nations globally in terms of disaster risk, alternative allocations of MNCS providers were also considered. In this solution, more than 1 MNCS was allocated to 140 cities. These alternative solutions will not only increase the reliability of the model but also help policymakers to control patient queuing at MNCS providers.
- To validate the results, all the proposed results were presented for debate by a panel of experts. In addition, the results were compared against those reported in a study by Rashidian et al. [29].
- The strengths of this study include the use of various important criteria, the extraction and integration of annual data on the weights and gestational ages of neonates, the use of travel time instead of distance, analysis of the length of the actual journey from a place of residence to cities in which delivery takes place as the gravity criterion, the identification of the number and locations of MNCS providers across 3 levels of services via a hierarchical optimization model, and, finally, the implementation of alternative MNCS providers for level III services to enhance the reliability of the solution. An advantage of the proposed model in terms of macroeconomic policy in Iran is the expected reduction in the neonatal mortality rate as a result of the model in this study, particularly through increased equity in access and the additional reduction in the huge costs of extraneous NICUs, experts, and related medical equipment. Other studies have quantified the expected reduction in maternal mortality [8]. In this study, the mortality rate of neonates in a province of Iran was used as a basis for estimating mortality reduction nationally. By tracking the cities of residence of hospitalized neonates as well as the cities in which they were delivered, it was discovered that around 11% of neonates in this province who require level III services and do not survive are born outside of a 120-minute range to a level III MNCS provider. It is expected that, by optimizing MNCS networks, this rate will decrease. However, different regression analyses are recommended in the future in which to assess the most effective parameters and more precisely calculate the exact reduction in the rate.
- Future studies should conduct regression analysis to identify the association between neonatal outcomes and travel time to address the weaknesses of the present study. Moreover, more effective criteria can be identified using analytical research to examine literature and data.
- In future studies, the approach proposed in this study can be used as a comprehensive reference for other healthcare problems, such as determining the best locations for children’s heart or eye health centers in Iran. Moreover, traffic constraints may be introduced into the model as an extension of this study. Developing a web-based dynamic model sensitive to online road constraints might form another avenue for research. Finally, cost-revenue analysis for expensive installations such as mobile or helicopter transport system can be included in future research.
DISCUSSION
SUPPLEMENTAL MATERIALS
Supplemental Material 1.
Supplemental Material 2.
Supplemental Material 4.
Supplemental Material 6.
-
CONFLICT OF INTEREST
The authors have no conflicts of interest associated with the material presented in this paper.
-
FUNDING
None.
Notes
ACKNOWLEDGEMENTS
-
AUTHOR CONTRIBUTIONS
Conceptualization: Daniali ZM, Sepehri MM, Heidarzadeh M. Data curation: Daniali ZM, Sepehri MM, Heidarzadeh M. Formal analysis: Daniali ZM, Sepehri MM. Funding acquisition: None. Methodology: Daniali ZM, Sepehri MM, Sobhani FM, Heidarzadeh M. Project administration: Daniali ZM, Sepehri MM, Sobhani FM, Heidarzadeh M. Writing – original draft: Daniali ZM, Sepehri MM. Writing – review & editing: Daniali ZM, Sepehri MM, Sobhani FM, Heidarzadeh M.
Notes


- 1. Rahbar M, Ahmadi M, Lornejad H, Habibelahi A, Sanaei-Shoar T, Mesdeaghinia A. Mortality causes in children 1-59 months in Iran. Iran J Public Health 2013;42(Supple1):93-97PubMedPMC
- 2. World Health Organization. Country profile: health system profile, Islamic Republic of Iran. 2006 [cited 2021 Jul 1]. Available from: http://www.emro.who.int/human-resources-observatory/countries/country-profile.html
- 3. Campbell OM, Graham WJ; Lancet Maternal Survival Series steering group. Strategies for reducing maternal mortality: getting on with what works. Lancet 2006;368(9543):1284-1299ArticlePubMed
- 4. Hare TS, Barcus HR. Geographical accessibility and Kentucky’s heart-related hospital services. Appl Geogr 2007;27(3-4):181-205Article
- 5. Combier E, Charreire H, Le Vaillant M, Michaut F, Ferdynus C, Amat-Roze JM, et al. Perinatal health inequalities and accessibility of maternity services in a rural French region: closing maternity units in Burgundy. Health Place 2013;24: 225-233ArticlePubMed
- 6. Pilkington H, Blondel B, Papiernik E, Cuttini M, Charreire H, Maier RF, et al. Distribution of maternity units and spatial access to specialised care for women delivering before 32 weeks of gestation in Europe. Health Place 2010;16(3):531-538ArticlePubMed
- 7. Blondel B, Drewniak N, Pilkington H, Zeitlin J. Out-of-hospital births and the supply of maternity units in France. Health Place 2011;17(5):1170-1173ArticlePubMed
- 8. Vali Y, Rashidian A, Jalili M, Omidvari AH, Jeddian A. Effectiveness of regionalization of trauma care services: a systematic review. Public Health 2017;146: 92-107ArticlePubMed
- 9. Okwaraji YB, Mulholland K, Schellenberg JR, Andarge G, Admassu M, Edmond KM. The association between travel time to health facilities and childhood vaccine coverage in rural Ethiopia. A community based cross sectional study. BMC Public Health 2012;12: 476ArticlePubMedPMC
- 10. Kedziora DJ, Stuart RM, Pearson J, Latypov A, Dierst-Davies R, Duda M, et al. Optimal allocation of HIV resources among geographical regions. BMC Public Health 2019;19(1):1509ArticlePubMedPMC
- 11. Breckenkamp J, Mielck A, Razum O. Health inequalities in Germany: do regional-level variables explain differentials in cardiovascular risk? BMC Public Health 2007;7: 132ArticlePubMedPMC
- 12. Berns SD, Kott A, DeGroat N, Paap K, Signorile K, Umemoto A. Toward improving the outcome of pregnancy III: enhancing perinatal health through quality, safety and performance initiatives. 2010 [cited 2021 Jul 1]. Available from: https://www.marchofdimes.org/toward-improving-the-outcome-of-pregnancy-iii.pdf
- 13. Nguyen YL, Kahn JM, Angus DC. Reorganizing adult critical care delivery: the role of regionalization, telemedicine, and community outreach. Am J Respir Crit Care Med 2010;181(11):1164-1169ArticlePubMed
- 14. Siegel E, Gillings D, Campbell S, Guild P. A controlled evaluation of rural regional perinatal care: impact on mortality and morbidity. Am J Public Health 1985;75(3):246-253ArticlePubMedPMC
- 15. Gortmaker S, Sobol A, Clark C, Walker DK, Geronimus A. The survival of very low-birth weight infants by level of hospital of birth: a population study of perinatal systems in four states. Am J Obstet Gynecol 1985;152(5):517-524ArticlePubMed
- 16. McCormick MC, Shapiro S, Starfield BH. The regionalization of perinatal services. Summary of the evaluation of a national demonstration program. JAMA 1985;253(6):799-804ArticlePubMed
- 17. Paneth N, Kiely JL, Wallenstein S, Marcus M, Pakter J, Susser M. Newborn intensive care and neonatal mortality in low-birth-weight infants: a population study. N Engl J Med 1982;307(3):149-155ArticlePubMed
- 18. Rashidian A, Omidvari AH, Vali Y, Mortaz S, Yousefi-Nooraie R, Jafari M, et al. The effectiveness of regionalization of perinatal care services-a systematic review. Public Health 2014;128(10):872-885ArticlePubMed
- 19. Brown SA, Richards ME, Elwell EC, Rayburn WF. Geographical information systems for mapping maternal ground transport to level III care neonatal centers. Am J Perinatol 2014;31(4):287-292ArticlePubMed
- 20. Baray J, Cliquet G. Optimizing locations through a maximum covering/p-median hierarchical model: maternity hospitals in France. J Bus Res 2013;66(1):127-132Article
- 21. Tao Z, Cheng Y, Liu J. Hierarchical two-step floating catchment area (2SFCA) method: measuring the spatial accessibility to hierarchical healthcare facilities in Shenzhen, China. Int J Equity Health 2020;19(1):164ArticlePubMedPMC
- 22. Marandi SA, Farrokhzad N, Moradi R, Rezaeizadeh G, Shariat M, Nayeri FS. Review of the Iranian newborns’ health, survival, and care and future challenges. Arch Iran Med 2019;22(7):403-409PubMed
- 23. Doshmangir L, Bazyar M, Majdzadeh R, Takian A. So near, so far: four decades of health policy reforms in Iran, achievements and challenges. Arch Iran Med 2019;22(10):592-605PubMed
- 24. Asadi-Lari M, Sayyari AA, Akbari ME, Gray D. Public health improvement in Iran--lessons from the last 20 years. Public Health 2004;118(6):395-402ArticlePubMed
- 25. IndexMundi. Iran - mortality rate [cited 2021 Jul 1]. Available from: https://www.indexmundi.com/facts/iran/mortality-rate#SH.DYN.NMRT
- 26. Khajavi A, Pishgar F, Dehghani M, Naderimagham S. Socioeconomic inequalities in neonatal and postneonatal mortality: evidence from rural Iran, 1998-2013. Int J Equity Health 2017;16(1):83ArticlePubMedPMC
- 27. Mohammadi Daniali Z, Sepehri MM, Movahedi Sobhani F, Heidarzadeh M. Equitable distribution of neonatal intensive care unit: a healthcare planning case study. Int J Hosp Res 2020;9(2):1-17
- 28. Khalili N, Moradi-Lakeh M, Heidarzadeh M. Low birth weight in Iran based on Iranian Maternal and Neonatal Network (IMaN). Med J Islam Repub Iran 2019;33: 30ArticlePubMedPMC
- 29. Rashidian A, Yousefi NR, Azemikhah A, Heydarzadeh M, Changizi N, Mahta BF, et al. Perinatal care regionalization and geographical distribution model in the Islamic Republic of Iran. Hakim Res J 2008;11(2):1-11. (Persian)
- 30. Saaty TL. A scaling method for priorities in hierarchical structures. J Math Psychol 1977;15(3):234-281Article
- 31. Liberatore MJ, Nydick RL. The analytic hierarchy process in medical and health care decision making: a literature review. Eur J Oper Res 2008;189(1):194-207Article
- 32. Church R, ReVelle C. The maximal covering location problem. Pap Reg Sci Assoc 1974;32(1):101-118Article
- 33. Dell’Olmo P, Ricciardi N, Sgalambro A. A multiperiod maximal covering location model for the optimal location of intersection safety cameras on an urban traffic network. Procedia Soc Behav Sci 2014;108: 106-117Article
- 34. Smith HK, Harper PR, Potts CN. Bicriteria efficiency/equity hierarchical location models for public service application. J Oper Res Soc 2013;64(4):500-512Article
REFERENCES
Figure & Data
References
Citations
- Epidemiology and Clinical Features of COVID-19 among 4,015 Neonates in Iran: Results of the National Study from the Iranian Maternal and Neonatal Network
David A. Schwartz, Parisa Mohagheghi, Fereshteh Moshfegh, Nazanin Zafaranloo, Narjes Khalili, Mohammad Heidarzadeh, Abbas Habibelahi, Roya Ghafoury, Fatemeh Afrashteh
American Journal of Perinatology.2024; 41(S 01): e1698. CrossRef - Global burden and inequality of maternal and neonatal disorders: based on data from the 2019 Global Burden of Disease study
R Peng, Y Tong, M Yang, J Wang, L Yang, J Zhu, Yu Liu, H Wang, Z Shi, Ya Liu
QJM: An International Journal of Medicine.2024; 117(1): 24. CrossRef - Multi-objective mammography unit location–allocation problem: A case study
Marcos Vinícius Andrade de Campos, Romário dos Santos Lopes de Assis, Marcone Jamilson Freitas Souza, Eduardo Camargo de Siqueira, Maria Amélia Lopes Silva, Sérgio Ricardo de Souza
Operations Research for Health Care.2024; 41: 100430. CrossRef - An optimization model for equitable accessibility to magnetic resonance imaging technology in developing countries
João Flávio de Freitas Almeida, Samuel Vieira Conceição, Virgínia Silva Magalhães
Decision Analytics Journal.2022; 4: 100105. CrossRef
 PubReader
 ePub Link
 Cite
Cite


