
Articles
- Page Path
- HOME > J Prev Med Public Health > Volume 45(4); 2012 > Article
-
Original Article
Relationship Between Body Mass Index and Early Menarche of Adolescent Girls in Seoul - Chang-Mo Oh, In-Hwan Oh, Kyung-Sik Choi, Bong-Keun Choe, Tai-Young Yoon, Joong-Myung Choi
-
Journal of Preventive Medicine and Public Health 2012;45(4):227-234.
DOI: https://doi.org/10.3961/jpmph.2012.45.4.227
Published online: July 31, 2012
Department of Preventive Medicine, Kyung Hee University School of Medicine, Seoul, Korea.
- Corresponding author: Joong-Myung Choi, MD, PhD. 26 Kyungheedae-ro, Dongdaemun-gu, Seoul 130-701, Korea. Tel: +82-2-961-0318, Fax: +82-2-969-0792, jmchoi@khu.ac.kr
Copyright © 2012 The Korean Society for Preventive Medicine
This is an Open Access article distributed under the terms of the Creative Commons Attribution Non-Commercial License (http://creativecommons.org/licenses/by-nc/3.0/) which permits unrestricted non-commercial use, distribution, and reproduction in any medium, provided the original work is properly cited.
ABSTRACT
-
Objectives
- The object of this study was to determine the relationship between body mass index (BMI) and early menarche in adolescent girls in Seoul.
-
Methods
- A retrospective study was conducted with 144 middle school students in Seoul who provided informed consent. We measured their body composition, and used the questionnaire survey method for data collection from November to December 2008. Past elemental body composition data were collected from elementary school health records of first year of middle school.
-
Results
- The early menarcheal group was taller and heavier than the late menarcheal group (p<0.05 from 8-12 years old). The body fat percentage (%), BMI were higher in the early menarcheal girls than the late-menarcheal girls (p<0.05, age at 13). In the result of multiple logistic regression, the BMI at the age of 8 and 9 was associated with early menarche after adjusting for birth weight, breast feeding and age at menarche of the mother (BMI at the age of 8: p for trend=0.01, BMI at the age of 9: p for trend=0.04). An increase in BMI from 7 to 8 year was associated with early menarche after adjusting for birth weight, breast feeding, age at menarche of the mother (p for trend=0.048).
-
Conclusions
- The BMI at the age of 8 and 9 was associated with the early menarche of girls and increase in BMI from 7 to 8 year was associated with the early menarche of girls. These results suggest that BMI and increase in BMI before menarche cause early menarche. Although this study does not represent all Korean adolescent girls, it is one of the few studies that have investigated the temporal relationship between BMI and early menarche.
- Since the early 20th century, the age at menarche has been becoming dramatically younger around the world [1]. In Korea, changes in the age at menarche of women born between 1920 and 1985 were previously examined by using 2005 survey data from the Korean National Health and Nutrition Examination Survey. It was found that the average age at menarche of the subjects born between 1920 and 1925 was 16.9, whereas the average age of the subjects born between 1980 and 1985 was 13.8, indicating that the age at menarche was declining in Korea as well [2].
- The declining age of menarche is drawing attention from the health scientific community, because changes in the age of menarche or early menarche is known to be a risk factor for disease, for example, obesity, metabolic syndrome, cardiovascular disease and breast cancer [3,4]. Early menarche causes premature closure of the epiphyseal plates, and thus women who experience menarche at an early age are known to have a shorter final height than other women [5], but also higher risks of cancer related to female hormones such as breast cancer and endometrial cancer due to increased exposure to estrogen [6,7]. Moreover, menarche at an early age acts as a risk factor for metabolic syndrome, diabetes, and cardiovascular problems, and even increases the mortality rate from ischemic heart disease and stroke [8-13].
- Various factors are known to be associated with the age at menarche. In particular, genetic factors have a great influence on the age at menarche [14]. Also, obesity is known to be a main risk factor for early menarche. However, the causal relationship between obesity and early menarche remains controversial [15-17]. Some studies suggest that age at menarche is not declining despite increased the body mass index (BMI) in the US, and also argue that BMI is not related to age at menarche [18]. Some other studies argue that it is difficult to identify a correlation between the two factors-obesity and age at menarche-because most studies are mainly cross-sectional [16]. In Korea, several cross-sectional studies on the correlation between obesity and age at menarche were carried out, and they report a correlation between the two factors [2,19]. There have been studies overseas that considered such a temporal relationship to assert that increased BMI during early childhood and early adolescence are related to peak growth velocity and fast sexual maturity, which are indicators of puberty [20,21]. However, such studies focus on peak growth velocity or breast development, and little research has been performed on the relationship with the age at menarche. In particular, it is difficult to find research cases in Korea that have identified a causal relationship between the two factors-that is, whether or not obesity is a risk factor for early menarche-through a temporal relationship.
- This study aimed to analyze whether increases in BMI act as a risk factor for early menarche by examining whether previous BMI affects the age of menarche, based on the school health records of students in their first year of middle school. The study also attempted to ascertain whether the rate of increase in BMI in early adolescence is related to early menarche by using physical measurements included in the school health records.
INTRODUCTION
- Study Subjects
- This study used retrospective data to investigate the relationship between BMI, which is a well-known surrogate variable for obesity, and early menarche. This study was approved by the institutional review board of Kyung Hee University for clinical studies. The researchers contacted district offices of education in Seoul and school officials, and obtained their consent after explaining the study's purpose and content. The research team subsequently selected one middle school in Seoul from which they could collect previous school health records of students. The survey was begun in November 2008 and ended in December the same year. During this period, both questionnaire surveys and physical measurement surveys were conducted. The study participants were 240 first year (or grade 7) middle school students. A school notice and a survey questionnaire were sent to the selected students' parents to obtain their consent before starting the survey.
- Based on the cut-off value of previous studies [22], the students were divided into an early menarcheal group (experienced menarche before the age of 12) and a late menarcheal group (experienced menarche after the age of 12 or who had yet to experience it).
- Of the 240 participants, 16 students who did not consent to taking the survey and did not answer the questions regarding the experience of menarche and age at menarche were excluded. Also an additional 80 people who had missing values in the survey questions and physical measurement were excluded from the study. A total of 96 students (40.0%) were excluded. As a result, a total of 144 students (60.0%) were chosen as the study subjects of this study.
- Survey Tools and Measurement
- For physical measurement, the participants' height and weight were measured to calculate the BMI. The waist was measured horizontally at the highest point of the pelvic bone. A bioelectrical impedance analysis device (X-ME; Jawon Medical, Gyeongsan, Korea) was used to measure the weight and body fat percentage (%). Students have annual physical examinations, and the records of such examinations including the measurements of height and weight are entered into school health records [23]. For this study, their height, weight, BMI, body fat, and waist measurement at grade 7 middle school were taken directly, whereas previous records of height, weight, and BMI from grade 1 to grade 6 in elementary school were taken from elementary school health records. From the previous school health records containing physical measurements of the students from grade 1 to grade 6, it was impossible to determine when the measurements were taken, and thus the age was calculated based on the given grade (i.e., the age of grade 6 elementary school students was assumed 12 years old). Meanwhile, other factors affecting the age of menarche such as the mother's age at menarche, birth weight, and breastfeeding were obtained through a questionnaire survey. The questionnaire for precocious puberty survey among children, which had been previously used at Paik Hospital, adapted for this study [24]. The age was calculated by subtracting the date of birth from the date of measurement. As for of the participants, either the mother or the student herself was asked to specify whether the student had experienced menarche and, if the answer was yes, to write down the actual age at the time of menarche on the questionnaire sheet. The parents of students replied to the questionnaire about age at menarche of the mother and their child's birth weight, and the age at menarche among the mothers was divided into ≤13, 14, 15, and ≥16. As for breastfeeding, the mothers were asked to answer whether they had breastfed in the past.
- Statistical Analysis
- The early menarcheal group(≤12 years of menarcheal age) and late menarcheal group(>12 years of menarcheal age) were compared using an independent t-test and chi-squared test. The BMI and the increased rate of BMI were divided by the interquartile range, and the birth weight was categorized into interquartiles following prior research results on the relationship between birth weight and age at menarche [23]. To investigate the relationship between previous BMI before menarche and early menarche, the mother's age at menarche, birth weight, and breastfeeding, which are factors known to influence on the age of menarche, were used for a multiple logistic regression analysis [21,25,26]. The multiple logistic regression analyzed the relationship between BMI at the ages of 7, 8, and 9, and early menarche, as well as whether changes in BMI at the ages of 7 to 8, 8 to 9, and 9 to 10 before the start of menarche had any relationship with early menarche. A trend test using a Wald test was performed to determine whether categorical variables exhibited a linear trend in the multiple logistic regression model. Also, a generalized estimating equation was used to examine whether increases in BMI year by year from 7 to 13 year varied depending on the age at menarche. For a working correlation matrix, the 1st-order autoregressive matrix that showed the lowest quasi-likelihood information criterion value was selected and 1 grade of increase was considered to correspond with one year. All statistical analyses were carried out using SPSS version 18.0 (SPSS Inc., Chicago, IL, USA), and the significance level for all statistical tests was 5% [27].
METHODS
- Table 1 shows the general characteristics of the 32 subjects in the early menarcheal group and the 112 subjects in the late menarcheal group, while also comparing height, weight, and BMI from grade 1 in elementary school to grade 7 in middle school. The average age of the subjects was 12.8±0.4 for the early menarche group and 12.7±0.5 for the late menarche group, and there was no significance difference (p=0.23). The early menarcheal group were taller and heavier than the late menarcheal group with except at ages 7 and 13 (p<0.05) and had a higher BMI than the late menarcheal group at ages 8 to 10 (p<0.05). The BMI and body fat percentage (%) measured at age 13 in middle school also showed a significant difference between the two groups (p<0.05), while waist had no statistically significant difference between the two groups (p=0.11). Birth weight, mother's age at menarche, and breast feeding showed no statistically significant differences between the two groups (p>0.05).
- In the multiple logistic regression model, BMI at the age of 7 did not show a significant correlation with early menarche in Model 1 (p for trend=0.12) (Table 2). In Model 2, higher BMI at the age of 8 was associated with early menarche when adjusted for birth weight, breastfeeding and mother's age at menarche (p for trend=0.01). In Model 3, higher BMI at the age of 9 was also associated with early menarche when adjusted for birth weight, breastfeeding, and mother's age at menarche (p for trend=0.04). Akaike's information criterion (AIC) for the entire model including the BMIs at the ages of 7, 8, and 9 was 153.59, and the AIC of Models 1, 2, and 3 was lower than that of the entire model; the AIC of Model 2, which used for BMI at the age of 8, was the lowest at 145.59, reflecting that this model is the best fit model.
- In the multiple logistic regression model, the increase in BMI from the ages of 7 to 8 was associated with early menarche in Model 1 (p for trend=0.048) (Table 3). However, the increase in BMI from the ages of 8 to 9 was not associated with early menarche in the model 2 (p for trend=0.82) and the increase in BMI from the ages of 9 to 10 was not associated with early menarche in the Model 3 (p for trend=0.81). The AIC of the entire model that included all increases in BMI from the ages of 7 to 8, 8 to 9, and 9 to 10 was 152.68, and the AIC of Model 1 including the increase in BMI increase from the ages of 7 to 8 was the lowest at 149.38, indicating that it had the best explanatory power.
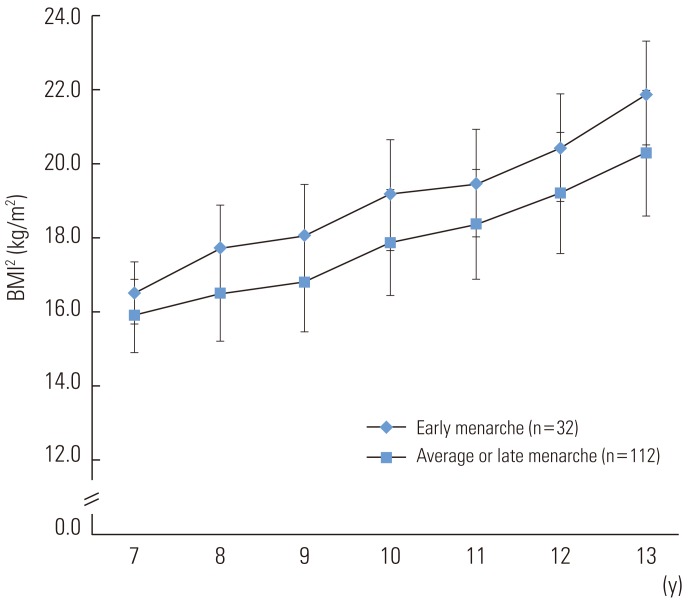
- There was a significant interaction between the menarcheal group and time indicating significant difference trends across the groups (p=0.02) (Figure 1). The regression coefficient for increased BMI of the late menarche group was 0.73. Meanwhile, the regression coefficient for increased BMI of the early menarche group was 0.90, indicating that BMI of the early menarcheal group increased faster than that of the late menarcheal group.
RESULTS
- This study suggests that the early menarcheal group had greater body weight and BMI from 8 to 10 in elementary school compared to the late menarche group. Also, the finding of greater BMI at the ages of 8 and 9 even after adjusting for birth weight, breastfeeding, and mother's age at menarche indicates that BMI is related to early menarche. Generalized estimating equations also found that the early menarche group had greater increases in BMI over time than the late menarche group. Also, a higher BMI increase from age 7 to 8 was associated with early menarche. However, the BMI increase from the ages of 8 to 9 and 9 to 10 were found to have no correlation with early menarche, implying that a BMI increase from the ages of 7 to 8, that is, before the age of puberty, is related to early menarche [20,21].
- There is some cross-sectional epidemiological evidence in Korea that has suggested a correlation of BMI with menarche [2,17]. A survey on physical measurements of youth in 2005 also showed that the group that experienced menarche between the ages of 11 and 13 had greater height, weight, and BMI than those of the group that did not experience menarche during those ages [19]. A study using National Health and Nutritional Examination Survey 2005 also found that the group that experienced menarche had greater BMI than the group that did not, even after adjusting for age [2]. The present study presents similar results, as it found the early menarcheal group had greater height, weight, and BMI than the late menarcheal group.
- In Korea, the continuous decline of the age at menarche and increase in BMI among adolescents suggest that the earlier age at menarche may be associated with increase in BMI, which is a surrogate indicator of body fat percentage (%) [2,28]. Moreover, studies involving North Korean refugees with similar genetic factors as South Koreans found that the North Korean refugees' age at menarche was higher than South Koreans [29]. Given the environmental conditions of North Korean refugees, it can be supposed that nutrition and BMI played a critical role in the difference in the age at menarche from that of South Koreans [29].
- Several studies have reported that women who experience early menarche or puberty may have risk factors for obesity later [30,31]. This argument suggests that obesity does not trigger early puberty but rather early puberty triggers obesity. One study has argued that BMI was not correlated with age at menarche at the level of population [18]. However, a cohort study in Pennsylvania suggests that children who had higher body fat or BMI at the ages of 5 and 7 had a higher possibility of belonging to an early puberty group at the age of 9 [32]. Furthermore, a large-scale cohort study in Sweden discovered that increases in BMI between ages 2 and 8 were related to peak growth velocity, which is an important indicator of puberty, and reported that increases in BMI precede puberty [20]. Another cohort study in the US reported that BMI z-score at 36 months, as well as rate of BMI change from 36 months to grade 1 are related to early puberty [21]. Such studies demonstrate that increases in body fat in early childhood and adolescence influence development during puberty. This study also showed that increases in BMI from age 7 to 8 were related to early menarche, even after adjusting for confounding factors, showing that increases in body fat precede early menarche and may even trigger early menarche.
- The mechanism by which increased body fat triggers early puberty and menarche can be explained by a number of hypotheses tested through animal research [33,34]. Leptin secreted from body fat acts directly on the hypothalamus to stimulate gonadotrophin releasing hormone as well as to increase secretion of luteinizing hormone and follicle-stimulating hormone from the pituitary gland while also stimulating enzymes needed for androgen synthesis at adrenal glands, leading to increased secretion of sex hormones [35].
- The limitation of this study is that it has a small sample of middle schools students in one grade in the Seoul. Therefore, it may not be generalized to all Korean adolescents. The small sample size also means low statistical power. The study subjects were selected based on their actual age, but the fact that their respective ages were assumed from school grades in terms of their school health records could have acted as a measurement bias during the survey. In terms of the mother's age at menarche and the child's age at menarche, there could have been a memory decay bias as it determined through a questionnaire, but it is known that the accuracy is good if the age at menarche was not a long time ago [36,37]. Also, for obesity and age at menarche, because the latter is influenced by endocrine hormones, the study results should be validated through measurement of endocrine hormonal levels in the blood to strengthen their correlation.
- Despite such limitations, this study offers a distinct contribution to the literature, as it is one of the few works in Korea that has revealed a temporal relationship between BMI, an index for obesity, and early menarche.
DISCUSSION
- 1. Harris MA, Prior JC, Koehoorn M. Age at menarche in the Canadian population: secular trends and relationship to adulthood BMI. J Adolesc Health 2008;43(6):548-554. 19027642ArticlePubMed
- 2. Cho GJ, Park HT, Shin JH, Hur JY, Kim YT, Kim SH, et al. Age at menarche in a Korean population: secular trends and influencing factors. Eur J Pediatr 2010;169(1):89-94. 19504269ArticlePubMed
- 3. Sloboda DM, Hickey M, Hart R. Reproduction in females: the role of the early life environment. Hum Reprod Update 2011;17(2):210-227. 20961922ArticlePubMed
- 4. Golub MS, Collman GW, Foster PM, Kimmel CA, Rajpert-De Meyts E, Reiter EO, et al. Public health implications of altered puberty timing. Pediatrics 2008;121(Suppl 3):S218-S230. 18245514ArticlePubMed
- 5. Onland-Moret NC, Peeters PH, van Gils CH, Clavel-Chapelon F, Key T, Tjonneland A, et al. Age at menarche in relation to adult height: the EPIC study. Am J Epidemiol 2005;162(7):623-632. 16107566ArticlePubMed
- 6. Hsieh CC, Trichopoulos D, Katsouyanni K, Yuasa S. Age at menarche, age at menopause, height and obesity as risk factors for breast cancer: associations and interactions in an international case-control study. Int J Cancer 1990;46(5):796-800. 2228308ArticlePubMed
- 7. Berkey CS, Frazier AL, Gardner JD, Colditz GA. Adolescence and breast carcinoma risk. Cancer 1999;85(11):2400-2409. 10357411ArticlePubMed
- 8. He C, Zhang C, Hunter DJ, Hankinson SE, Buck Louis GM, Hediger ML, et al. Age at menarche and risk of type 2 diabetes: results from 2 large prospective cohort studies. Am J Epidemiol 2010;171(3):334-344. 20026580ArticlePubMedPMC
- 9. Karapanou O, Papadimitriou A. Determinants of menarche. Reprod Biol Endocrinol 2010;8: 115. 20920296ArticlePubMedPMC
- 10. Jacobsen BK, Oda K, Knutsen SF, Fraser GE. Age at menarche, total mortality and mortality from ischaemic heart disease and stroke: the Adventist Health Study, 1976-88. Int J Epidemiol 2009;38(1):245-252. 19188208ArticlePubMedPMC
- 11. Remsberg KE, Demerath EW, Schubert CM, Chumlea WC, Sun SS, Siervogel RM. Early menarche and the development of cardiovascular disease risk factors in adolescent girls: the Fels Longitudinal Study. J Clin Endocrinol Metab 2005;90(5):2718-2724. 15728207ArticlePubMed
- 12. Frontini MG, Srinivasan SR, Berenson GS. Longitudinal changes in risk variables underlying metabolic Syndrome X from childhood to young adulthood in female subjects with a history of early menarche: the Bogalusa Heart Study. Int J Obes Relat Metab Disord 2003;27(11):1398-1404. 14574352ArticlePubMed
- 13. Lakshman R, Forouhi NG, Sharp SJ, Luben R, Bingham SA, Khaw KT, et al. Early age at menarche associated with cardiovascular disease and mortality. J Clin Endocrinol Metab 2009;94(12):4953-4960. 19880785ArticlePubMed
- 14. Van den Berg SM, Setiawan A, Bartels M, Polderman TJ, van der Vaart AW, Boomsma DI. Individual differences in puberty onset in girls: Bayesian estimation of heritabilities and genetic correlations. Behav Genet 2006;36(2):261-270. 16408250ArticlePubMed
- 15. Legro RS, Lin HM, Demers LM, Lloyd T. Rapid maturation of the reproductive axis during perimenarche independent of body composition. J Clin Endocrinol Metab 2000;85(3):1021-1025. 10720033ArticlePubMed
- 16. Jasik CB, Lustig RH. Adolescent obesity and puberty: the "perfect storm". Ann N Y Acad Sci 2008;1135: 265-279. 18574233ArticlePubMed
- 17. Dunger DB, Ahmed ML, Ong KK. Effects of obesity on growth and puberty. Best Pract Res Clin Endocrinol Metab 2005;19(3):375-390. 16150381ArticlePubMed
- 18. Demerath EW, Towne B, Chumlea WC, Sun SS, Czerwinski SA, Remsberg KE, et al. Recent decline in age at menarche: the Fels Longitudinal Study. Am J Hum Biol 2004;16(4):453-457. 15214063ArticlePubMed
- 19. Kim JY, Oh IH, Lee EY, Oh CM, Choi KS, Choe BK, et al. The relation of menarcheal age to anthropometric profiles in Korean girls. J Korean Med Sci 2010;25(10):1405-1410. 20890418ArticlePubMedPMC
- 20. He Q, Karlberg J. BMI in childhood and its association with height gain, timing of puberty, and final height. Pediatr Res 2001;49(2):244-251. 11158521ArticlePubMed
- 21. Lee JM, Appugliese D, Kaciroti N, Corwyn RF, Bradley RH, Lumeng JC. Weight status in young girls and the onset of puberty. Pediatrics 2007;119(3):e624-e630. 17332182ArticlePubMed
- 22. Braithwaite D, Moore DH, Lustig RH, Epel ES, Ong KK, Rehkopf DH, et al. Socioeconomic status in relation to early menarche among black and white girls. Cancer Causes Control 2009;20(5):713-720. 19107561ArticlePubMed
- 23. Cho HJ, Park CM. Analysis of the result of health examination for students of special school and general school: making Deagu City a Subject of Study. Korean J Growth Dev 2004;12(4):63-78. (Korean)
- 24. Park MJ, Lee IS, Shin EK, Joung H, Cho SI. The timing of sexual maturation and secular trends of menarchial age in Korean adolescents. Korean J Pediatr 2006;49(6):610-616. (Korean)Article
- 25. Ruder EH, Hartman TJ, Rovine MJ, Dorgan JF. Birth characteristics and age at menarche: results from the dietary intervention study in children (DISC). Cancer Causes Control 2010;21(9):1379-1386. 20495859ArticlePubMedPMC
- 26. Al-Sahab B, Adair L, Hamadeh MJ, Ardern CI, Tamim H. Impact of breastfeeding duration on age at menarche. Am J Epidemiol 2011;173(9):971-977. 21430189ArticlePubMedPMC
- 27. Allen PJ, Bennett K. PASW statistics by SPSS version 18.0. 2010. South Melbourne: Cengage Learning
- 28. Park YS, Lee DH, Choi JM, Kang YJ, Kim CH. Trend of obesity in school age children in Seoul over the past 23 years. Korean J Pediatr 2004;47(3):247-257. (Korean)
- 29. Ku SY, Kang JW, Kim H, Kim YD, Jee BC, Suh CS, et al. Age at menarche and its influencing factors in North Korean female refugees. Hum Reprod 2006;21(3):833-836. 16199433ArticlePubMed
- 30. Garn SM, LaVelle M, Rosenberg KR, Hawthorne VM. Maturational timing as a factor in female fatness and obesity. Am J Clin Nutr 1986;43(6):879-883. 3717062ArticlePubMed
- 31. Pierce MB, Leon DA. Age at menarche and adult BMI in the Aberdeen children of the 1950s cohort study. Am J Clin Nutr 2005;82(4):733-739. 16210700ArticlePubMed
- 32. Davison KK, Susman EJ, Birch LL. Percent body fat at age 5 predicts earlier pubertal development among girls at age 9. Pediatrics 2003;111(4 Pt 1):815-821. 12671118ArticlePubMedPMC
- 33. Chehab FF, Mounzih K, Lu R, Lim ME. Early onset of reproductive function in normal female mice treated with leptin. Science 1997;275(5296):88-90. 8974400ArticlePubMed
- 34. Ahima RS, Dushay J, Flier SN, Prabakaran D, Flier JS. Leptin accelerates the onset of puberty in normal female mice. J Clin Invest 1997;99(3):391-395. 9022071ArticlePubMedPMC
- 35. Shalitin S, Phillip M. Role of obesity and leptin in the pubertal process and pubertal growth: a review. Int J Obes Relat Metab Disord 2003;27(8):869-874. 12861226ArticlePubMed
- 36. Ko KP, Park SK, Kim Y, Bae J, Jun JK, Gwack J, et al. Reliability of a questionnaire for women's reproductive history. J Prev Med Public Health 2008;41(3):181-185. (Korean). 18515995ArticlePubMedPDF
- 37. Koo MM, Rohan TE. Accuracy of short-term recall of age at menarche. Ann Hum Biol 1997;24(1):61-64. 9022907ArticlePubMed
REFERENCES
| Variables | Early menarche- al group (n = 32) | Average or late menarcheal group (n = 112) | p-value |
|---|---|---|---|
| Age (y) | 12.8±0.4 | 12.7±0.5 | 0.231 |
| Menarche | |||
| Yes | 32 (100.0) | 84 (75.0) | 0.0022 |
| No | 0 (0.0) | 28 (25.0) | |
| Age at menarche (y) | |||
| 10 | 10 (31.3) | <0.0012 | |
| 11 | 22 (68.7) | ||
| 12 | 54 (64.3) | ||
| 13 | 30 (35.7) | ||
| Height (cm) | |||
| 7 y old | 121.2±4.6 | 119.4±4.9 | 0.081 |
| 8 y old | 128.3±5.3 | 126.0±5.0 | 0.031 |
| 9 y old | 134.4±5.9 | 131.7±5.6 | 0.021 |
| 10 y old | 141.8±5.6 | 137.1±6.1 | <0.0011 |
| 11 y old | 149.0±6.2 | 144.1±6.8 | <0.0011 |
| 12 y old | 154.3±5.9 | 150.5±6.6 | 0.0041 |
| 13 y old | 157.9±4.5 | 156.7±5.8 | 0.301 |
| Weight (kg) | |||
| 7 y old | 24.3±3.4 | 22.8±4.2 | 0.061 |
| 8 y old | 29.4±5.2 | 26.4±5.4 | 0.0061 |
| 9 y old | 32.9±6.5 | 29.3±6.3 | 0.0061 |
| 10 y old | 38.7±8.0 | 33.9±7.5 | 0.0021 |
| 11 y old | 43.5±8.7 | 38.5±8.7 | 0.0051 |
| 12 y old | 49.0±9.2 | 43.9±9.7 | 0.0091 |
| 13 y old | 54.7±8.6 | 50.1±10.2 | 0.021 |
| BMI3 (kg/m2) | |||
| 7 y old | 16.5±1.7 | 15.9±2.0 | 0.101 |
| 8 y old | 17.8±2.3 | 16.5±2.5 | 0.011 |
| 9 y old | 18.1±2.8 | 16.8±2.6 | 0.021 |
| 10 y old | 19.2±3.0 | 17.9±2.9 | 0.031 |
| 11 y old | 19.5±2.9 | 18.4±3.0 | 0.061 |
| 12 y old | 20.4±2.9 | 19.2±3.3 | 0.061 |
| 13 y old | 21.9±2.8 | 20.3±3.4 | 0.021 |
| Body fat (%) | 26.7±4.6 | 23.8±5.8 | 0.011 |
| Waist circumference (cm) | 69.0±6.0 | 66.5±8.0 | 0.111 |
| Birth weight (kg) | 3.1±0.4 | 3.2±0.4 | 0.291 |
| Age at menarche of mother (y) | 14.7±1.8 | 15.0±1.2 | 0.281 |
| Breastfeeding | |||
| Yes | 24 (75.0) | 90 (80.4) | 0.512 |
| No | 8 (25.0) | 22 (19.6) |
| Variables |
Model 11 |
Model 21 |
Model 31 |
||||||
|---|---|---|---|---|---|---|---|---|---|
| OR2 | 95% CI | p for trend | OR | 95% CI | p for trend | OR | 95% CI | p for trend | |
| Quartile of BMI3 (kg/m2) | |||||||||
| 7 y old | |||||||||
| Q1 (<14.72) | 1.00 | 0.12 | |||||||
| Q2 (14.72 - 15.65) | 4.52 | 0.93, 21.98 | |||||||
| Q3 (15.65 - 16.98) | 2.57 | 0.55, 12.16 | |||||||
| Q4 (≥16.98) | 4.42 | 0.99, 19.78 | |||||||
| 8 y old | |||||||||
| Q1 (<14.85) | 1.00 | ||||||||
| Q2 (14.85 - 16.34) | 3.61 | 0.63, 20.83 | 0.01 | ||||||
| Q3 (16.34 - 18.21) | 10.02 | 1.88, 53.49 | |||||||
| Q4 (≥18.21) | 6.69 | 1.24, 36.04 | |||||||
| 9 y old | |||||||||
| Q1 (<15.03) | 1.00 | ||||||||
| Q2 (15.03 - 16.65) | 6.52 | 1.17, 36.38 | 0.04 | ||||||
| Q3 (16.65 - 18.20) | 6.79 | 1.22, 37.72 | |||||||
| Q4 (≥18.20) | 7.19 | 1.33, 38.80 | |||||||
| Birth weight4 (kg) | |||||||||
| Q1 (<2.98) | 1.00 | 0.55 | 1.00 | 0.35 | 1.00 | 0.88 | |||
| Q2 (2.98 - 3.18) | 0.65 | 0.17, 2.60 | 0.74 | 0.18, 3.09 | 0.83 | 0.20, 3.46 | |||
| Q3 (3.18 - 3.38) | 0.44 | 0.13, 1.47 | 0.40 | 0.11, 1.38 | 0.44 | 0.13, 1.48 | |||
| Q4 (≥3.38) | 0.79 | 0.25, 2.55 | 0.65 | 0.21, 2.08 | 0.68 | 0.22, 2.16 | |||
| Breastfeeding | |||||||||
| No | 1.00 | 0.93 | 1.00 | 0.72 | 1.00 | 0.88 | |||
| Yes | 0.96 | 0.33, 2.74 | 0.82 | 0.27, 2.43 | 0.92 | 0.32, 2.65 | |||
| Age at menarche of mother (y) | |||||||||
| ≤13 | 1.00 | 0.26 | 1.00 | 0.46 | 1.00 | 0.43 | |||
| 14 | 0.13 | 0.03, 0.60 | 0.22 | 0.06, 0.91 | 0.19 | 0.05, 0.75 | |||
| 15 | 0.08 | 0.02, 0.39 | 0.11 | 0.02, 0.54 | 0.10 | 0.02, 0.46 | |||
| ≥16 | 0.29 | 0.08, 1.06 | 0.42 | 0.11, 1.65 | 0.40 | 0.11, 1.50 | |||
| AIC | 151.07 | 145.59 | 148.16 | ||||||
OR, odds ratio; CI, confidence interval; BMI, body mass index; AIC, Akaike’s information criterion.
1 Model 1 examines quartile of BMI when the study populations were at age 7 years, Model 2 examines quartile of BMI when the study populations were at age 8 years, Model 3 examines quartile of BMI when the study populations were at age 9 years. And all models were adjusted for birth weight, breastfeeding, and age at menarche of mother.
2 Age at menarche of mother, breastfeeding, BMI and birth weight were modeled as categorical variables.
3 Calculated as weight in kilograms divided by height in meters squared and categorized by quartile; Q1: <25%, Q2: 25-50%, Q3: 50-75%, Q4: ≥75%.
4 Categorized by quartile; Q1: <25%, Q2: 25-50%, Q3: 50-75%, Q4: ≥75%.
| Variables |
Model 11 |
Model 21 |
Model 31 |
||||||
|---|---|---|---|---|---|---|---|---|---|
| OR2 | 95% CI | p for trend | OR | 95% CI | p for trend | OR | 95% CI | p for trend | |
| Increase in BMI3 (kg/m2/y) | |||||||||
| 7-8 y old | |||||||||
| Q1 (<-0.031) | 1.00 | 0.048 | |||||||
| Q2 (-0.031 - 0.64) | 5.56 | 1.02, 30.22 | |||||||
| Q3 (0.64 - 1.39) | 4.72 | 0.87, 25.52 | |||||||
| Q4 (≥1.39) | 6.44 | 1.24, 33.53 | |||||||
| 8-9 y old | |||||||||
| Q1 (<-0.30) | 1.00 | 0.82 | |||||||
| Q2 (-0.30 - 0.25) | 2.12 | 0.60, 7.50 | |||||||
| Q3 (0.25 - 0.83) | 2.42 | 0.67, 8.72 | |||||||
| Q4 (≥0.83) | 1.17 | 0.30, 4.51 | |||||||
| 9-10 y old | |||||||||
| Q1 (<0.50) | 1.00 | 0.81 | |||||||
| Q2 (0.50 - 0.95) | 0.64 | 0.17, 2.36 | |||||||
| Q3 (0.95 - 1.56) | 1.97 | 0.61, 6.40 | |||||||
| Q4 (≥1.56) | 0.79 | 0.22, 2.82 | |||||||
| Birth weight4 (kg) | |||||||||
| Q1 (<2.98) | 1.00 | 0.30 | 1.00 | 0.47 | 1.00 | 0.45 | |||
| Q2 (2.98 - 3.18) | 0.57 | 0.14, 2.23 | 0.56 | 0.15, 2.09 | 0.52 | 0.14, 1.92 | |||
| Q3 (3.18 - 3.38) | 0.38 | 0.11, 1.32 | 0.40 | 0.12, 1.35 | 0.33 | 0.09, 1.12 | |||
| Q4 (≥3.38) | 0.58 | 0.18, 1.82 | 0.70 | 0.23, 2.20 | 0.74 | 0.23, 2.38 | |||
| Breastfeeding | |||||||||
| No | 1.00 | 0.86 | 1.00 | 0.97 | 1.00 | 0.83 | |||
| Yes | 0.91 | 0.32, 2.59 | 0.98 | 0.35, 2.73 | 0.89 | 0.32, 2.52 | |||
| Age at menarche of mother (y) | |||||||||
| ≤13 | 1.00 | 0.43 | 1.00 | 0.22 | 1.00 | 0.19 | |||
| 14 | 0.24 | 0.06, 0.94 | 0.23 | 0.06, 0.87 | 0.20 | 0.05, 0.73 | |||
| 15 | 0.11 | 0.03, 0.48 | 0.09 | 0.02, 0.40 | 0.08 | 0.02, 0.37 | |||
| ≥16 | 0.47 | 0.13, 1.71 | 0.39 | 0.11, 1.36 | 0.32 | 0.09, 1.13 | |||
| AIC | 149.38 | 153.6 | 152.77 | ||||||
OR, odds ratio; CI, confidence interval; BMI, body mass index; AIC, Akaike’s information criterion.
1 Model 1 examines the increase in BMI when the study groups grew from 7 to 8 years old, Model 2 examines the increase in BMI when the study groups grew from 8 to 9 years old, Model 3 examines the increase in BMI when the study groups grew from 9-10 years old. All models were adjusted for birth weight, breastfeeding, and age at menarche of the mother.
2 Age at menarche of mother, breastfeeding , and increase in BMI and birth weight were modeled as categorical variables.
3 Calculated as weight in kilograms divided by height in meters squared. Increase rate of BMI were categorized by quartile; Q1: <25%, Q2: 25-50%, Q3: 50-75%, Q4: ≥75%.
4 Categorized by quartile; Q1: <25%, Q2: 25-50%, Q3: 50-75%, Q4: ≥75%.
Figure & Data
References
Citations
- Association of early menarche with elevated BMI, lower body height and relative leg length among 14- to 16-year-old post-menarcheal girls from a Maya community in Yucatan, Mexico
Sudip Datta Banik
Anthropological Review.2022; 85(1): 85. CrossRef - Prepubertal BMI, pubertal growth patterns, and long-term BMI: Results from a longitudinal analysis in Chinese children and adolescents from 2005 to 2016
Yanhui Li, Di Gao, Jieyu Liu, Zhaogeng Yang, Bo Wen, Li Chen, Manman Chen, Ying Ma, Tao Ma, Bin Dong, Yi Song, Sizhe Huang, Yanhui Dong, Jun Ma
European Journal of Clinical Nutrition.2022; 76(10): 1432. CrossRef - Age at Menarche, Growth Velocity, and Adiposity Indices in Italian Girls Aged 10 to 14
Emanuela Gualdi-Russo, Natascia Rinaldo, Gianni Mazzoni, Simona Mandini, Sabrina Masotti, Stefania Toselli, Luciana Zaccagni
Children.2022; 9(12): 1928. CrossRef - Indicators of nutritional status and physical activity level as factors associated with the onset of menarche of ten year old girls from Zadar county, Croatia
Donata Vidaković Samaržija, Marjeta Mišigoj-Duraković, Lara Pavelić Karamatić
International Journal of Adolescent Medicine and Health.2021; 33(3): 219. CrossRef - Marginal Food Security Predicts Earlier Age at Menarche Among Girls From the 2009-2014 National Health and Nutrition Examination Surveys
Mecca E. Burris, Andrea S. Wiley
Journal of Pediatric and Adolescent Gynecology.2021; 34(4): 462. CrossRef - Factors associated with the prevalence of HIV, HSV-2, pregnancy, and reported sexual activity among adolescent girls in rural western Kenya: A cross-sectional analysis of baseline data in a cluster randomized controlled trial
Garazi Zulaika, Elizabeth Nyothach, Anna Maria van Eijk, David Obor, Linda Mason, Duolao Wang, Tao Chen, Emily Kerubo, Valarie Opollo, Isaac Ngere, Samuel Omondi Owino, Boaz Oyaro, Feiko O. ter Kuile, Daniel Kwaro, Penelope Phillips-Howard, Kathryn Mary Y
PLOS Medicine.2021; 18(9): e1003756. CrossRef - The relationship between short stature and menstrual pattern in a large cohort of Iranian girls
Seyed Kazem Farahmand, Maryam Emadzadeh, Golnaz Ghayyem Hassankhani, Mahsa Mirbirjandian, Taraneh Rafiezadeh, Zahra Abasalti, Sayyed Saeid Khayyatzadeh, Afsane Bahrami, Seyed-Amir Tabatabaeizadeh, Maryam Tayefi, Gordon A. Ferns, Kayhan Gonoodi, Alireza Mo
Journal of Obstetrics and Gynaecology.2020; 40(2): 228. CrossRef - Age at menarche, menstrual characteristics, and its associated morbidities among secondary school students in Abakaliki, southeast Nigeria
Chidebe C. Anikwe, Johnbosco E. Mamah, Bartholomew C. Okorochukwu, Ugochukwu U. Nnadozie, Chukwuemeka H. Obarezi, Kenneth C. Ekwedigwe
Heliyon.2020; 6(5): e04018. CrossRef - Knowledge of peri-menarcheal changes and a comparative analysis of the age at menarche among young adolescent school girls in urban and rural Cameroon
Atem Bethel Ajong, Nkengazem Nerry Tankala, Martin Ndinakie Yakum, Ikei Solange Azenoi, Bruno Kenfack
BMC Public Health.2020;[Epub] CrossRef - Prevalence of breast cancer-related risk factors in underweight premenopausal women: the Korea National Health and Nutrition Examination Survey IV–VI
Joo Heung Kim, Kwang Hyun Yoon, Ho Hur, Seho Park, Jee Ye Kim, Hyung Seok Park, Seung II Kim, Young Up Cho, Byeong-Woo Park
Breast Cancer Research and Treatment.2019; 174(2): 515. CrossRef - Time Trends in Age at Menarche and Related Non-Communicable Disease Risk during the 20th Century in Mexico
Inga Petersohn, Arli G. Zarate-Ortiz, Ana C. Cepeda-Lopez, Alida Melse-Boonstra
Nutrients.2019; 11(2): 394. CrossRef - Age at Menarche and Its Related Factors Among Students of Qaen, Eastern Iran: A School-Based Cross-Sectional Study
Asma Tiyuri, Malaknaz Ghannadkafi, Amir Tiyuri, Najmeh Bahramian
Journal of Comprehensive Pediatrics.2019;[Epub] CrossRef - Lifestyle and prevalence of dysmenorrhea among Spanish female university students
Elia Fernández-Martínez, María Dolores Onieva-Zafra, María Laura Parra-Fernández, Antonio Palazón-Bru
PLOS ONE.2018; 13(8): e0201894. CrossRef - Detrimental Effects of Higher Body Mass Index and Smoking Habits on Menstrual Cycles in Korean Women
An Na Jung, Ju Hwan Park, Jihyun Kim, Seok Hyun Kim, Byung Chul Jee, Byung Heun Cha, Jae Woong Sull, Jin Hyun Jun
Journal of Women's Health.2017; 26(1): 83. CrossRef - Earlier age at menarche in girls with rapid early life growth: cohort and within sibling analyses
Julie D. Flom, Barbara A. Cohn, Parisa Tehranifar, Lauren C. Houghton, Ying Wei, Angeline Protacio, Piera Cirillo, Karin B. Michels, Mary Beth Terry
Annals of Epidemiology.2017; 27(3): 187. CrossRef - Association between Obesity and Puberty Timing: A Systematic Review and Meta-Analysis
Wenyan Li, Qin Liu, Xu Deng, Yiwen Chen, Shudan Liu, Mary Story
International Journal of Environmental Research and Public Health.2017; 14(10): 1266. CrossRef - Pattern of teen menstruation among secondary school girls in south east Nigeria
Ada R.C. Nwokocha, Josephat M. Chinawa, Agozie C. Ubesie, Vivian I. Onukwuli, Pius C. Manyike
Journal of Pediatric Endocrinology and Metabolism.2016;[Epub] CrossRef - Age related changes in pelvis size among adolescent and adult females with reference to parturition from Naraingarh, Haryana (India)
Krishan Sharma, Puneet Gupta, Shailza Shandilya
HOMO.2016; 67(4): 273. CrossRef - Early menarche in normal-weight girls and its association with excess weight, abdominal obesity and metabolic changes at the end of sexual maturation
M L D Araújo, P C Cabral, I K G de Arruda, A Silva Diniz, M da Conceição Chaves de Lemos, G Q Morais
European Journal of Clinical Nutrition.2016; 70(11): 1278. CrossRef - Secular Trends and Influencing Factors for the Early Menarche among Korean Middle and High School Girls
Dallong Han, Jongeun Lee, Seonho Kim
The Journal of the Korea Contents Association.2016; 16(3): 319. CrossRef - Earlier menarcheal age in Spanish girls is related with an increase in body mass index between pre‐pubertal school age and adolescence
T. Gavela‐Pérez, C. Garcés, P. Navarro‐Sánchez, L. López Villanueva, L. Soriano‐Guillén
Pediatric Obesity.2015; 10(6): 410. CrossRef - Determinants of age at menarche in Korean elementary school girls
Mi-Kyoung Kwon, Eun Min Seo, Kyong Park
Journal of Nutrition and Health.2015; 48(4): 344. CrossRef - Height Growth and Percentage of Body Fat in Relation to Early Menarche in Girls from Merida, Yucatan, Mexico
Sudip Datta Banik, Nina Mendez, Federico Dickinson
Ecology of Food and Nutrition.2015; 54(6): 644. CrossRef - A Significant Increase in the Incidence of Central Precocious Puberty among Korean Girls from 2004 to 2010
Shin Hye Kim, Kyoung Huh, Sungho Won, Kuk-Wha Lee, Mi-Jung Park, Antonio Gonzalez-Bulnes
PLOS ONE.2015; 10(11): e0141844. CrossRef - Relationship of age at menarche on anthropometric index and menstrual irregularity in late adolescent girls in Seoul
Seung Eun Lee, Joo Yun Yang, Ji Hyun Lee, Han Wool Kim, Hae Soon Kim, Hye Jin Lee, Ji Young Oh, Yeon Ah Sung
Annals of Pediatric Endocrinology & Metabolism.2013; 18(3): 116. CrossRef - Overview of Noncommunicable Diseases in Korean Children and Adolescents: Focus on Obesity and Its Effect on Metabolic Syndrome
Hye Ah Lee, Hyesook Park
Journal of Preventive Medicine and Public Health.2013; 46(4): 173. CrossRef
 PubReader
 ePub Link
 Cite
Cite

