ABSTRACT
-
Objectives
- This study aimed to identify risk factors associated with coronavirus disease 2019 (COVID-19) mortality in pre-elderly and elderly individuals in Jakarta, Indonesia.
-
Methods
- We employed a case-control study design, utilizing secondary data from the Epidemiology Surveillance, Immunization Prevention, and Disease Control Sections of the DKI Jakarta Provincial Health Office, collected from December 2020 to January 2021. The study included 188 cases and an equal number of controls. Cases were COVID-19 patients confirmed to have died, as reported by hospitals and communities and subsequently verified by healthcare workers. Control subjects were patients who completed a 14-day isolation period and had been officially declared recovered by healthcare professionals. The dependent variable was the mortality of COVID-19 patients in the January 2021 period. The independent variables consisted of demographic data (age and sex), clinical symptoms (cough, runny nose, anosmia, diarrhea, headaches, abdominal pain, muscle pain, and nausea/vomiting), and comorbidities (hypertension, heart disease, and diabetes). Multivariate analysis was conducted using multiple logistic regression.
-
Results
- The multiple logistic regression analysis revealed several factors associated with COVID-19 fatalities in Jakarta: age of 60 years or older (odds ratio [OR], 4.84; 95% CI, 3.00 to 7.80), male (OR, 2.38; 95% CI, 2.41 to 3.68), dyspnea (OR, 3.93; 95% CI, 2.04 to 7.55), anosmia (OR, 0.13; 95% CI, 0.04 to 0.46), and heart disease (OR, 4.38; 95% CI, 1.04 to 18.46).
-
Conclusions
- The control and prevention of COVID-19 among elderly individuals require particular vigilance. When a COVID-19 case is detected within this demographic, prompt treatment and medication administration are crucial to mitigate the presenting symptoms.
-
Keywords: Mortality, COVID-19, Elderly, Aged, Male
GRAPHICAL ABSTRACT
INTRODUCTION
- The World Health Organization (WHO) reported that as of December 16, 2022, there were 647 972 911 COVID-19 cases worldwide, resulting in 6 642 832 deaths [1]. In the same period, Indonesia, a country with a high prevalence and case fatality rate of COVID-19, recorded a total of 6 709 597 confirmed cases and 160 398 deaths from January 3, 2020 to December 19, 2022 [2]. Jakarta is among the provinces in Indonesia with the highest number of COVID-19 cases, with 1 533 019 confirmed cases and 15 881 deaths as of December 18, 2022 [3].
- In most countries, it has been reported that the elderly population suffered the most severe impact from COVID-19 infection [4,5]. Many of these individuals had comorbidities, which exacerbated the severity of their infections [4]. Additional data have suggested that elderly individuals are at a higher risk of contracting COVID-19 [6,7].
- According to the Directorate General of Population and Civil Registration, in 2021, there were 30.16 million elderly individuals in Indonesia, representing 11.01% of the population aged 60 and above [4]. This demographic undoubtedly influenced COVID-19 transmission in the country. A study conducted in Jakarta revealed case fatality rates of 22.0% for individuals aged 50-59, 14.0% for those aged 60-69, and 2.0% for those aged 70 and above. Another study predicted higher COVID-19 transmission rates (around 20.0%) among individuals aged 70 and above, who also experienced a higher level of disease severity compared to other age groups [8].
- Earlier studies showed that while most individuals infected with severe acute respiratory syndrome coronavirus 2 (SARSCoV-2) experienced mild symptoms, approximately 14.0% suffered from more severe conditions, including shortness of breath and hypoxia. Meanwhile, approximately 5.0% of patients fell into the critical category, experiencing septic shock and respiratory failure [9].
- Since COVID-19 was declared a global pandemic, the world has grappled with the disease, particularly in developing countries like Indonesia. From the onset of the outbreak, Indonesia bolstered its national preparedness response by enacting strategies such as contact tracing, early case identification, and mandatory hospital admissions irrespective of disease severity, all with the aim of interrupting the transmission cycle [10]. Nevertheless, the number of cases continued to surge, leading to a significant increase in COVID-19-related deaths in Indonesia.
- Research specifically focusing on the risk factors for COVID-19 mortality among pre-elderly and elderly groups has been limited, particularly in Indonesia. It is essential to conduct research employing a case-control study design to identify predictors of mortality in pre-elderly and elderly COVID-19 patients in Jakarta. This would enable these patients to receive prompt and effective clinical responses. In terms of mortality predictors, this study identified potential risk factors for death among COVID-19 patients, including advanced age, male, presence of comorbidities, and specific clinical symptoms. The identification of these mortality predictors is vital for the prevention and reduction of these risk factors, and for guiding appropriate management of COVID-19 patients.
METHODS
- Data Source
- This study employed a case-control design, utilizing secondary data of COVID-19 positive cases based on polymerase chain reaction (PCR) test results among pre-elderly and elderly groups in the DKI Jakarta area. This data was collected by the Epidemiology Surveillance and Immunization Section of the Prevention and Disease Control of the DKI Jakarta Health Office, Indonesia. The study centered on data from permanent residents of the DKI Jakarta regions (Central Jakarta, South Jakarta, West Jakarta, East Jakarta, and North Jakarta) during the month of January 2021. The sample for this study was drawn from a case group, consisting of individuals aged 45 and older who were diagnosed with COVID-19 and subsequently passed away. The study included 188 cases, supplemented by a control group of COVID-19 patients who were also at least 45 years old but had recovered. All recovered patients had completed at least 14 days of isolation, had relief from symptoms, required no supportive care or additional treatment, and were declared recovered by a physician’s diagnosis. Data regarding deceased patients were obtained from hospital and community reports [11]. The control group also consisted of 188 cases. The case group was chosen using total sampling, while the control group was selected using simple random sampling in Microsoft Excel (Microsoft Corp., Redmond, WA, USA).
Exclusion criteria
- The exclusion criteria for the case group were missing data regarding asymptomatic status and comorbidities, as well as instances where patients shared the same address. For the control group, the exclusion criteria comprised missing data on asymptomatic status and comorbidities, patients sharing the same address, and those who were still undergoing treatment during the month of January 2021 (Figure 1).
Data collection
- Data was collected using the Surveillance Form, distributed to all health facilities in DKI Jakarta, encompassing both government and private hospitals as well as Community Health Centers. Each facility had an appointed supervisory officer responsible for extracting data from patient medical records to fill out the COVID-19 Epidemiological Investigation (EI) form. The completed forms were then submitted to the DKI Jakarta Provincial Health Office for verification and inclusion in the surveillance database. The data collected included the date of disease onset, SARS-CoV-2 PCR testing, hospital admissions, and outcomes (completion of isolation, recovery, or death), along with demographic information (age, occupation, address and sex), symptoms, and comorbidities. Comorbidities were recorded upon hospital admission, guided and observed by clinical staff, either based on clinical assessments or patient reports [7]. Each hospital had an assigned supervisory officer responsible for extracting data from patient medical records to complete the COVID-19 EI form. The EI form contained questions related to the patient’s demographic characteristics and clinical information. The patient’s final status, such as death, recovery, completion of isolation, or ongoing treatment, was also documented.
Dependent
- The dependent variable in this study was mortality due to COVID-19 among the pre-elderly and elderly groups during the period of January 2021.
Independent
- The independent variables in this study included demographic data (sex and age), symptoms (cough, cold/runny nose, headache, myalgia, diarrhea, muscle aches, anosmia, nausea and vomiting, and abdominal pain), and comorbidities (hypertension, heart disease, and diabetes). The age groups were divided according to a previous study [12], which defined pre-elderly as individuals aged 45-59 years and elderly as individuals aged 60 years and above. Information regarding other comorbidities (obesity, renal disease, chronic obstructive pulmonary disease, immunological disorder, malignancy, and liver failure), and other symptoms (pneumonia, diminished sense of taste, and chills) was not included in the analysis due to unavailability of complete data for all patients.
- Statistical Analysis
- Data were input and analyzed using SPSS version 24 (IBM Corp., Armonk, NY, USA). A bivariate analysis was conducted by calculating the number and percentage of each group (case and control groups). The chi-square and Fisher exact statistical tests were employed to investigate the relationship between risk factors and death in COVID-19 patients, with a p-value of <0.05 considered significant. To proceed to the multivariate analysis stage, each variable was selected using a p-value of <0.25 as the cut-off point. Variables that were not included in the multivariate analysis included cough, cold/runny nose, headache, abdominal pain, hypertension, and diabetes. Before these variables were excluded from the model, we examined the multicollinearity of hypertension and heart disease using variance inflation factor (VIF) values. Based on the resulting VIF value of 1.0054, which is less than 10, hypertension and heart disease showed a weak correlation.
- Next, a multivariate analysis was performed. The initial stage involved analyzing all variables meeting the criteria using multiple logistic regression (forward method). Each variable was then re-selected, and if the p-value was <0.05, the variable was retained in the model until a final model was achieved, with all variables having a p-value of <0.05. The final model in the multivariate analysis aimed to predict the risk of death in pre-elderly and elderly COVID-19 patients by determining the risk magnitude of the studied independent variable to understand the effect of the dependent variable. This analysis used odds ratios (ORs) with 95% confidence intervals (CIs), and statistical significance was determined by a p-value <0.05.
- Ethics Statement
- This research underwent ethical review by the Faculty of Public Health at the University of Muhammadiyah Jakarta, and was granted the Certificate of Ethical Eligibility No.10.706.B/KEPK-FKMUMJ/XII/2022.
RESULTS
- The frequency of demographic determinants, symptoms, and comorbidities associated with COVID-19 mortality in preelderly and elderly patients is presented in Table 1. Table 1 shows that more than half of respondents who died were ≥60 years old, and more than half of the respondent who died were male. Respondents who died had more symptoms: cough, nausea/vomiting, myalgia, dyspnea, and abdominal pain. Respondents who died had more comorbidities such as hypertension, diabetes, and heart disease than the control group. Bivariate analysis results also indicated that demographic factors such as age (≥60 years) (OR, 4.47; 95% CI, 2.88 to 6.93) and male sex were risk factors for death in COVID-19 patients (OR, 1.93; 95% CI, 1.28 to 2.93). Clinical symptom variables demonstrated that anosmia (OR, 0.11; 95% CI, 0.03 to 0.37), nausea and vomiting (OR, 2.45; 95% CI, 1.23 to 4.89), and dyspnea (OR, 3.61; 95% CI, 2.02 to 6.46; p<0.001) were significantly associated with COVID-19 deaths in pre-elderly and elderly individuals in Jakarta. An analysis of comorbidity variables also indicated that hypertension (OR, 2.57; 95% CI, 1.26 to 5.22) and heart disease (OR, 4.58; 95% CI, 1.28 to 16.35) were risk factors for COVID-19 mortality in pre-elderly and elderly individuals in DKI Jakarta (Table 2).
- After assessing p-values in the bivariate analysis, we selected variables to be included in the initial multivariate analysis model. Table 2 displays the results of the initial selection for multivariate analysis. Age, sex, dyspnea, and anosmia were associated with COVID-19 deaths in Jakarta. In the first stage, the variables excluded were cold/runny nose (p=0.874) and diabetes (p=0.814). Subsequently, variables with a p-value of >0.05 were removed one by one.
-
Table 3 presents the final multivariate analysis model. The characteristics that remained significantly associated with COVID-19 mortality in Jakarta included being 60 years or older (adjusted odds ratio [aOR], 4.84; 95% CI, 3.00 to 7.80), male (aOR, 2.38; 95% CI, 2.41 to 3.68), dyspnea (aOR, 3.93; 95% CI, 2.04 to 7.55), anosmia (aOR, 0.13; 95% CI, 0.04 to 0.46), and heart disease (aOR, 4.38; 95% CI, 1.04 to 18.46).
-
Table 4 illustrates that the average time between diagnosis/sample received/swab result received and death among the case group was 9 days, with minimum to maximum range of 1-49 days for deceased patients.
DISCUSSION
- This research presents evidence indicating that among pre-elderly and elderly COVID-19 patients diagnosed through laboratory tests in Jakarta, the predictors of COVID-19 included age over 60 years, male sex, and anosmia.
- These findings align with previous studies conducted in Jakarta that established a link between advanced age and COVID-19 mortality [7,13]. One such study suggested that individuals over the age of 70 are more susceptible to COVID-19 infection compared to younger age groups. This study also projected that roughly 349 million people face a high risk of severe COVID-19 symptoms, and about 20% of those over 70 would require hospitalization if infected with SARS-CoV-2 [8]. Factors contributing to the health impact of COVID-19 infection include physiological changes such as aging, which is often accompanied by comorbidities including heart disease, diabetes, and dementia [14].
- Previous studies have also concluded that males are at a higher risk than females [8,15]. A meta-analysis of 3 111 714 global cases reported that male COVID-19 patients were nearly three times more likely to require intensive care unit admission (OR, 2.84; 95% CI, 2.06 to 3.92) and had a higher risk of mortality than female (OR, 1.39; 95% CI, 1.31 to 1.47) [16]. This meta-analysis also determined that male patients with COVID19 had a higher risk of dying compared to females [17]. This pattern was also observed in previous severe acute respiratory syndrome and Middle East respiratory syndrome outbreaks, where males exhibited a higher risk of mortality than females [18].
- Previous research has shown a correlation between anosmia and mortality in COVID-19 patients (p=0.019) [19]. A study conducted in Bali, Indonesia [20] also found a link between anosmia and death in COVID-19 patients. Prior research confirmed a significant association between anosmia and dyspnea and mortality in patients with COVID-19 [21]. Similarly, a study in Australia determined that dyspnea had a significant impact on the clinical course and mortality rate in COVID-19 patients [22].
- Bivariate analysis of symptom variables demonstrated that nausea/vomiting, dyspnea, and anosmia were all significantly associated with mortality in COVID-19 patients (p<0.05). Previous research found a connection between nausea/vomiting and death from COVID-19 [19]. A study carried out in Jakarta also concluded that nausea/vomiting was a risk factor for death from COVID-19 [7].
- In the bivariate analysis, comorbidities such as hypertension and heart disease were identified as risk factors for mortality in COVID-19 patients. Other research also found that elderly patients with hypertension and heart disease were more likely to succumb to COVID-19 [17,19,23]. However, the results concerning the relationship to hypertension remain inconsistent. Previous studies conducted in Marseille, France, and Taif, Saudi Arabia found no correlation between hypertension and heart disease and COVID-19-related deaths in elderly patients [15,24]. Another study concluded that heart disease was a significant predictor of higher COVID-19 mortality [25].
- In this study, symptoms such as cough, cold/runny nose, nausea/vomiting, myalgia, dyspnea, and abdominal pain were more prevalent in patients who died, whereas anosmia, headache, diarrhea, and sore throat were more common in the control groups. A study in Japan also found that individuals experiencing severe disease often exhibited symptoms of coughing and dyspnea [26].
- This study had several limitations. The research design was retrospective, and we used secondary data obtained from routine hospital surveillance, leading to some incomplete or unavailable data, such as information on obesity, tuberculosis-human immunodeficiency virus co-infection, vital signs, radiology and routine laboratory results, as well as disease severity classification upon hospital admission. Furthermore, comorbidity data may have been self-reported by the patients or inconsistently diagnosed. The selection of case and control samples was not evenly distributed across all regions due to incomplete data in certain areas, which may not accurately reflect the mortality rate and risk factors associated with COVID-19 deaths in the broader population. We did not account for COVID-19 variants, which could have impacted symptom presentation. Lastly, there might still be undetected COVID-19 cases, especially those with mild or asymptomatic symptoms from lower socioeconomic backgrounds.
- The conclusion of this study is that old age (≥60 years), male, dyspnea and anosmia, and heart disease are predictive factors for COVID-19-related death among pre-elderly and elderly individuals in Jakarta. These results generally align with the factors associated with COVID-19 deaths in developed countries across North America, Europe, and Asia [7]. Proper case identification and transmission prevention measures for COVID-19 in the elderly are crucial to reduce illness severity and death. Moreover, symptoms such as dyspnea and anosmia also require appropriate treatment.
- In our study, the average duration from sample received to death (mean of 9 days) was shorter than that found in a previous study in Jakarta (11 days) [7], China (18.5 days) [27], and Japan (17 days) [26]. A study in Malaysia reported that more than 90% of COVID-19 cases were mild and had a low fatality rate due to the implementation of early, mandatory hospitalization, regardless of disease state upon diagnosis. Progression to severe disease requiring intensive care typically occurred within five days of admission [26].
Notes
-
CONFLICT OF INTEREST
The authors have no conflicts of interest associated with the material presented in this paper.
-
FUNDING
None.
-
AUTHOR CONTRIBUTIONS
Conceptualization: Febrianti T. Data curation: Febrianti T, Salama N. Formal analysis: Febrianti T. Funding acquisition: None. Methodology: Febrianti T, Salama N. Visualization: Febrianti T, Inggariwati, Oktavia D. Writing – original draft: Febrianti T. Writing – review & editing: Inggariwati, Oktavia D, Salama N, Febrianti T.
ACKNOWLEDGEMENTS
We appreciate the DKI Jakarta Provincial Health Office, Indonesia, for the permission to analyze COVID-19 surveillance data in Jakarta.
Figure. 1.Sampling frame variable and measurements. COVID-19, coronavirus disease 2019.
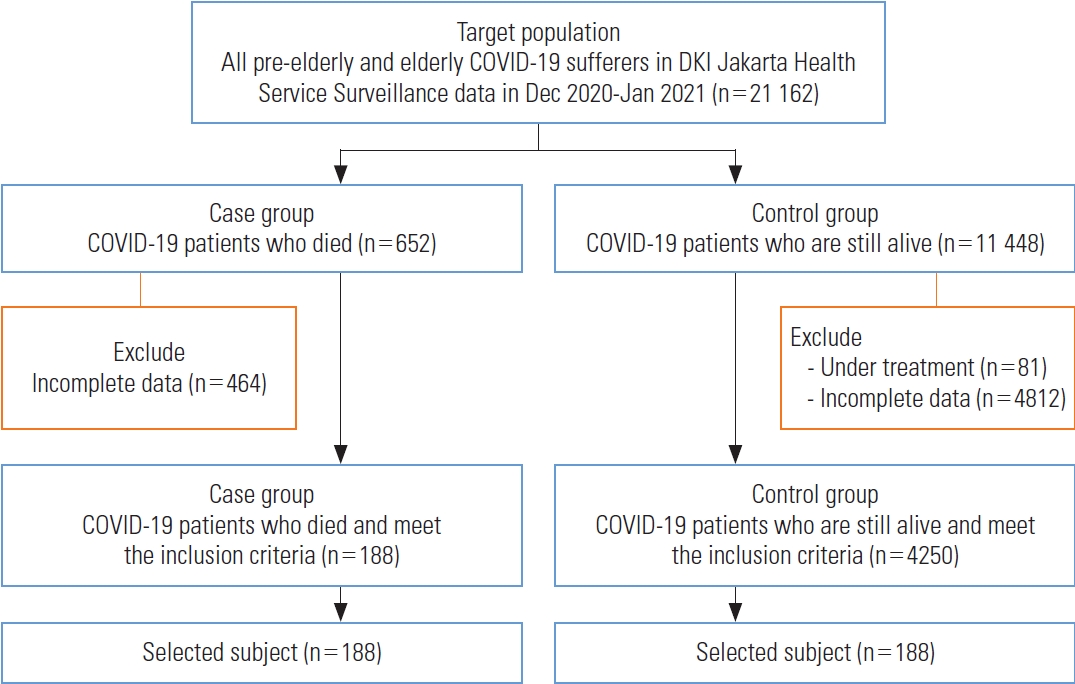
Table 1.Distribution of demographic factors, symptoms, and comorbidities in deaths of pre-elderly and elderly COVID-19 patients in Jakarta, Indonesia
|
Variables |
Case (n = 188) |
Control (n = 188) |
|
Demographic characteristics |
|
|
|
Elderly (≥60 y) |
115 (61.2) |
73 (26.1) |
|
Sex, male |
123 (65.4) |
93 (49.5) |
|
Symptoms |
|
|
|
Cough |
67 (35.6) |
52 (27.7) |
|
Anosmia |
3 (1.6) |
24 (12.8) |
|
Cold/runny nose |
25 (13.3) |
26 (13.8) |
|
Headache |
22 (11.7) |
29 (15.4) |
|
Nausea/vomiting |
29 (15.4) |
13 (6.9) |
|
Myalgia |
21 (11.2) |
14 (7.4) |
|
Dyspnea |
52 (27.7) |
18 (9.6) |
|
Abdominal pain |
8 (4.3) |
4 (2.1) |
|
Diarrhea |
4 (2.1) |
10 (5.3) |
|
Sore throat |
18 (9.6) |
25 (13.3) |
|
Comorbidities |
|
|
|
Hypertension |
28 (14.9) |
12 (6.4) |
|
Diabetes |
18 (9.6) |
11 (5.9) |
|
Heart disease |
13 (6.9) |
3 (1.6) |
Table 2.Multivariate analysis with initial model factors predicting death in pre-elderly and elderly COVID-19 patients in Jakarta, Indonesia
|
Variable |
Bivariate OR (95% CI) |
p-value |
Multivariable aOR (95% CI) |
p-value |
|
Demographic characteristics |
|
|
|
|
|
Elderly (≥60 y) |
4.47 (2.88, 6.93) |
<0.001 |
4.34 (2.65, 7.10) |
<0.001 |
|
Sex, male |
1.93 (1.28, 2.93) |
0.002 |
2.40 (1.46, 3.95) |
0.001 |
|
Symptoms |
|
|
|
|
|
Cough |
1.45 (0.93, 2.24) |
0.096 |
0.80 (0.39, 1.64) |
0.536 |
|
Anosmia |
0.11 (0.03, 0.37) |
<0.001 |
0.11 (0.93, 0.43) |
0.001 |
|
Cold/runny nose |
0.96 (0.53, 1.72) |
1.000 |
0.93 (0.41, 2.14) |
0.874 |
|
Headache |
0.73 (0.40, 1.32) |
0.366 |
0.50 (0.22, 1.17) |
0.110 |
|
Nausea/vomiting |
2.45 (1.23, 4.89) |
0.014 |
2.55 (0.98, 6.64) |
0.055 |
|
Myalgia |
1.56 (0.77, 3.17) |
0.287 |
1.76 (0.64, 4.79) |
0.272 |
|
Dyspnea |
3.61 (2.02, 6.46) |
<0.001 |
4.08 (1.92, 8.70) |
<0.001 |
|
Abdominal pain |
2.04 (0.60, 6.91) |
0.380 |
1.22 (0.26, 5.60) |
0.800 |
|
Diarrhea |
0.39 (0.12, 1.26) |
0.173 |
0.24 (0.05, 1.24) |
0.089 |
|
Comorbidities |
|
|
|
|
|
Hypertension |
2.57 (1.26, 5.22) |
0.012 |
1.28 (0.50, 3.26) |
0.606 |
|
Diabetes |
1.70 (0.78, 3.71) |
0.246 |
1.13 (0.40, 3.22) |
0.814 |
|
Heart disease |
4.58 (1.28, 16.35) |
0.021 |
4.44 (0.96, 20.62) |
0.057 |
Table 3.Multiple logistic regression of variables showing significant relationships with COVID-19 mortality (n=188) vs. controls (n=188)
|
Variables |
Multivariable |
p-value |
|
Elderly (≥60 y) |
4.84 (3.00, 7.80) |
<0.001 |
|
Sex, male |
2.38 (2.41, 3.68) |
<0.001 |
|
Heart disease |
4.38 (1.04, 18.46) |
0.044 |
|
Dyspnea |
3.93 (2.04, 7.55) |
<0.001 |
|
Anosmia |
0.13 (0.04, 0.46) |
0.002 |
Table 4.Average and range of time between diagnosis and death in the case group
|
Variables |
Time (day) |
|
Range (Min-Max) |
1-49 |
|
Mean±SD |
9.16±8.55 |
REFERENCES
- 1. Mirahmadizadeh A, Shamooshaki MT, Dadvar A, Moradian MJ, Aryaie M. Unemployment and COVID-19-related mortality: a historical cohort study of 50,000 COVID-19 patients in Fars, Iran. Epidemiol Health 2022;44: e2022032ArticlePubMedPMC
- 2. COVID-19 Handling Task Force. Distribution data COVID-19. 2022 [cited 2022 Dec 22]. Available from: https://covid19.go.id/ (Indonesian)
- 3. Pemprov DKI Jakarta. COVID-19 monitoring data. 2022 [cited 2022 Dec 22]. Available from: https://corona.jakarta.go.id/id/data-pemantauan
- 4. Alves VP, Casemiro FG, Araujo BG, Lima MA, Oliveira RS, Fernandes FT, et al. Factors associated with mortality among elderly people in the COVID-19 pandemic (SARS-CoV-2): a systematic review and meta-analysis. Int J Environ Res Public Health 2021;18(15):8008ArticlePubMedPMC
- 5. Parohan M, Yaghoubi S, Seraji A, Javanbakht MH, Sarraf P, Djalali M. Risk factors for mortality in patients with coronavirus disease 2019 (COVID-19) infection: a systematic review and meta-analysis of observational studies. Aging Male 2020;23: 1416-1424ArticlePubMed
- 6. Kang SJ, Jung SI. Age-related morbidity and mortality among patients with COVID-19. Infect Chemother 2020;52(2):154-164ArticlePubMedPMCPDF
- 7. Surendra H, Elyazar IR, Djaafara BA, Ekawati LL, Saraswati K, Adrian V, et al. Clinical characteristics and mortality associated with COVID-19 in Jakarta, Indonesia: a hospital-based retrospective cohort study. Lancet Reg Health West Pac 2021;9: 100108ArticlePubMedPMC
- 8. Clark A, Jit M, Warren-Gash C, Guthrie B, Wang HH, Mercer SW, et al. Global, regional, and national estimates of the population at increased risk of severe COVID-19 due to underlying health conditions in 2020: a modelling study. Lancet Glob Health 2020;8(8):e1003-e1017ArticlePubMedPMC
- 9. Wu Z, McGoogan JM. Characteristics of and important lessons from the coronavirus disease 2019 (COVID-19) outbreak in China: summary of a report of 72 314 cases from the Chinese Center for Disease Control and Prevention. JAMA 2020;323: 1239-1242ArticlePubMed
- 10. Ikmal NM, Noor M. Indonesian government policies in handling Covid-19. J Litbang Prov Jawa Tengah 2021;19(2):155-166. (Indonesian)
- 11. Ministry of Health Republic of Indonesia. Circular letter number HK.02.01/MENKES/18/2022 regarding the prevention and control of COVID-19 cases of Omicron (B.1.1.529) [cited 2023 May 24]. Available from: https://upk.kemkes.go.id/new/suratedaran-nomor-hk0201menkes182022-tentang-pencegahandan-pengendalian-kasus-covid-19-varian-omicron--b11529 (Indonesian)
- 12. Ministry of Health Republic of Indonesia. Regulation of the Minister of Health of the number 25 of 2016 concerning the National Action Plan. 2016 [cited 2023 May 24]. Available from: https://peraturan.bpk.go.id/Home/Details/113057/permenkes-no-25-tahun-2016 (Indonesian)
- 13. Rozaliyani A, Savitri AI, Setianingrum F, Shelly TN, Ratnasari V, Kuswindarti R, et al. Factors associated with death in COVID-19 patients in Jakarta, Indonesia: an epidemiological study. Acta Med Indones 2020;52(3):246-254PubMed
- 14. Xu G, Ye M, Zhao J, Liu F, Ma W. New view on older adults with COVID-19: comments on “SARS-CoV-2 and COVID-19 in older adults: what we may expect regarding pathogenesis, immune responses, and outcomes”. Geroscience 2020;42(5):1225-1227ArticlePubMedPMCPDF
- 15. Ly TD, Zanini D, Laforge V, Arlotto S, Gentile S, Mendizabal H, et al. Pattern of SARS-CoV-2 infection among dependant elderly residents living in long-term care facilities in Marseille, France, March-June 2020. Int J Antimicrob Agents 2020;56(6):106219ArticlePubMedPMC
- 16. Peckham H, de Gruijter NM, Raine C, Radziszewska A, Ciurtin C, Wedderburn LR, et al. Male sex identified by global COVID-19 meta-analysis as a risk factor for death and ITU admission. Nat Commun 2020;11(1):6317ArticlePubMedPMCPDF
- 17. Noor FM, Islam MM. Prevalence and associated risk factors of mortality among COVID-19 patients: a meta-analysis. J Community Health 2020;45(6):1270-1282ArticlePubMedPMCPDF
- 18. Hong KH, Choi JP, Hong SH, Lee J, Kwon JS, Kim SM, et al. Predictors of mortality in Middle East respiratory syndrome (MERS). Thorax 2018;73(3):286-289ArticlePubMed
- 19. Khalil K, Agbontaen K, McNally D, Love A, Mandalia S, Banya W, et al. Clinical characteristics and 28-day mortality of medical patients admitted with COVID-19 to a central London teaching hospital. J Infect 2020;81(3):e85-e89ArticlePubMedPMC
- 20. Masyeni S, Nelwan EJ, Fatawy RM, Wibawa S, Nugraha PA, Antara J, et al. Clinical characteristics and outcomes of COVID-19 patients in Bali, Indonesia. PLoS One 2022;17(6):e0269026ArticlePubMedPMC
- 21. Alizadehsani R, Alizadeh Sani Z, Behjati M, Roshanzamir Z, Hussain S, Abedini N, et al. Risk factors prediction, clinical outcomes, and mortality in COVID-19 patients. J Med Virol 2021;93(4):2307-2320ArticlePubMedPDF
- 22. Leung C. Risk factors for predicting mortality in elderly patients with COVID-19: a review of clinical data in China. Mech Ageing Dev 2020;188: 111255ArticlePubMedPMC
- 23. Li X, Xu S, Yu M, Wang K, Tao Y, Zhou Y, et al. Risk factors for severity and mortality in adult COVID-19 inpatients in Wuhan. J Allergy Clin Immunol 2020;146(1):110-118ArticlePubMedPMC
- 24. Bakhshwin D, Alotaibi M, Ali AS, Althomali A, Alsuwat A, Alhamyani A, et al. Mortality predictors among COVID-19 elderly in Taif, Saudi Arabia. Infect Drug Resist 2022;15: 3213-3223ArticlePubMedPMCPDF
- 25. Dubik SD, Ahiable EK, Amegah KE, Manan A, Sampong FB, Boateng J, et al. Risk factors associated with COVID-19 morbidity and mortality at a national tertiary referral treatment centre in Ghana: a retrospective analysis. PAMJ Clin Med 2023. doi: https://doi.org/10.11604/pamj-cm.2023.11.17.35964Article
- 26. Matsunaga N, Hayakawa K, Terada M, Ohtsu H, Asai Y, Tsuzuki S, et al. Clinical epidemiology of hospitalized patients with coronavirus disease 2019 (COVID-19) in Japan: report of the COVID-19 registry Japan. Clin Infect Dis 2021;73(11):e3677-e3689ArticlePubMedPMCPDF
- 27. Yang X, Yu Y, Xu J, Shu H, Xia J, Liu H, et al. Clinical course and outcomes of critically ill patients with SARS-CoV-2 pneumonia in Wuhan, China: a single-centered, retrospective, observational study. Lancet Respir Med 2020;8(5):475-481ArticlePubMedPMC
Citations
Citations to this article as recorded by

- Tuberculosis Coinfection among COVID-19 Patients: Clinical Presentation and Mortality in a Tertiary Lung Hospital in Indonesia
Heni Muflihah, Fajar A. Yulianto, Rina, Edi Sampurno, Astri Ferdiana, Santun B. Rahimah
The International Journal of Mycobacteriology.2024; 13(1): 58. CrossRef

 , Ngabila Salama2

 PubReader
 ePub Link
 Cite
Cite


