
Articles
- Page Path
- HOME > J Prev Med Public Health > Volume 55(4); 2022 > Article
-
Original Article
“Leisure Life Satisfaction:” Will It Have a Beneficial Impact on Depression Among Older Adults in Community Care Settings in Korea? -
Il-Ho Kim1
 , Cheong-Seok Kim2
 -
Journal of Preventive Medicine and Public Health 2022;55(4):398-406.
DOI: https://doi.org/10.3961/jpmph.22.160
Published online: July 7, 2022
1Center for Collaborative Research on Population and Society, Dongguk University, Seoul, Korea
2Department of Sociology and Center for Collaborative Research on Population and Society, Dongguk University, Seoul, Korea
- Corresponding author: Il-Ho Kim, Center for Collaborative Research on Population and Society, Dongguk University, Toegye-ro 36-gil, Jung-gu, Seoul 04626, Korea, E-mail: kihsdh@gmail.com
Copyright © 2022 The Korean Society for Preventive Medicine
This is an Open Access article distributed under the terms of the Creative Commons Attribution Non-Commercial License (https://creativecommons.org/licenses/by-nc/4.0/) which permits unrestricted non-commercial use, distribution, and reproduction in any medium, provided the original work is properly cited.
ABSTRACT
-
Objectives
- While the risk of depression is expected to substantially increase among older adults receiving community care, leisure life satisfaction can be regarded as a key component in enhancing the mental health of those receiving community care. However, it is not yet known whether community care utilization increases the risk of depression, or what role is played by leisure life satisfaction in these settings. This study investigated the relationship between community care utilization and depression, as well as the main effect and the moderating role of leisure life satisfaction on the link between community care utilization and depression among older adults.
-
Methods
- This study, using the 2019 Korean Welfare Panel Survey, conducted multiple regression analysis on data from 4494 elderly people aged 65 years or older.
-
Results
- After controlling for potential covariates, older community care recipients were more likely to report symptoms of depression than those who did not receive community care. Meanwhile, leisure life satisfaction was negatively associated with depression in older adults. The test for interaction between community care utilization and leisure life satisfaction revealed that leisure life satisfaction significantly attenuated the link between depression and community care utilization.
-
Conclusions
- The findings of this study imply that leisure life satisfaction could play a meaningful role in improving the mental health of older adults receiving community care. Welfare policies affecting older adults should consider leisure life satisfaction as an important resource for reducing depression in community care settings.
- Keywords: Community care utilization, Leisure activity, Depression, Older adults
- Depression is a leading cause of disease burden, as well as one of the most common geriatric disorders with a clear relationship to low quality of life among older adults [1]. Since aging may predispose people to somatic and mental disorders such as chronic diseases, dementia, depression, and disability, and to frequent hospital admissions, the prevalence of depression is expected to grow substantially with a rapid rise in the elderly population. According to a recent systematic global review, approximately 13% of elderly adults suffer from major depression [2]. In Korea, the prevalence of depression among older adults aged 65 years and older was estimated at 7.7% for major depression and 10% for subsyndromal depression [3]. While depression in later life is one complex phenomenon among an increasing number of comorbidities, the risk of depression may increase with community care utilization [4]. However, our knowledge of how community care utilization relates to mental health is still limited.
- Community care refers to community-based social services (i.e., home care, home health care, 24-hour care) that are designed to help older adults maintain their independence in the community. Considering the rapidly aging population and the increasing prevalence of chronic diseases among older adults, the Korea Ministry of Health and Welfare implemented customized community care to advance the quality of life for older adults. However, this policy presented challenges because older adults who received community care were at higher risk of depression than the general elderly population [5,6]. Depression among the elderly population appears to be significantly associated with chronic disease, disability, dementia, and/or other comorbidities, since the inability of older adults to meet their basic daily needs creates an additional strain that increases their risk of depression [3]. Adding to the challenges of coping with serious health conditions, other stressors among community care recipients such as role loss, disengagement from social activities, and social isolation may further contribute to depression [5,7]. Recent research on the mental health of older adults has focused not only on their vulnerability to depression, but also on providing appropriate treatment options and intervention strategies [6]. However, it has not yet been confirmed what features of community care utilization increase the risk of depression, and what role leisure life satisfaction plays in helping older adults cope with the stressful aspects of their community care settings.
- We assume that leisure life satisfaction performs a significant role in promoting the psychological health of older adults, particularly among community care recipients. According to leisure activity theory, active participation in leisure activities correlates with leisure life satisfaction and may be a key component in psychological well-being [8,9]. While stressors in community care settings may exacerbate depression, leisure life satisfaction can be a positive predictor of psychological health, which impedes stress-induced psychopathologies. Despite some decline in biological and physiological functioning, the social and psychological needs of competence, autonomy, and relatedness are the same for older adults receiving community care as for adults in middle age. Success in aging refers not only to the maintenance of functional capacity, but also to the continuation of activities and healthy relationships while retaining core values [10]. Thus, leisure life satisfaction, along with the new role of leisure activities in community care, may lead to increased social integration and the development of positive self-concepts that support the mental health of older adults [11]. To our knowledge, however, few studies have investigated whether leisure life satisfaction contributes to psychological well-being in community care settings. Therefore, our study examined whether: (1) community care recipients are more likely than the general older population to experience symptoms of depression; (2) leisure life satisfaction could be negatively associated with depression in older adults; and (3) the relationship between leisure life satisfaction and depression significantly differs between community care recipients and the general older population.
INTRODUCTION
- Data Source
- Data for this study were derived from the 2019 Korean Welfare Panel Survey (KOWEPS), a nationally representative cross-sectional survey conducted in 2018. The KOWEPS was drawn from the total Korean population, aged 15 years and over, who lived in 17 provinces and 243 cities, counties, and districts. The 2019 KOWEPS was designed to provide a probability sample of Korea’s population using a multi-stage cluster random sampling procedure to select respondents. The survey data were collected from February 18 to May 21, 2018, through face-to-face computer-assisted personal interviews. A total of 14 418 individuals, aged 15 years and over, participated in the survey. For this study, we initially selected 4817 older adults aged 65 years or older. After excluding 198 incomplete questionnaires, the final sample included 4494 individuals. Data weights were applied to ensure that the survey results were representative.
- Measures
- Depression was assessed using the short form of the Center for Epidemiological Studies Depression Scale (11-item version CES-D) [12]. This scale measured how often the elderly experienced symptoms of depression during the past week (e.g., “I felt depressed,” “I did not feel like eating,” “my appetite was poor,” “I had trouble keeping my mind on what I was doing”). Participants responded to each item using a 4-point Likert scale from “rarely or at no time” (0) to “most or all of the time” (3). Among the 11 questions, the “I am relatively well” and “I live without complaints” were reverse-coded to calculate a total of 11 questions. The total scores ranged from 0 to 60 and were calculated by multiplying the sum of 11 items on the CES-D scale by 20/11. Cronbach’s alpha of the depression scale for this sample was 0.885.
- Community care was defined as total-assistance or partial-assistance services for older adults provided by public organizations, social welfare institutions, and/or religious and civic groups. In the 2018 survey, respondents were asked whether they had used community services such as (1) free meals (no self-pay), (2) goods support (e.g., food, clothes, furniture), (3) food delivery, (4) home-visit care (e.g., cleaning, laundry, meal preparation), (5) home-visit nursing (nursing, bathing), (6) mobility services, (7) day and night care, and (8) care facility benefits. Respondents who answered “yes” to any of these items were classified as utilizing community care.
- Leisure life satisfaction was measured with 1 item, “How satisfied are you with your leisure life?” on a 5-point Likert scale from “extremely dissatisfied” (1) to “extremely satisfied” (5). We classified extremely satisfied or satisfied as a “yes” response and neutral, dissatisfied, or extremely dissatisfied as a “no” response.
- Demographic factors (age, sex, and marital status), socioeconomic factors (education, household income, living alone, religion), and health conditions (self-rated health, chronic diseases) were considered potential covariates. Age was divided into 5 groups: 65–69 years, 70–74 years, 75–79 years, 80–84 years, and 85 years and over. Marital status had 2 categories: currently married (reference) and currently unmarried (single/widowed/separated/divorced). Education levels were split into elementary school or less, middle school, and high school or more (reference). The equalized household income (total household income/family size0.5) was divided into tertiles. Living alone and religion were categorized as “yes” or “no.” Self-rated health was reported as “good,” “average,” and “poor.” The presence of chronic diseases was categorized as “yes” or “no.”
- Statistical Analysis
- Descriptive statistics were calculated to determine the weighted percentages of the demographic, socioeconomic, and health-related variables according to community care utilization. The chi-square test was used to explore differences in the distribution of all variables according to community care utilization. We calculated scores (mean±standard deviation [SD]) for depression in the categories of self-rated health, chronic diseases, and leisure life satisfaction according to community care utilization. Finally, hierarchical linear regression analysis was used to examine the effect of community care and leisure life satisfaction on symptoms of depression. Variables were entered into a model at each level. In model 1, we entered the control variables (i.e., age, sex, marital status, education, household income, living alone, religion, self-rated health, and chronic diseases) to assess the differences of the covariates in symptoms of depression (reduced model). In models 2 and 3, the reference model was reexamined in expanded models that included community care utilization and leisure life satisfaction. Lastly, model 4 was expanded to include an interaction term between community care utilization and leisure life satisfaction (full model). The moderating effect of leisure life satisfaction on the link between community care utilization and depression was tested using a bootstrap procedure outlined by Hayes [13]. Since the 2019 KOWEPS followed a multi-stage survey design, sampling weights were applied to this study’s multiple regression modeling. Using a multicollinearity test, no multicollinear explanatory variables were found in this sample (variance inflation factor: 1.05–2.66; condition index: <15; tolerance value: >0.20). Several regression diagnostic tests for normality were performed using graphical methods and statistical tests. The diagnostic tests produced reasonable skewness and kurtosis (−0.345 and −0.299, respectively), as well as residual plots. Furthermore, the R2 values (range, 0.211–0.265) suggested that the effect sizes were sufficiently large [14].
- Ethics Statement
- Research involved secondary data analysis of the Korea Welfare Panel Study (2019), which were approved by the Bioethics Committee (approval No. 33 109, Statistics Korea). In addition, they are non-aggregated data which are carefully modified and then reviewed to ensure that no individual is directly or indirectly identified.
METHODS
Symptoms of depression
Community care utilization
Leisure life satisfaction
Potential covariates
- The descriptive characteristics according to community care utilization are presented in Table 1. Among all respondents, 36.1% received community care. Univariate analysis showed that the proportion of community care utilization increased significantly with age, with the lowest utilization among those aged 65–69 years (15.3%) and the highest among those aged 85 years and over (52.1%). Females were more likely to receive community care than males (29.9 vs. 19.5%). Unmarried respondents were more than twice as likely to receive community care than those who were currently married (39.3 vs. 17.6%). Respondents with the lowest education level reported the highest level of community care utilization (36.6%), whereas those with a high school or higher education were less likely to receive community care (12.9%). The lowest-income group represented the highest proportion of community care utilization among 3 income groups (47.9, 30.4, and 12.1%). Those living alone and reporting no religion showed a significantly higher level of community care utilization. Older adults with poor self-rated health were more likely to receive community care than their healthier counterparts. Approximately 89.4% of respondents had at least 1 chronic disease, and respondents living with chronic diseases reported a slightly higher level of community care utilization than those without such diseases (26.2 vs. 20.5%). Respondents with a high degree of leisure life satisfaction were less likely to receive community care (18.6%) than those with a low degree of leisure life satisfaction (32.0%). Meanwhile, respondents receiving community care were more likely than those without such care to report symptoms of depression (p=0.009).
- The means and SDs for scaled depression scores based on self-rated health, chronic diseases, and leisure life satisfaction according to community care utilization are presented in Table 2. Respondents with poor self-rated health and one or more chronic diseases reported a significantly higher risk of depression than their counterparts with good self-rated health or without chronic diseases. However, the absence or presence of chronic diseases showed no significant difference in depression scale scores among those receiving community care (11.41±7.28 vs. 12.11±6.19, respectively). Respondents with high leisure life satisfaction were less likely than their counterparts with low leisure life satisfaction to report symptoms of depression. The depression scale scores were higher among community care recipients than among those who had not received such care.
- As shown in Table 3, the results of the multiple regression models showed variables significantly associated with depression. In terms of demographic and socioeconomic variables, older age was associated with an increased risk of depression, with the highest risk among respondents aged 85 years and over. The following variables were significantly associated with depression: female sex, currently unmarried, junior high school education, and lower income. While religion was associated with a high risk of depression, living alone showed no relationship with depression. Although the “poor” and “fair” self-rated health categories were significantly associated with depression (p<0.001), chronic diseases were not (model 1). After controlling for confounding variables, community care utilization was significantly associated with increased depression scores (B= 2.35, p<0.001, model 2). In model 3, the depression scores were significantly higher for community care recipients (B= 2.12, p<0.001), but significantly lower for those with leisure life satisfaction (B=−3.78, p<0.001). The result of an interaction test between community care utilization and leisure life satisfaction showed that the impact of leisure life satisfaction on depression was more pronounced in community care recipients (B=−2.59, p<0.001, model 4).
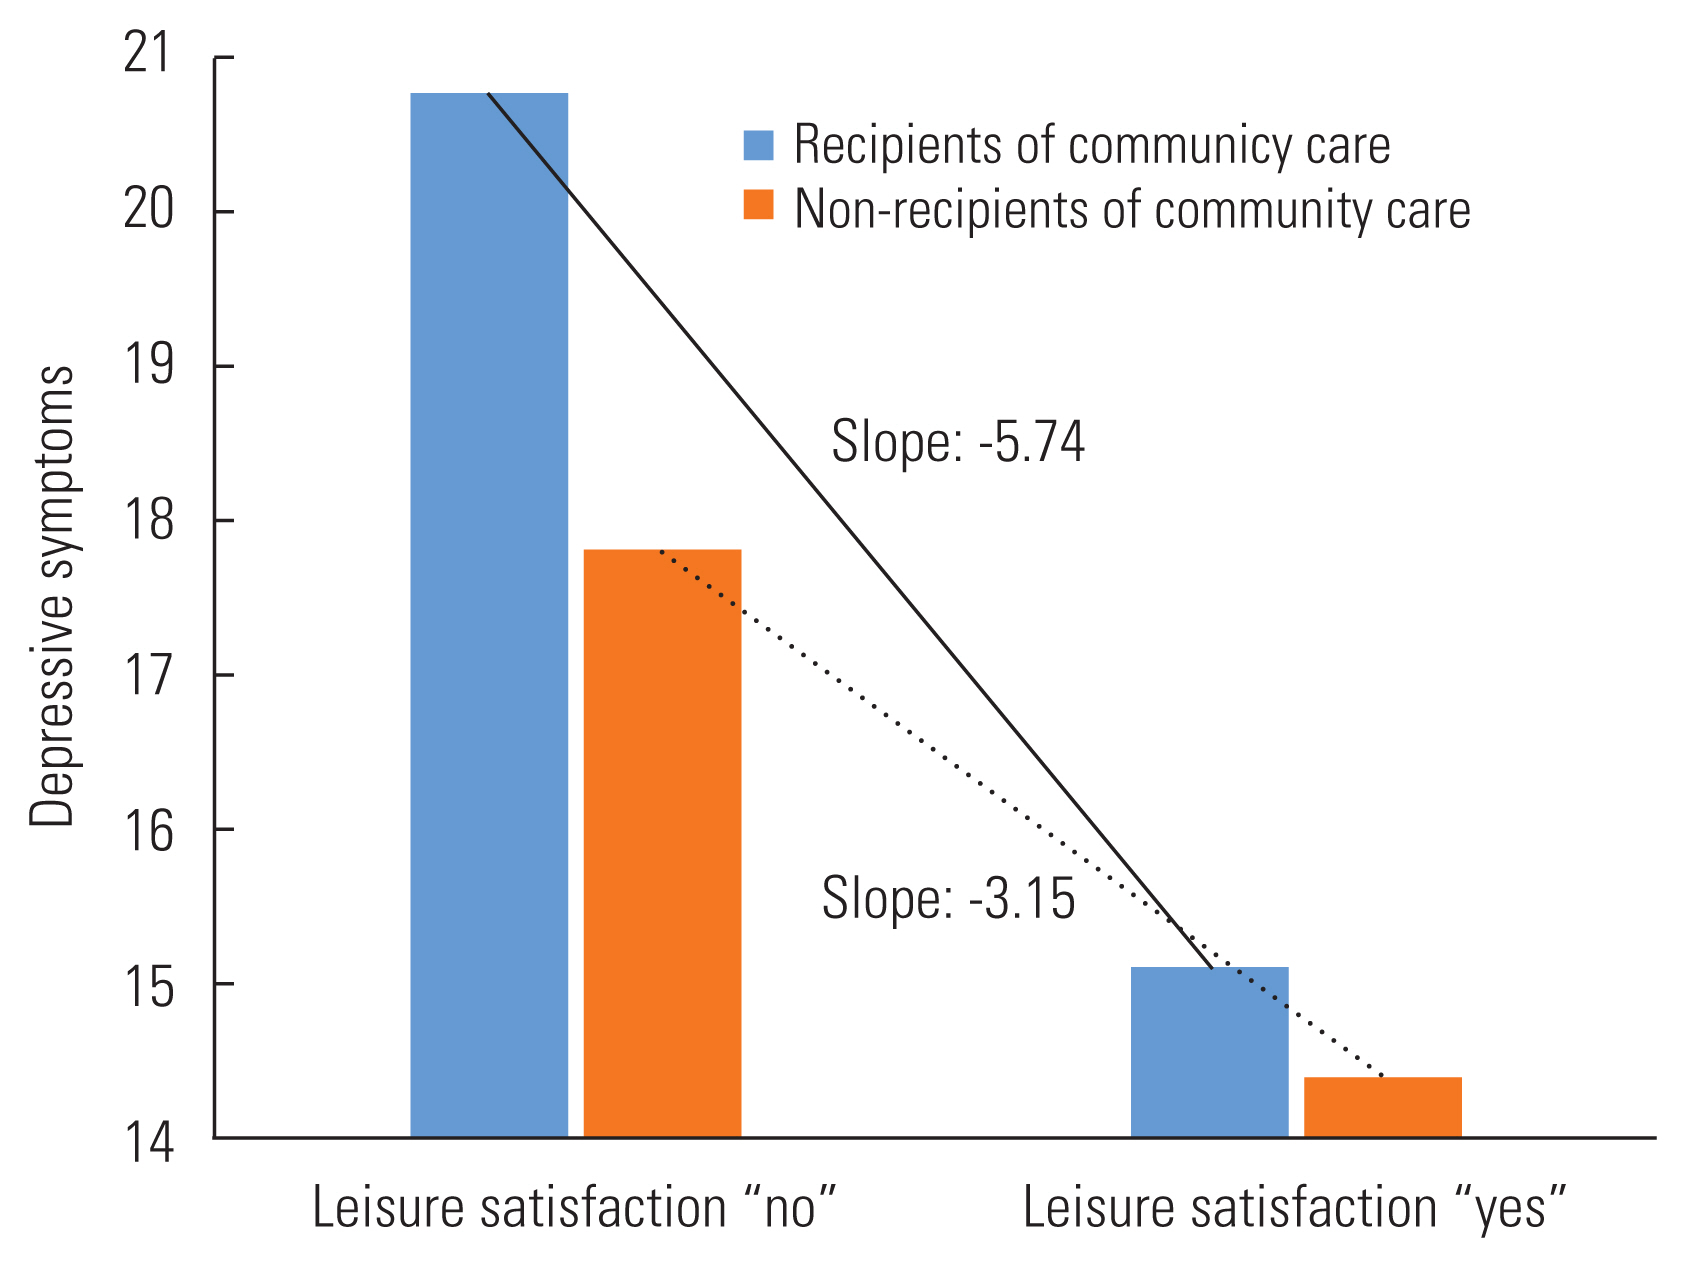
- Figure 1 depicts the moderating effects of leisure life satisfaction on the link between community care utilization and depression. We contrasted elderly community care recipients with those not receiving such care by comparing the slopes of the effect of leisure life satisfaction on depression scores. As shown in Figure 1, leisure life satisfaction significantly attenuated the relationship between depression and community care utilization.
RESULTS
- The primary goal of this study was to examine the relationship between community care utilization and depression among older adults aged 65 years and over. This study also sought to identify the main effect and the moderating effect of leisure life satisfaction on the link between community care utilization and depression among older adults. After analyzing a representative sample of older Korean adults, our results indicated that community care recipients were more likely to suffer from depression than the general elderly population. Conversely, older adults with leisure life satisfaction were less likely than those without such satisfaction to experience depression. In particular, our results revealed that leisure life satisfaction had a substantial moderating effect on the link between community care utilization and depression.
- Our findings confirmed that older community care recipients had a higher risk of depression than non-recipients, which mirrored the research findings of United States longitudinal studies [6,15]. In the United States more than a third of older community care recipients displayed subthreshold depression and 13.4% had major depressive disorder [6]. The prevalence of depression was almost 3 times greater among community care recipients than among non-recipients of community care. A Korean study, based on a convenience sample of 472 older adults, also yielded similar results [16]. The high risk of depression among community care recipients in our study could be explained by a number of factors including medical severity, disability, cognitive impairment, social isolation, and loneliness [6,7,17]. Iwasaki and Mannell [11] proposed that struggles with the physical impairments associated with aging can be a source of stress and depression. Korea’s long-term care insurance policy provides community care for older adults who have difficulty carrying out activities of daily living, due to severe chronic diseases, disabilities, and/or dementia. This study emphasizes the need for intervention programs aimed at reducing depression in community care recipients.
- As shown in other studies, our results demonstrated a reverse relationship between leisure life satisfaction and depression in older adults. Research, including ours, has shown a strong positive relationship between leisure life satisfaction, improved mental health, and subjective well-being in diverse populations such as caregivers, urban populations, middle-aged adults, and athletes [9,18–21]. Multiple studies have indicated that meaningful leisure engagement among older adults is positively associated with leisure satisfaction, which results in subjective well-being [18,22,23]. A critical review of 42 studies on the link between activity and health suggested that individuals engaged in diverse activities reported not only leisure life satisfaction, but also physical and psychological well-being, regardless of sex, age, or marital status [24]. While participation in leisure activities can be a source of personal well-being, leisure life satisfaction also seems to serve as a mechanism for facilitating self-esteem, happiness, and psychological well-being, all of which enhance mental health in later life [25–27].
- An interesting result from this study was that leisure life satisfaction might be far more beneficial for community care recipients than non-recipients, in mitigating depression. The high risk of depression among community care recipients was substantially lower for those with leisure life satisfaction. Although previous studies have yielded inconsistent results among various populations [28–30], the buffering role of leisure life satisfaction in the community care-depression link is evident in Korean community care settings. Furthermore, this result was supported by a Chinese study of older adults living in residential care homes, which suggested the buffering effect of leisure activities on the functional disability-depression link [31]. Recent scientific evidence also suggests that the positive effects of leisure life satisfaction are not restricted to physical and mental health but extend to cognitive health, happiness, life satisfaction, and subjective well-being [19,20,24,32]. In addition to highlighting the positive role of social and leisure activities on the health of the general population, this study offered important evidence supporting the premise that leisure life satisfaction significantly reduces depression in older community care recipients. Promoting leisure life satisfaction is a key intervention strategy for sustaining the psychological well-being of older community care recipients.
- This study had several limitations. First, by employing the cross-sectional design of the 2019 KOWEPS, this study could not determine the causal relationships between leisure life satisfaction and depression. Longitudinal studies are required to demonstrate a causal sequence. Second, leisure life satisfaction was measured by a single item that summarized participation in diverse activity-care services, suggesting a potential limitation in the measure since the leisure life satisfaction scale may reflect distinct influences on mental health among older adults. However, the measurement error might be limited, because research has corroborated the reliability and validity of a single-item measure for life satisfaction [33,34]. Third, future research should examine actual leisure activities among older adults, to better understand which activities influence leisure life satisfaction and enhance health in the community care setting. Despite this study’s shortcomings, our findings provide new evidence that promoting positive leisure experiences is an effective intervention strategy for reducing depression among older community care recipients. Furthermore, because this study utilized the representative sample of the 2019 KOWEPS, our findings can be generalized to the Korean elderly population.
- In conclusion, this study found that community care recipients were more likely to suffer from depression when compared to those without such care and that leisure life satisfaction was a substantially beneficial factor in reducing depression in older adults. Furthermore, our results indicated that leisure life satisfaction attenuated the link between community care utilization and depression. The buffering effects of leisure life satisfaction were most prominent for older community care recipients. These findings suggest that leisure activity provides a positive experience and is a recommended strategy for mental health interventions in community care settings.
DISCUSSION
-
CONFLICT OF INTEREST
The authors have no conflicts of interest associated with the material presented in this paper.
-
FUNDING
This research project was supported by the National Research Foundation (NRF) of Korea (grant No. NRF-2019S1A5C2A0308-1040).
Notes
ACKNOWLEDGEMENTS
-
AUTHOR CONTRIBUTIONS
Both authors contributed equally to conceiving the study, analyzing the data, and writing this paper.
Notes
| Variables | Model 1 | Model 2 | Model 3 | Model 4 |
|---|---|---|---|---|
| Age (Ref: 65–69), y | ||||
| 70–74 | −0.08 (0.33) | −0.11 (0.33) | −0.01 (0.32) | 0.05 (0.32) |
| 75–79 | 0.64 (0.35) | 0.64 (0.36) | 0.59 (0.35) | 0.64 (0.35)* |
| 80–84 | 1.55 (0.36)*** | 1.32 (0.42)** | 1.27 (0.41)** | 1.33 (0.41)** |
| ≥85 | 2.06 (0.50)*** | 1.65 (0.51)** | 1.49 (0.49)** | 1.58 (0.49)** |
|
|
||||
| Sex (Ref: male) | ||||
| Female | 1.51 (0.28)*** | 1.52 (0.28)*** | 1.84 (0.27)*** | 1.84 (0.27)*** |
|
|
||||
| Marital status (Ref: currently married) | ||||
| Currently unmarried | 1.06 (0.42)* | 0.88 (0.41)* | 0.34 (0.41) | 0.30 (0.41) |
|
|
||||
| Education (Ref: ≥high school) | ||||
| Junior high school | −1.22 (0.36)*** | −1.25 (0.36)*** | −1.29 (0.35)*** | −1.22 (0.35)*** |
| Elementary school | 0.10 (0.31) | −0.12 (0.32) | −0.46 (0.31) | −0.35 (0.31) |
|
|
||||
| Income (Ref: high) | ||||
| Middle | 1.44 (0.31)*** | 1.18 (0.30)*** | 0.93 (0.30)** | 0.93 (0.30)** |
| Low | 3.60 (0.36)*** | 3.07 (0.36)*** | 2.49 (0.36)*** | 2.48 (0.35)*** |
|
|
||||
| Living alone (Ref: no) | ||||
| Yes | 0.79 (0.44) | 0.73 (0.44) | 1.28 (0.44)** | 1.28 (0.43)** |
|
|
||||
| Religion (Ref: no) | ||||
| Yes | −0.67 (0.25)** | −0.58 (0.25)* | −0.33 (0.25) | −0.32 (0.24) |
|
|
||||
| Self-rated health (Ref: good) | ||||
| Fair | 1.44 (0.32)*** | 1.39 (0.32)*** | 1.14 (0.37)*** | 1.01 (0.31)** |
| Poor | 6.23 (0.33)*** | 5.94 (0.33)*** | 5.19 (0.39)*** | 5.14 (0.32)*** |
|
|
||||
| Chronic diseases (Ref: no) | ||||
| Yes | 0.30 (0.38) | 0.39 (0.38) | 0.40 (0.37) | 0.44 (0.37) |
|
|
||||
| Community care utilization (Ref: no) | ||||
| Yes | 2.35 (0.31)*** | 2.12 (0.30)*** | 3.14 (0.37)*** | |
|
|
||||
| Leisure life satisfaction (Ref: no) | ||||
| Yes | −3.78 (0.25)*** | −3.15 (0.28)*** | ||
|
|
||||
| Interaction | ||||
| Community care utilization Leisure life satisfaction | −2.59 (0.56)*** | |||
|
|
||||
| DF | 15 | 16 | 17 | 18 |
|
|
||||
| F | 59.57 | 59.30 | 69.24 | 66.18 |
|
|
||||
| aR2 | 0.2110 | 0.2211 | 0.2591 | 0.2653 |
- 1. Sivertsen H, Bj⊘rkl⊘f GH, Engedal K, Selbæk G, Helvik AS. Depression and quality of life in older persons: a review. Dement Geriatr Cogn Disord 2015;40(5–6):311-339ArticlePubMedPDF
- 2. Abdoli N, Salari N, Darvishi N, Jafarpour S, Solaymani M, Mohammadi M, et al. The global prevalence of major depressive disorder (MDD) among the elderly: a systematic review and meta-analysis. Neurosci Biobehav Rev 2022;132: 1067-1073ArticlePubMed
- 3. Oh DJ, Han JW, Bae JB, Kim TH, Kwak KP, Kim BJ, et al. Chronic subsyndromal depression and risk of dementia in older adults. Aust N Z J Psychiatry 2021;55(8):809-816ArticlePubMedPDF
- 4. Pepin R, Leggett A, Sonnega A, Assari S. Depressive symptoms in recipients of home- and community-based services in the United States: are older adults receiving the care they need? Am J Geriatr Psychiatry 2017;25(12):1351-1360ArticlePubMedPMC
- 5. Pickett Y, Raue PJ, Bruce ML. Late-life depression in home healthcare. Aging health 2012;8(3):273-284ArticlePubMedPMC
- 6. Xiang X, Leggett A, Himle JA, Kales HC. Major depression and subthreshold depression among older adults receiving home care. Am J Geriatr Psychiatry 2018;26(9):939-949ArticlePubMedPMC
- 7. Bruce ML, McAvay GJ, Raue PJ, Brown EL, Meyers BS, Keohane DJ, et al. Major depression in elderly home health care patients. Am J Psychiatry 2002;159(8):1367-1374ArticlePubMed
- 8. Ragheb MG, Griffith CA. The contribution of leisure participation and leisure satisfaction to life satisfaction of older persons. J Leis Res 1982;14(4):295-306Article
- 9. Tian HB, Qiu YJ, Lin YQ, Zhou WT, Fan CY. The role of leisure satisfaction in serious leisure and subjective well-being: evidence from Chinese marathon runners. Front Psychol 2020;11: 581908ArticlePubMedPMC
- 10. Havighurst RJ. Personality and patterns of aging. Gerontologist 1968;8(1):20-23ArticlePubMed
- 11. Iwasaki Y, Mannell RC. Hierarchical dimensions of leisure stress coping. Leis Sci 2000;22(3):163-181Article
- 12. Radloff LS. The CES-D scale: a self-report depression scale for research in the general population. Appl Psychol Meas 1977;1(3):385-401
- 13. Hayes AF. Introduction to mediation, moderation, and conditional process analysis: a regression-based approach. 2nd ed. New York: Guilford Press; 2017. p. 419-456
- 14. Cohen J. Statistical power analysis for the behavioral sciences. 2nd ed. Hillsdale: Erlbaum Associates; 1988. p. 413-414
- 15. Weinberger MI, Raue PJ, Meyers BS, Bruce ML. Predictors of new onset depression in medically ill, disabled older adults at 1 year follow-up. Am J Geriatr Psychiatry 2009;17(9):802-809ArticlePubMedPMC
- 16. Lee IJ. The level and correlates of depression in home care elders: focused on comparison with community dwelling elders who do not use home care. Health Soc Welf Rev 2012;32(4):31-65. (Korean)Article
- 17. Cornwell EY, Waite LJ. Social disconnectedness, perceived isolation, and health among older adults. J Health Soc Behav 2009;50(1):31-48ArticlePubMedPMCPDF
- 18. Mausbach BT, Chattillion E, Roepke SK, Ziegler MG, Milic M, von Känel R, et al. A longitudinal analysis of the relations among stress, depressive symptoms, leisure satisfaction, and endothelial function in caregivers. Health Psychol 2012;31(4):433-440ArticlePubMedPMC
- 19. García-Martín MÁ, Gómez-Jacinto L, Martimportugués-Goyenechea C. A structural model of the effects of organized leisure activities on the well-being of elder adults in Spain. Act Adapt Aging 2004;28(3):19-34Article
- 20. Chang PJ, Lin Y, Song R. Leisure satisfaction mediates the relationships between leisure settings, subjective well-being, and depression among middle-aged adults in urban China. Appl Res Qual Life 2019;14(4):1001-1017ArticlePDF
- 21. Yu GB, Kim N. The effects of leisure life satisfaction on subjective wellbeing under the COVID-19 pandemic: the mediating role of stress relief. Sustainability 2021;13(23):13225Article
- 22. Cha YJ. Correlation between leisure activity time and life satisfaction: based on KOSTAT time use survey data. Occup Ther Int 2018;2018: 5154819ArticlePubMedPMCPDF
- 23. Kim J, Byon KK, Kim J. Leisure activities, happiness, life satisfaction, and health perception of older Korean adults. Int J Ment Health Promot 2021;23(2):155-166Article
- 24. Adams KB, Leibbrandt S, Moon H. A critical review of the literature on social and leisure activity and wellbeing in later life. Ageing Soc 2011;31(4):683-712Article
- 25. Kracker J, Kearns K, Kier FJ, Christensen KA. Activity preferences and satisfaction among older adults in a veterans administration long-term care facility. Clin Gerontol 2011;34(2):103-116Article
- 26. Chun S, Lee Y, Kim B, Heo J. The contribution of leisure participation and leisure satisfaction to stress-related growth. Leis Sci 2012;34(5):436-449Article
- 27. Lu L, Argyle M. Leisure satisfaction and happiness as a function of leisure activity. Gaoxiong Yi Xue Ke Xue Za Zhi 1994;10(2):89-96PubMed
- 28. Lifshitz-Vahav H, Shrira A, Bodner E. The reciprocal relationship between participation in leisure activities and cognitive functioning: the moderating effect of self-rated literacy level. Aging Ment Health 2017;21(5):524-531ArticlePubMed
- 29. Carmack CL, Boudreaux E, Amaral-Melendez M, Brantley PJ, de Moor C. Aerobic fitness and leisure physical activity as moderators of the stress-illness relation. Ann Behav Med 1999;21(3):251-257ArticlePubMed
- 30. Caltabiano ML. Main and stress-moderating health benefits of leisure. Soc Leis 1995;18(1):33-51Article
- 31. Ouyang Z, Chong AM, Ng TK, Liu S. Leisure, functional disability and depression among older Chinese living in residential care homes. Aging Ment Health 2015;19(8):723-730ArticlePubMed
- 32. Freire T, Teixeira A. The influence of leisure attitudes and leisure satisfaction on adolescents’ positive functioning: the role of emotion regulation. Front Psychol 2018;9: 1349ArticlePubMedPMC
- 33. Milton K, Bull FC, Bauman A. Reliability and validity testing of a single-item physical activity measure. Br J Sports Med 2011;45(3):203-208ArticlePubMed
- 34. Cheung F, Lucas RE. Assessing the validity of single-item life satisfaction measures: results from three large samples. Qual Life Res 2014;23(10):2809-2818ArticlePubMedPMCPDF
REFERENCES
Figure & Data
References
Citations
- Leisure and Happiness of the Elderly: A Machine Learning Approach
Eui-Jae Kim, Hyun-Wook Kang, Seong-Man Park
Sustainability.2024; 16(7): 2730. CrossRef - Social engagement and subjective health among older adults in South Korea: Evidence from the Korean Longitudinal Study of Aging (2006–2018)
Bo Zhao, Ji Eon Kim, Jiyoung Moon, Eun Woo Nam
SSM - Population Health.2023; 21: 101341. CrossRef - Do the various leisure forms have equal effects on mental health? A longitudinal analysis of self-selected leisure activities
Junyi Bian, Zubing Xiang
Frontiers in Public Health.2023;[Epub] CrossRef - Development of a prediction model for the depression level of the elderly in low-income households: using decision trees, logistic regression, neural networks, and random forest
Kyu-Min Kim, Jae-Hak Kim, Hyun-Sill Rhee, Bo-Young Youn
Scientific Reports.2023;[Epub] CrossRef - The Trajectory of Depressive Symptoms Across Years of Community Care Utilization Among Older Adults: A 14-Year Follow-up Study Using the ‘Korean Welfare Panel Survey’
Il-Ho Kim, Cheong-Seok Kim, Min-Hyeok Jeong
Journal of Preventive Medicine and Public Health.2023; 56(6): 495. CrossRef
 PubReader
 ePub Link
 Cite
Cite

