
Articles
- Page Path
- HOME > J Prev Med Public Health > Volume 54(4); 2021 > Article
-
Original Article
The Effect of an Empowerment Program on the Health-promoting Behaviors of Iranian Women Workers: A Randomized Controlled Trial -
Fatemeh Noori1
 , Zahra Behboodimoghadam2, Shima Haghani3, Shahzad Pashaeypoor1,4
 -
Journal of Preventive Medicine and Public Health 2021;54(4):275-283.
DOI: https://doi.org/10.3961/jpmph.21.088
Published online: June 24, 2021
1Department of Community Health and Geriatric Nursing, School of Nursing and Midwifery, Tehran University of Medical Sciences, Tehran, Iran
2Department of Reproductive Health, School of Nursing and Midwifery, Tehran University of Medical Sciences, Tehran, Iran
3Nursing Care Research Center, Iran University of Medical Sciences, Tehran, Iran
4Community-Based Participatory Research Center, Iranian Institute for Reduction of High-Risk Behaviors, Tehran University of Medical Sciences, Tehran, Iran
- Corresponding author: Shahzad Pashaeypoor Department of Community Health and Geriatric Nursing, School of Nursing and Midwifery, Tehran University of Medical Sciences, Nosrat Street, Tehran 1419733171, Iran E-mail: sh-pashaeipour@tums.ac.ir
Copyright © 2021 The Korean Society for Preventive Medicine
This is an Open Access article distributed under the terms of the Creative Commons Attribution Non-Commercial License (http://creativecommons.org/licenses/by-nc/4.0/) which permits unrestricted non-commercial use, distribution, and reproduction in any medium, provided the original work is properly cited.
ABSTRACT
-
Objectives
- The workplace is an ideal place for encouraging health-promoting behaviors. Therefore, the aim of the present study was to determine the effect of an empowerment program on the health-promoting behaviors of women workers.
-
Methods
- This randomized clinical trial was conducted with 80 women workers employed at a food packaging facility in 2020. The subjects were selected using convenience sampling and were classified into intervention and control groups using block randomization. An empowerment program for women workers was conducted across 6 sessions based on an empowerment model. Data collection tools included a demographic questionnaire and the Health Promoting Lifestyle Profile-II, which participants completed both before the program and 8 weeks after the last session. Data analysis was performed in SPSS version 16 using descriptive analysis and inferential statistics.
-
Results
- There were no significant differences between the 2 groups in various health-promoting behaviors before the program. However, the intervention group’s scores for nutrition (34.92±1.09 vs. 27.87±4.23), physical activity (24.40±2.94 vs. 17.40±5.03), stress management (26.35±2.60 vs. 23.05±4.27), spiritual growth (34.02±3.00 vs. 30.22±5.40), interpersonal relationships (30.82±2.38 vs. 27.60±4.61), and health responsibility (31.60±2.71 vs. 28.22±4.59) were significantly higher than the control group’s 8 weeks after the program had ended. Moreover, there was a significant difference in the total score of health-promoting behaviors for the intervention group compared to the control group (179.00±9.22 vs. 151.42±20.25, p=0.001).
-
Conclusions
- An empowerment program for women workers led to significant improvements in the health-promoting behaviors of the participants. Similar programs can ultimately improve women’s health in the workplace.
- Women make up half of society’s labor force; in addition to their key role in the family, they also play a key role in the workforce [1,2]. Women have various responsibilities pertaining to their different roles, which may jeopardize their health. Women carry an additional burden in many societies since they are often expected to work and earn money to provide for the family economically while also taking care of household tasks and chores [3,4]. Accounting for unpaid household work, women perform 55% of total work globally [5].
- In addition to biological factors, cultural, social, economic, and political factors also affect women’s health. Women are considered a high-risk group due to their various roles in the family and society, physiological changes such as puberty, menstruation, labor, and menopause, their relatively higher risk of poverty, hunger, and malnutrition than men, their intense workloads, and sex discrimination [6-8]. Compared to men, women are more often exposed to conditions that can lead to homelessness, poverty, loneliness, and a lack of insurance coverage. Therefore, women’s healthcare needs are different than men’s [9].
- Employment and the terms of employment are determinants of health status and play a major role in the health status of people and societies from a socioeconomic perspective [10]. Working in certain environments can be associated with risks such as occupational injuries and exposure to diseases. Therefore, it is very important to ensure the health of workers to protect human capital, which is a main factor driving economic growth [1]. An adequate and qualified workforce in the health sector is critical for achieving universal health coverage and the Sustainable Development Goals set by the United Nations. There are more than 59 million health workers globally [11,12].
- Analyses of the determinants of health-promoting behaviors among women workers have shown that, given their roles as mothers and wives in the family and as workers, women face many limitations, including time, location, and financial constraints, when trying to access health services, and their first priority tends to be their families, especially their children. Therefore, routine practice of health-promoting behaviors, including healthy nutrition, regular exercise, screening for breast cancer and cervical cancer, and coping with stress, tends to be very poor in this group, which requires special attention [3,7,13]. An unhealthy lifestyle is one of the main factors that can lead to serious conditions such as heart disease, hypertension, obesity, diabetes, stroke, and cancer, and controlling risk factors would lead to a decrease in the mortality rate [9,14].
- Health-promoting behaviors can potentially prevent the development and progress of chronic diseases, improve quality of life, and decrease the healthcare burden on society, and are therefore of great significance. Health promotion is an international priority and a vital strategy for decreasing inequality in health outcomes and providing primary healthcare services. Health promotion contains 6 domains: nutrition, physical activity (PA), health responsibility, stress management, interpersonal relations, and spiritual growth [15,16]. Since factors related to lifestyle account for 70-80% of deaths in developed countries and 50-60% of deaths in developing countries, and many health problems, including overweight, cancer, smoking, addiction, and cardiovascular disease are related to lifestyle, promoting healthy behaviors and a healthy lifestyle should be considered as main strategies for improving and maintaining public health [17,18].
- The work environment is a promising place for implementing health promotion strategies, screening, and preventive programs. Overlooking one’s healthcare needs is a serious problem, especially among low-income women workers with limited control over resources and restricted access to health services. The majority of chronic diseases are due to unhealthy behaviors, and the work environment is an ideal place for educating people and encouraging healthy behaviors [1,17].
- In line with the Ottawa Charter for Health Promotion (1986), there have been many efforts to address women’s empowerment across the world. In total, 189 countries have committed to gender equality and women’s empowerment [19]. Women’s empowerment is an important and necessary public health objective, and it has been argued that economically empowered women can play an even more active role in family decisions and have better access to health and educational services [20].
- Empowerment programs that focus on awareness, knowledge, motivation, self-esteem, and self-efficacy have been found to improve women’s autonomy and the likelihood of seeking preventive care, which are both necessary for promoting women’s health and improving quality of life [21-23].
- Empowerment models can be a suitable method for promoting women’s health and improving their quality of life. Alhani [24] devised an original empowerment model to improve health promotion and disease prevention. This model has been used to improve the quality of life of patients with chronic diseases, including iron deficiency anemia [25], myocardial infarction [26], diabetes [27], and asthma [28]. The main objective of this model is to empower people to cultivate an understanding of health promotion, and it includes four components: perceiving health threats, solving problems, educational participation, and evaluation [24].
- A lack of information about the health needs of women, a scarcity of relevant studies, a weak relationship between research, management, planning, and service provision, and limited resources and expertise are among the main challenges for the development of women’s health, especially the health of women workers, in Iran [29]. Thus, this study was conducted to examine the effect of an empowerment program on health-promoting behaviors among Iranian women workers.
INTRODUCTION
- This parallel randomized clinical trial was conducted in Sari, Iran, from April 12, 2020 to September 20, 2020, with 80 eligible women who worked in a citrus fruit packaging facility. Iranian women who were full-time workers, did not have any confirmed chronic diseases or psychological disorders, could read and write, and were not pregnant or lactating were included in the study. Potential participants were excluded if they had attended already attended other educational programs or if they missed 2 consecutive sessions. Participants were required to attend educational sessions in sequence since the steps of the empowerment model are sequential by design.
- Sample Size Estimation
- Using a confidence interval of 95%, an explanatory power of 80%, and a threshold of d=0.3 for educational intervention to indicate statistical significance, the required sample size was estimated to be 30 subjects in each group after calculating the following formula:
- It should be noted that, according to a study by Sehhatie et al. [30], standard deviations of 0.4 and 0.5 could be expected for the intervention and control groups, respectively. In addition, the sample size was increased to 40 subjects for each group to account for a potential drop-out rate of 10%.
- Randomization
- After obtaining ethical approval from the ethics committee, a large citrus fruit packaging facility with a high proportion of women workers who were willing to participate in the study was selected from a list of all factories in Sari, Iran. Eligible subjects were then selected according to the inclusion and exclusion criteria and randomly assigned to intervention and control groups using block randomization with a block size of 4 and a ratio of 1:1. The website (https://www.randomization.com) was used to determine random sequences of blocks. For allocation concealment, envelopes were prepared for the whole sample, and each of the randomly generated sequences was written on a card and placed inside an envelope that was then glued shut. At the beginning of participant registration, each participant was given an envelope to open that was used to determine the group to which they were assigned. Allocation concealment was performed by 2 independent persons who were not involved in sampling.
- Data Collection
- The primary outcome in this study was health-promoting behaviors and the secondary outcome was body mass index (BMI). The primary and secondary outcomes were measured at the beginning of the study and 8 weeks after the study had ended.
- Participants were asked to complete a demographic questionnaire that included 14 questions about variables such as age, marital status, their spouse’s age and occupation, their number of children, education level, type of employment, daily working hours, work shifts, number of household members, socioeconomic status of the household, history of chronic diseases, if they were the household head, and home region type.
- The Health-Promoting Lifestyle Profile-II (HPLP-II) measures self-initiated health behaviors that serve to maintain or promote the level of wellness based on Pender’s health promotion model.
- The HPLP-II, which is the revised version of the HPLP, was introduced by Walker et al. [31] to better address the current status of public health. This scale has 52 items in 6 domains: spiritual growth (9 items), health responsibility (9 items), PA (8 items), nutrition (9 items), interpersonal relations (9 items), and stress management (8 items). It uses a 4-point response scale that indicates the frequency with which a respondent engages in each behavior. A score of 1 point indicates ‘never,’ 2 points indicates ‘sometimes,’ 3 points indicates ‘often’, and 4 points indicates ‘routinely.’ The overall score for health-promoting lifestyle and behavioral factors is calculated using the mean score of responses for all 52 items and each subscale (8 to 10 items). The lowest and highest total possible scores are 52 points and 208 points, respectively. Scores for each domain can also be calculated separately and range from 10 points to 40 points for spiritual growth, 9 points to 36 points for health responsibility, interpersonal relations, and nutrition, and 8 points to 32 points for PA and stress management. A high score indicates good health-promoting behavior and a low score indicates poor health-promoting behavior. Walker et al. [31] measured the validity and reliability of the original version of the scale and found a test-retest reliability of 0.93.
- The reliability of the HPLP-II was assessed using Cronbach’s alpha and the test-retest method in this study. The Cronbach’s alpha of the HPLP-II was 0.92 (nutrition, 0.72; PA, 0.88; health responsibility, 0.71; interpersonal relations, 0.88; spiritual growth, 0.73; and stress management, 0.74). The test-retest method also showed a Pearson correlation coefficient of 0.99 for the scale.
- It takes 40-45 minutes to complete the HPLP-II. The participants in both the control and intervention groups completed the questionnaires before the intervention and 8 weeks after the intervention had ended using the self-reporting method. The data from the questionnaires were collected, and the effect of the intervention program on health-promoting behaviors was assessed using statistical analysis.
- Height and weight were measured by one of the researchers using a wall-mounted height meter (Seca-206; Seca, Hamburg, Germany) and digital weight scale (Beurer-PS160; Beurer GmbH, Ulm, Germany) to calculate BMI in kilograms per meter squared.
- Intervention
- The intervention included an educational program based on the empowerment model that encompassed all domains of health promotion collected from credible resources. Baseline (pre-intervention) data were collected to assess the strengths, limitations, and educational needs of the subjects and modify the educational content of the empowerment model accordingly before participants were randomly assigned to groups. An empowerment model was then developed according to the needs and requirements of the study participants and implemented in the intervention group according to the model’s 4 components (perceiving threats, solving problems, educational participation, and evaluation). The educational component of the program included material on nutrition, PA, stress management, spiritual health, interpersonal relations, and health responsibility, according to the model. After receiving approval from experts regarding the content of the educational component, the program was conducted across 6 sessions in 3 weeks (2 sessions per week, each lasting 1 hour). The sessions were held in the nearest health center during working hours. The sessions included lectures, group discussions, question-and-answer sessions, and brochures.
- The HPLP-II was completed for a second time by all subjects 8 weeks after the intervention using the self-reporting method. Questions from subjects in the intervention group were answered via telephone at least twice per week during the study period. The control group did not receive any intervention from the researcher; instead, they received routine onthe-job education, including intermittent group training in the workplace.
- Pre-intervention and post-intervention data were compared between the 2 groups given the research objectives. At the end of the study, booklets containing all of the educational materials were given to subjects in both groups.
- The first step for implementing the empowerment model was to increase women’s awareness of health threats, which also includes their perceptions regarding disease severity and their susceptibility to diseases. Women workers’ increased awareness of health threats, potential exposure to diseases, and complications and outcomes of diseases will improve their knowledge of disease prevention and complications. Therefore, separate educational sessions were held for each of the domains of health-promoting behaviors.
- Several problem-solving methods were introduced during the second phase of the program. The participants were familiarized with the problem-solving process on a practical level and selected the best hypothetical solutions for promoting various health behaviors. Conducting problem-solving exercises with the women and encouraging their participation increased their ability to implement solutions independently and improved their awareness and knowledge of problem-solving, which in turn positively affected their self-esteem and self-efficacy.
- Educational participation was the third stage of the empowerment model. The goal of this stage was to encourage participation in educational programs during training and motivate the participants to take part in activities. Successful engagement in health-promoting behaviors enhanced the women’s feelings of self-efficacy and empowerment and positively affected their self-esteem and motivation. Moreover, they became aware of the potential outcomes of both practicing and ignoring health-promoting behaviors, which resulted in better awareness, autonomy, and internalization of these behaviors.
- The final stage of the empowerment model consisted of evaluating the effectiveness of the course on the health-promoting behaviors of the participants. For this stage, the HPLPII was administered twice to both the intervention and control groups before and after the intervention.
- Statistical Analysis
- Descriptive analysis (frequency distribution tables, mean, and standard deviation) and inferential statistics (chi-square test, Fisher exact test, paired t-test, independent t-test, and analysis of covariance [ANCOVA]) were conducted to test the hypotheses and analyze the data, with p-values of <0.05 considered to indicate statistical significance. SPSS version 16 (SPSS Inc., Chicago, IL, USA) was used for data analysis.
- Blinding
- It was not possible to apply blinding to the researcher and the participants. However, blinding was used for data analysis. The person who performed the statistical analysis was not one of the researchers.
- Ethics Statement
- Approval for the original study was obtained using consent forms made by the researcher, which were completed by all the participants before starting the study, to ensure confidentiality. The participants were told that they would be randomly placed into intervention or control groups, and they completed written informed consent forms before participating in the study.
- Ethical consent was obtained from the Tehran University of Medical Sciences Research Committee (approval No. IR.TUMS. FNM.REC.1396.4396). This study was registered in the Iranian Registry of Clinical Trials (registration code: IRCT2018062804-0269N1).
METHODS
Demographics
Primary outcome (health-promoting behaviors)
Secondary outcome (body mass index)
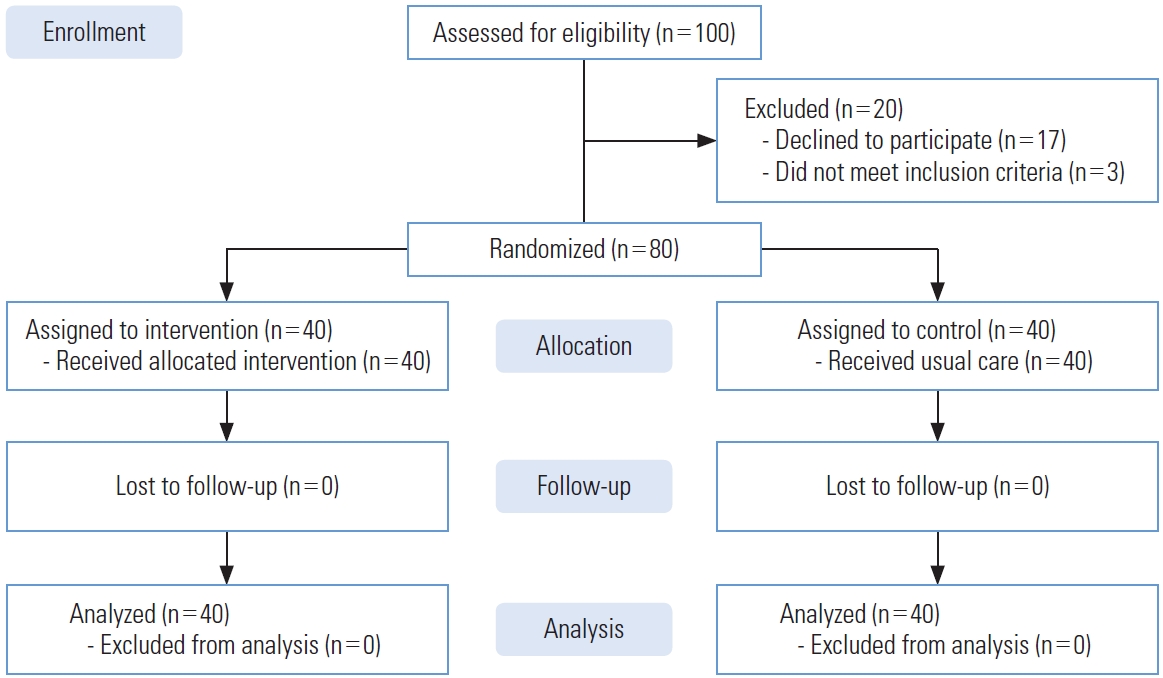
- In total, 100 women workers were eligible to participate in this study, with 17 declining to participate and 3 not meeting the inclusion criteria. Therefore, 80 people who were willing to participate in the study and met the inclusion criteria were selected for the study using convenience sampling. All 80 participants provided informed consent and completed the study (Figure 1). There were no significant differences in age, spouse’s age, marital status, number of children, education level, number of household members, and socioeconomic status between the 2 groups at the beginning of the study (p>0.05) (Table 1). Moreover, the participants in both groups were similar with regard to several other demographic parameters, including employment type (daily-wage employment for both groups), working hours (8-10 hours a day for both groups), shifts (morning and evening shifts for both groups), and home region type (rural areas for both groups). In addition, all subjects were household heads and none of them had chronic diseases.
- In terms of the primary research outcomes, the results showed significant differences between the intervention and control groups in scores for several of the health-promoting behavior domains (nutrition, PA, health responsibility, stress management, interpersonal relations, and spiritual growth) both before and 2 months after the intervention (p=0.001) (Tables 2 and 3). As shown in the tables, the differences between the groups’ mean scores for the PA and stress management domains before the intervention were significant. Therefore, the ANCOVA test was conducted and indicated that the difference between the 2 groups after the intervention remained significant after calculating the difference between mean scores before and after the intervention.
- The secondary research outcome was BMI. The results showed that the intervention group’s mean BMI changed after the intervention, although no statistically significant difference was observed between the 2 groups (Table 4).
RESULTS
- This study was conducted to determine the effect of an empowerment program on the health-promoting behaviors of women workers. The results showed that the women’s empowerment program significantly improved various domains of health-promoting behaviors. However, a more comprehensive educational program than the one administered in this study would be needed to significantly influence BMI. A systematic review study [32] found that few studies addressed the methods of empowerment for adopting healthy behaviors such as a healthy diet. However, our study suggests that empowerment programs can still help people improve healthpromoting behaviors. Several studies have also suggested that interventions based on the empowerment model can improve health-promoting behaviors [22,28,33], which is consistent with the results of the present study. Pender defined healthpromoting behaviors as voluntary daily activities influenced by demographic, environmental, and social factors that markedly affect one’s health condition [34,35]. Therefore, studies that used passive educational methods like lectures and question-and-answer sessions failed to influence changes in behavior. According to the results of this study, it is necessary to engage people so they can plan to practice new health behaviors and encourage active participation to encourage changes in behavior [36,37].
- The present study used an empowerment model and participation to increase the participants’ degree of self-efficacy, and feedback on the educational intervention was provided by participants at the evaluation stage. When people participate in health programs, educational planning is based on, and interventions are optimized for, their health needs in order to make the best use of participants’ time and energy and so that they consider themselves to be a part of the programs, thus also improving their participation and self-esteem [5,19,32]. Evidence suggests that changes in behavior directly correlate with participation, which is a positive finding in favor of health-promoting programs [22,28,33].
- The intervention in the present study did not significantly reduce the participants’ BMIs. This may be due to follow-up with participants having been conducted for only 2 months after the intervention ended, and a longer follow-up time may have resulted in more improvements in this outcome. Some studies have found that educational interventions were not effective at reducing BMI [28,33].
- Empowerment is a nursing intervention based on participants’ genuine expectations for themselves and others. It is a positive concept that addresses participants’ strengths, capabilities, and surrounding environment to identify problems and shortcomings and apply proper interventions. Empowerment is a process that enables the transfer of power from one person to another or between groups by enabling and strengthening individuals [38]. Therefore, the results of this study suggest that interventions aimed at empowering women workers have a clear positive effect on women’s health-promoting behaviors, and the intervention implemented in this study can also be used to empower vulnerable subjects and patients with chronic diseases.
- This study had some limitations. Differences among the participants in motives, interests, and socioeconomic status might have affected their learning outcomes. However, subjects were randomly assigned to the intervention and control groups to minimize the effects of these variables. The participants’ individuals tendencies to give positive or negative answers was another limitation of this study, which was beyond the researchers’ control. We only followed the participants for 2 months after the intervention had ended; therefore, long-term follow-up may produce different results. Nevertheless, since these short-term results yielded promising findings, future studies are needed to determine whether the intervention would have a long-term effect beyond 2 months.
- The empowerment program for women workers conducted in this study corrected unhealthy behaviors, enhanced the adoption and internalization of healthy behaviors, and improved the health status of participants. Therefore, since prevention is generally better than treatment, it is suggested that health policy-makers implement programs that use participation and account for participants’ strengths and weaknesses as an effective method for lifestyle improvement.
DISCUSSION
-
CONFLICT OF INTEREST
The authors have no conflicts of interest associated with the material presented in this paper.
-
FUNDING
All expenses for this study were provided by Tehran University of Medical Sciences, Tehran, Iran.
Notes
ACKNOWLEDGEMENTS
-
AUTHOR CONTRIBUTIONS
Conceptualization: SP, FN. Data curation: FN. Formal analysis: SH. Funding acquisition: FN, ZB, SH, SP. Methodology: SP, ZB. Project administration: FN, ZB, SH, SP. Visualization: SP, ZB. Writing – original draft: FN. Writing – review & editing: SP, FN, ZB, SH.
Notes
| Characteristics | Intervention | Control | p-value |
|---|---|---|---|
| Marital status | |||
| Married | 40 (100) | 39 (97.5) | 0.991 |
| Other | 0 (0.0) | 1 (2.5) | |
| Education level | |||
| Below high school | 22 (55.0) | 25 (62.5) | 0.661 |
| High school | 16 (40.0) | 12 (30.0) | |
| College or higher | 2 (5.0) | 3 (7.5) | |
| No. of children | |||
| None | 0 (0.0) | 3 (7.5) | 0.441 |
| 1-2 | 23 (57.5) | 22 (55.0) | |
| 3-4 | 14 (35.0) | 13 (32.5) | |
| >4 | 3 (7.5) | 2 (5.0) | |
| Family income | |||
| Sufficient | 0 (0.0) | 5 (12.5) | 0.551 |
| Insufficient | 40 (100) | 35 (87.5) | |
| Age (y) | 42.75±11.20 | 40.82±10.01 | 0.422 |
| Age of spouse (y) | 46.05±11.29 | 42.35±10.93 | 0.772 |
| No. of household members | 3.75±0.82 | 3.22±1.07 | 0.172 |
| Health-promoting behaviors | Before | After | p-value1 |
|---|---|---|---|
| Nutrition | |||
| Control | 27.57±4.14 | 27.87±4.23 | 0.310 |
| Intervention | 27.22±3.32 | 34.92±1.09 | 0.001 |
| p-value2 | 0.670 | <0.001 | |
| Physical activity | |||
| Control | 17.40±5.03 | 17.40±5.03 | 0.120 |
| Intervention | 14.92±5.64 | 24.40±2.94 | 0.001 |
| p-value2 | 0.042 | <0.0013 | |
| Interpersonal relations | |||
| Control | 27.37±4.70 | 27.60±4.61 | 0.180 |
| Intervention | 25.40±5.06 | 30.82±2.38 | 0.001 |
| p-value2 | 0.070 | <0.001 | |
| Stress management | |||
| Control | 23.12±4.43 | 23.05±4.27 | 0.470 |
| Intervention | 21.20±4.07 | 26.35±2.60 | 0.001 |
| p-value2 | 0.040 | <0.0013 | |
| Spiritual growth | |||
| Control | 29.87±5.66 | 30.22±5.40 | 0.200 |
| Intervention | 29.40±3.34 | 34.02±3.00 | 0.001 |
| p-value2 | 0.700 | <0.001 | |
| Health responsibility | |||
| Control | 28.12±4.72 | 28.22±4.59 | 0.420 |
| Intervention | 25.07±5.46 | 31.60±2.71 | 0.001 |
| p-value2 | 0.090 | <0.001 | |
| Total | |||
| Control | 150.52±20.20 | 151.42±20.25 | 0.300 |
| Intervention | 140.97±19.20 | 179.00±9.22 | 0.001 |
| p-value2 | 0.030 | <0.0013 |
| Health-promoting behaviors | Intervention | Control | p-value1 |
|---|---|---|---|
| Nutrition | 7.70±3.22 | 0.30±0.60 | 0.001 |
| Physical activity | 9.47±4.29 | 0.00±0.22 | 0.001 |
| Interpersonal relations | 5.42±3.67 | 0.22±0.57 | 0.001 |
| Stress management | 5.15±3.29 | 0.07±0.65 | 0.001 |
| Spiritual growth | 4.62±3.44 | 0.35±0.92 | 0.001 |
| Health responsibility | 6.20±5.18 | 0.85±3.77 | 0.001 |
| Total | 38.02±14.01 | 0.90±1.79 | 0.001 |
| BMI (kg/m2) | Before | After | p-value1 |
|---|---|---|---|
| Intervention | 29.28±2.42 | 27.06±2.36 | 0.12 |
| Control | 28.35±3.02 | 28.15±2.87 |
- 1. Black CM. Working for a healthier tomorrow: Dame Carol Black’s review of the health of Britain’s working age population: presented to the Secretary of State for Health and the Secretary of State for Work and Pensions. 2008 [cited 2021 Jul 8]. Available from: https://assets.publishing.service.gov.uk/government/uploads/system/uploads/attachment_data/file/209782/hwwb-working-for-a-healthier-tomorrow.pdf
- 2. Kachi Y, Inoue M, Nishikitani M, Yano E. Differences in self-rated health by employment contract and household structure among Japanese employees: a nationwide cross-sectional study. J Occup Health 2014;56(5):339-46ArticlePubMed
- 3. Milner A, King T, LaMontagne AD, Bentley R, Kavanagh A. Men’s work, women’s work, and mental health: a longitudinal investigation of the relationship between the gender composition of occupations and mental health. Soc Sci Med 2018;204: 16-22ArticlePubMed
- 4. Vadadahir A, Sadati M, Ahmadi B. Women’s health from the perspective of health magazines in Iran. Women Res 2008;6(2):133-155
- 5. Ghanbari R, Sarooghani B, Darabi F, Bahri N, Abolfathi M. The effect of women’s employment on children’s quality of life. J Res Health 2017;7(3):803-809
- 6. Aagestad C, Tyssen R, Sterud T. Do work-related factors contribute to differences in doctor-certified sick leave? A prospective study comparing women in health and social occupations with women in the general working population. BMC Public Health 2016;16: 235ArticlePubMedPMC
- 7. Frankenhaeuser M, Lundberg U, Chesney M. Women, work, and health: stress and opportunities. Boston: Springer; 2012. p. 1-7
- 8. Han HR, Song Y, Kim M, Hedlin HK, Kim K, Ben Lee H, et al. Breast and cervical cancer screening literacy among Korean American women: a community health worker-led intervention. Am J Public Health 2017;107(1):159-165ArticlePubMedPMC
- 9. Rosenfeld JA. Handbook of women’s health. 2nd ed. Cambridge: Cambridge University Press; 2009. p. 20-25
- 10. Linsley P, Kane R, Owen S. Nursing for public health: promotion, principles and practice. New York: Oxford University Press; 2011. p. 120-122
- 11. Anyangwe SC, Mtonga C. Inequities in the global health workforce: the greatest impediment to health in sub-Saharan Africa. Int J Environ Res Public Health 2007;4(2):93-100ArticlePubMedPMC
- 12. World Health Organization. The world health report 2006: working together for health [cited 2021 Jul 1]. Available from: https://www.who.int/whr/2006/whr06_en.pdf
- 13. Keshavarz Z, Simbar M, Ramezankhani A. Factors influencing the behavior of female-workers in the reproductive age regarding breast and cervical cancer screening based on the integrated model of planned behavior and self-efficacy: a qualitative approach. J Sch Public Health Inst Public Health Res 2011;9(3):23-36. (Persian)
- 14. Adekanle DA, Adeyemi AS, Olowookere SA, Akinleye CA. Health workers’ knowledge on future vascular disease risk in women with pre-eclampsia in south western Nigeria. BMC Res Notes 2015;8: 576ArticlePubMedPMC
- 15. Dugan SA, Lange-Maia B, Karavolos K, Kazlauskaite R, Hollings CS, Avery E, et al. Design of a lifestyle intervention to slow menopause-related progression of intra-abdominal adipose tissue in women: the Women in the Southside Health and Fitness (WISHFIT) study. Contemp Clin Trials Commun 2016;4: 74-83ArticlePubMedPMC
- 16. Wekker V, Huvinen E, van Dammen L, Rono K, Painter RC, Zwinderman AH, et al. Long-term effects of a preconception lifestyle intervention on cardiometabolic health of overweight and obese women. Eur J Public Health 2019;29(2):308-314ArticlePubMed
- 17. Harris JR, Lichiello PA, Hannon PA. Workplace health promotion in Washington State. Prev Chronic Dis 2009;6(1):A29PubMed
- 18. Mo PK, Winnie WM. The influence of health promoting practices on the quality of life of community adults in Hong Kong. Soc Indic Res 2010;95(3):503-517Article
- 19. Kalroozi F, Pishgooie AH, Taheriyan A. Health-promoting behaviours in employed nurses in selected military hospitals. J Health Promot Manag 2015;4(2):7-15. (Persian)
- 20. Woods N. Whose aid? Whose influence? China, emerging donors and the silent revolution in development assistance. Int Aff 2008;84(6):1205-1221Article
- 21. Hempstead B, Green C, Briant KJ, Thompson B, Molina Y. Community empowerment partners (CEPs): a breast health education program for African-American women. J Community Health 2018;43(5):833-841ArticlePubMedPMC
- 22. Masoodi R, Alhani F, Rabiei L, Majdinasab N, Moghaddasi J, Esmaeili SA, et al. The effect of family-centered empowerment model on quality of life and self efficacy of multiple sclerosis patients family care givers. Iran J Nurs Res 2013;7(27):32-43. (Persian)
- 23. Robinson JL, Narasimhan M, Amin A, Morse S, Beres LK, Yeh PT, et al. Interventions to address unequal gender and power relations and improve self-efficacy and empowerment for sexual and reproductive health decision-making for women living with HIV: a systematic review. PLoS One 2017;12(8):e0180699ArticlePubMedPMC
- 24. Alhani F. Design and evaluation of family centered model of empowerment in the prevention of iron deficiency anemic [dissertation]. Tehran: Tarbiat Modarres University; 2004. (Persian)
- 25. Roshan SN, Navipor H, Alhani F. Effect of family-centered empowerment model (FCEM) on quality of life of mothers having teenagers with iron deficiency anemia. J Nurs Educ 2014;3(2):27-40
- 26. Vahedian-Azimi A, Alhani F, Goharimogaddam K, Madani SJ, Naderi A, Hajiesmaeili M. Effect of family-centered empowerment model on the quality of life in patients with myocardial infarction: a clinical trial study. J Nurs Educ 2015;4(11):8-21. (Persian)
- 27. Sadeghi M, Pedram Razi SH, Nikbakht Nasrabadi A, Ebrahimi H, Kazemnejad A. Comparison of the impact of education based on the empowerrment model and family-center empowerrment model on knowledge and metabolic control of patients with type 2 diabetes mellitus. J Nurs Educ 2013;2(3):18-27. (Persian)
- 28. Rajabi R, Sabzevari S, Borhani F, Haghdoost AA, Bazargan N. The effect of family-centered empowerment model on quality of life school age children with asthma. J Health Promot Manag 2013;2(4):7-15. (Persian)
- 29. Ahmadi B, Farzadi F, Alimohammadian M. Women’s health in Iran: issues and challenges. Payesh 2012;11(1):127-137. (Persian)
- 30. Sehhatie F, Mirghafourvand M, Momeni K. Health promoting behaviors among postmenopausal women in Langroud city, Iran. Int J Womens Health Reprod Sci 2015;3(3):158-162. (Persian)Article
- 31. Walker SN, Sechrist KR, Pender NJ. Health promotion modelinstruments to measure health promoting lifestyle: healthpromoting lifestyle profile [HPLP II] (adult version). 1995 [cited 2021 Jul 1]. Available from: https://deepblue.lib.umich.edu/handle/2027.42/85349
- 32. Brandstetter S, Rüter J, Curbach J, Loss J. A systematic review on empowerment for healthy nutrition in health promotion. Public Health Nutr 2015;18(17):3146-3154ArticlePubMedPMC
- 33. Mehta K, Dent C, Middleton G, Booth S. Personal development, wellbeing and empowerment gains for nutrition peer educators: a South Australian perspective. Health Promot Int 2020;35(5):1159-1167ArticlePubMed
- 34. World Health Organization. Physical activity [cited 2021 Apr 1]. Available from: http://www.who.int/topics/physical_activity/en/
- 35. Hosseini M, Yaghmaei F, Hosseinzadeh S, Alavie Majd H, Sarbakhsh P, Tavousi M. Psychometric “health promotion lifestyle profile 2” the urban health center. Payesh 2013;11(6):849-856. (Persian)
- 36. Safabakhsh L, Jahantigh M, Nosratzehi S, Navabi S. The effect of health promoting programs on patient’s life style after coronary artery bypass graft-hospitalized in Shiraz hospitals. Glob J Health Sci 2015;8(5):154-159Article
- 37. Hassani L, Alighias M, Ghanbarnejad A, Shahab-Jahanlu A, Gholamnia-Shirvani Z. Effect of educational intervention on health-promoting behaviors of high school students in Karaj city. J Prev Med 2015;2(1):62-69. (Persian)
- 38. Borghei NS, Taghipour A, Latifnejad Roudsari RL, Keramat A. Development and validation of a new tool to measure Iranian pregnant women’s empowerment. East Mediterr Health J 2015;21(12):897-905Article
REFERENCES
Figure & Data
References
Citations
- Participatory Approaches in the Context of Research Into Workplace Health Promotion to Improve Physical Activity Levels and Reduce Sedentary Behavior Among Office-Based Workers: Scoping Review
Aidan John Buffey, Christina Kate Langley, Brian P Carson, Alan E Donnelly, Jon Salsberg
JMIR Public Health and Surveillance.2024; 10: e50195. CrossRef - Effectiveness of Multicomponent Interventions and Physical Activity in the Workplace to Reduce Obesity: A Systematic Review and Meta-Analysis
M. Rocío Jiménez-Mérida, Manuel Vaquero-Abellán, José M. Alcaide-Leyva, Vanesa Cantón-Habas, Elena Raya-Cano, Manuel Romero-Saldaña
Healthcare.2023; 11(8): 1160. CrossRef
 PubReader
 ePub Link
 Cite
Cite

