Skip Navigation
Skip to contents

JPMPH : Journal of Preventive Medicine and Public Health

OPEN ACCESS
SEARCH
Search

Articles

Page Path
HOME > J Prev Med Public Health > Volume 54(1); 2021 > Article
Original Article
Household Overcrowding in Iran, a Low-middle-income Country: How Major of a Public Health Concern Is It?
Leila Jansar Hosseini1,2orcid, Ali Hussein Samadi3orcid, Abraha Woldemichael4orcid, Masoumeh Najafi Gharebelagh5orcid, Satar Rezaei6orcid, Enayatollah Homaie Rad7orcid
Journal of Preventive Medicine and Public Health 2021;54(1):73-80.
DOI: https://doi.org/10.3961/jpmph.20.568
Published online: January 11, 2021
  • 4,476 Views
  • 124 Download
  • 4 Web of Science
  • 3 Crossref
  • 4 Scopus

1Department of Nursing, Faculty of Nursing and Midwifery, Tehran Medical Sciences, Islamic Azad University, Tehran, Iran

2Guilan Road Trauma Research Center, Guilan University of Medical Sciences, Rasht, Iran

3Department of Economics, Shiraz University, Shiraz, Iran

4School of Public Health, Mekelle University College of Health Sciences, Mekelle, Ethiopia

5Ministry of Health and Medical Education, Tehran, Iran

6Research Center for Environmental Determinants of Health, Health Institute, Kermanshah University of Medical Sciences, Kermanshah, Iran

7Social Determinants of Health Research Center, Guilan University of Medical Sciences, Rasht, Iran

Corresponding author: Enayatollah Homaie Rad, Social Determinants of Health Research Center, Guilan University of Medical Sciences, Emam Street, Rasht 41887-94755, Iran, E-mail: homaierad@gmail.com
• Received: November 18, 2020   • Accepted: December 22, 2020

Copyright © 2021 The Korean Society for Preventive Medicine

This is an Open Access article distributed under the terms of the Creative Commons Attribution Non-Commercial License (https://creativecommons.org/licenses/by-nc/4.0/) which permits unrestricted non-commercial use, distribution, and reproduction in any medium, provided the original work is properly cited.

prev next
  • Objectives
    Household overcrowding (HC) can contribute to both physical and mental disorders among the members of overcrowded households. This study aimed to measure the status of HC and its main determinants across the provinces of Iran.
  • Methods
    Data from 39 864 households from the 2016 Iranian Household Income and Expenditures Survey were used in this study. The Equivalized Crowding Index (ECI) and HC index were applied to measure the overcrowding of households. Regression models were estimated to show the relationships between different variables and the ECI.
  • Results
    The overall, urban, and rural prevalence of HC was 8.2%, 6.3%, and 10.1%, respectively. The highest prevalence of HC was found in Sistan and Baluchestan Province (28.7%), while the lowest was found in Guilan Province (1.8%). The number of men in the household, rural residency, the average age of household members, yearly income, and the household wealth index were identified as the main determinants of the ECI and HC.
  • Conclusions
    The study demonstrated that the ECI and HC were higher in regions near the borders of Iran than in other regions. Therefore, health promotion and empowerment strategies are required to avoid the negative consequences of HC, and screening programs are needed to identify at-risk families.
Household overcrowding (HC) occurs when more than 2 persons in a family share a single bedroom [1,2]. HC corresponds to a density of persons in a given area or space that exceeds its capacity to serve as a shelter and to fulfill other basic services needed throughout the course of a lifetime [3]. Gray identified four categories of definitions of the concept of overcrowding: statistical, research, regulatory, and administrative. The statistical definitions are descriptive and are used to enumerate data. These definitions include occupancy rate and the number of people in each room or bedroom. The research definition should be consistent with its purpose. Housing regulations designed to protect the health or well-being of residents should be standardized. Finally, administrative definitions are part of a rationing process for allocating resources and are regulated by other factors such as income, affordability, and availability of suitable housing [4].
The World Health Organization (WHO) housing and health guidelines [5] show that HC is a global concern. For example, 6% of households in Latin American and Caribbean countries, and 0.4% households in European Union (EU) countries had more than 3 family members living in a single room. In New Zealand [6], about 10% of the total population experienced overcrowding.
Household density is an indicator of poor socioeconomic status and a stressful situation associated with high mortality [7]. Evidence has shown that overcrowding leads to the transmission of infectious respiratory, skin, and intestinal diseases, as well as contributing to many other non-communicable diseases, including psychological problems [8]. For instance, the incidence of tuberculosis is generally associated with HC [1]. Some types of nutritional insecurity, especially among children, are related to high population density [9]. Generally, HC affects various aspects of the lives of children, including their academic performance [10], the social relationships among women and children, the care given to children [4] and mental health [11,12].
Population overcrowding can negatively impact justice in the health service system because it exposes people to infectious diseases [13]. The incidence of contagious diseases, including meningitis and bacterial pneumonia, is very high in areas with a high population density [14]. The risk of further transmission of infectious diseases including gastroenteritis, pneumonia, hepatitis B virus, and respiratory syncytial virus is high in overcrowded households. Furthermore, the risk of acquiring hepatitis A and Helicobacter pylori infections has been found to be associated with HC [8]. Although HC is a complex concept, with its precise meaning varying by place, time, and culture, the number of people living in a room and the size of the room are crucial elements used to calculate indices of HC [15].
There is no specific universal standard for measuring crowding, although quantitative indicators have been developed based on the number of residents and the size of their living area. The Equivalized Crowding Index (ECI), Canadian National Occupancy Standard, and the American Crowding Index are among the commonly used indices. Our previous study used the ECI index to measure HC [14].
Housing quality is likely to influence people’s health. Upgrading housing standards can improve the quality of life of people and reduce the burden of diseases and healthcare costs. However, the status of HC across the provinces of Iran and its determinants are not well known. The purpose of this study was to determine the magnitude and distribution of HC in Iran based on data from 2016. Determining the extent of HC in the different provinces can contribute to identifying healthcare needs and ensuring better access to healthcare services, thereby contributing to the maintenance of the quality of the environment and the reduction of disease incidence and poverty. Furthermore, the findings of the present study are expected to contribute to the reduction of climate change and the achievement of sustainable development goals.
Study Setting
Iran is a low-middle-income country located in the eastern Mediterranean region with an area of 1 648 000 km2. Based on the 2016 census, Iran had approximately 80 million people living in its 31 provinces.
Data, Sampling Method, and Variables
Data from 39 864 households (18 808 residing in urban areas and 19 337 in rural settings), which accounted for 0.18% of the total households in Iran, were used in this study. We retrieved the data for the analysis from the 2016 Household Income and Expenditures Survey conducted by the Iranian Statistical Center (ISC) for all 31 provinces. The unit of analysis was the household. Face-to-face interviews with the households’ heads were conducted to complete the details of the questionnaire concerning the household members’ socio-demographic characteristics, assets, living facilities, food and non-food spending, and income throughout the year. Multistage sampling with geographical stratification was used to select the households in ISC.
In this study, the ECI (a continuous variable) and the prevalence of HC (a binary variable) were the outcome variables, while the place of residence, number of men in a household, the household’s average age, the number of illiterate household members, and annual income were the explanatory variables.
Statistical Analysis
We used principal component analysis (PCA) to construct the wealth index of the households. Variables such as access to television, radio, refrigerator, mobile phone, personal computer, Internet, dishwasher, washing machine, central heating, and cooling systems, electricity, gas, drinking water, sanitation, and a bathroom; home surface area; and type of home structure were used in the PCA. We divided the wealth scores of the study participants into 10 deciles that were ranked from poorest to richest.
The ECI was calculated as follows:
ECI=numberofchildrenlessthan102+numberofcouples+allotherpersonsnumberofrooms
An ECI value of greater than 1 was considered to indicate HC. We calculated the ECI for the urban and rural populations, provinces and counties, and wealth deciles separately. A geographic information system was used to illustrate the crowding index visually.
We used the concentration index to measure the socioeconomic inequality in ECI. The values of the concentration index fall in the range [−1, +1], where negative or positive values indicate a concentration of crowding among worse-off or better-off households, respectively. We used ordinary least square and multiple logistic regression models to examine the associations between the explanatory (residential floor area, number of men in a household, household’s average age, number of illiterate household members, and yearly income) and explained variables (ECI and HC). Excel software (Microsoft Corp., Redmond, WA, USA) was used to perform the descriptive analysis. The regression models and the inequality measures were done using Stata SE version 13.1 (StataCorp., College Station, TX, USA). A p-value of less than 0.05 was considered to indicate statistical significance. Finally, we used ArcGIS version 10.5 (Esri, Redlands, CA, USA) to map the findings.
Ethics Statement
The research design of this study received ethical approval from the deputy of research of Guilan University of Medical Sciences (IR.GUMS.REC.1397.300).
Table 1 shows the magnitude of HC across the provinces of Iran. The overall prevalence of HC in Iran during 2016 was 8.2± 27.5%, while the HC among urban and rural residents were 6.3±24.3% and 10.1±30.2%, respectively. The lowest and highest prevalence rates of HC were found in Guilan Province (1.8±0.4%) and Sistan and Baluchestan Province (28.7±1.2%), respectively.
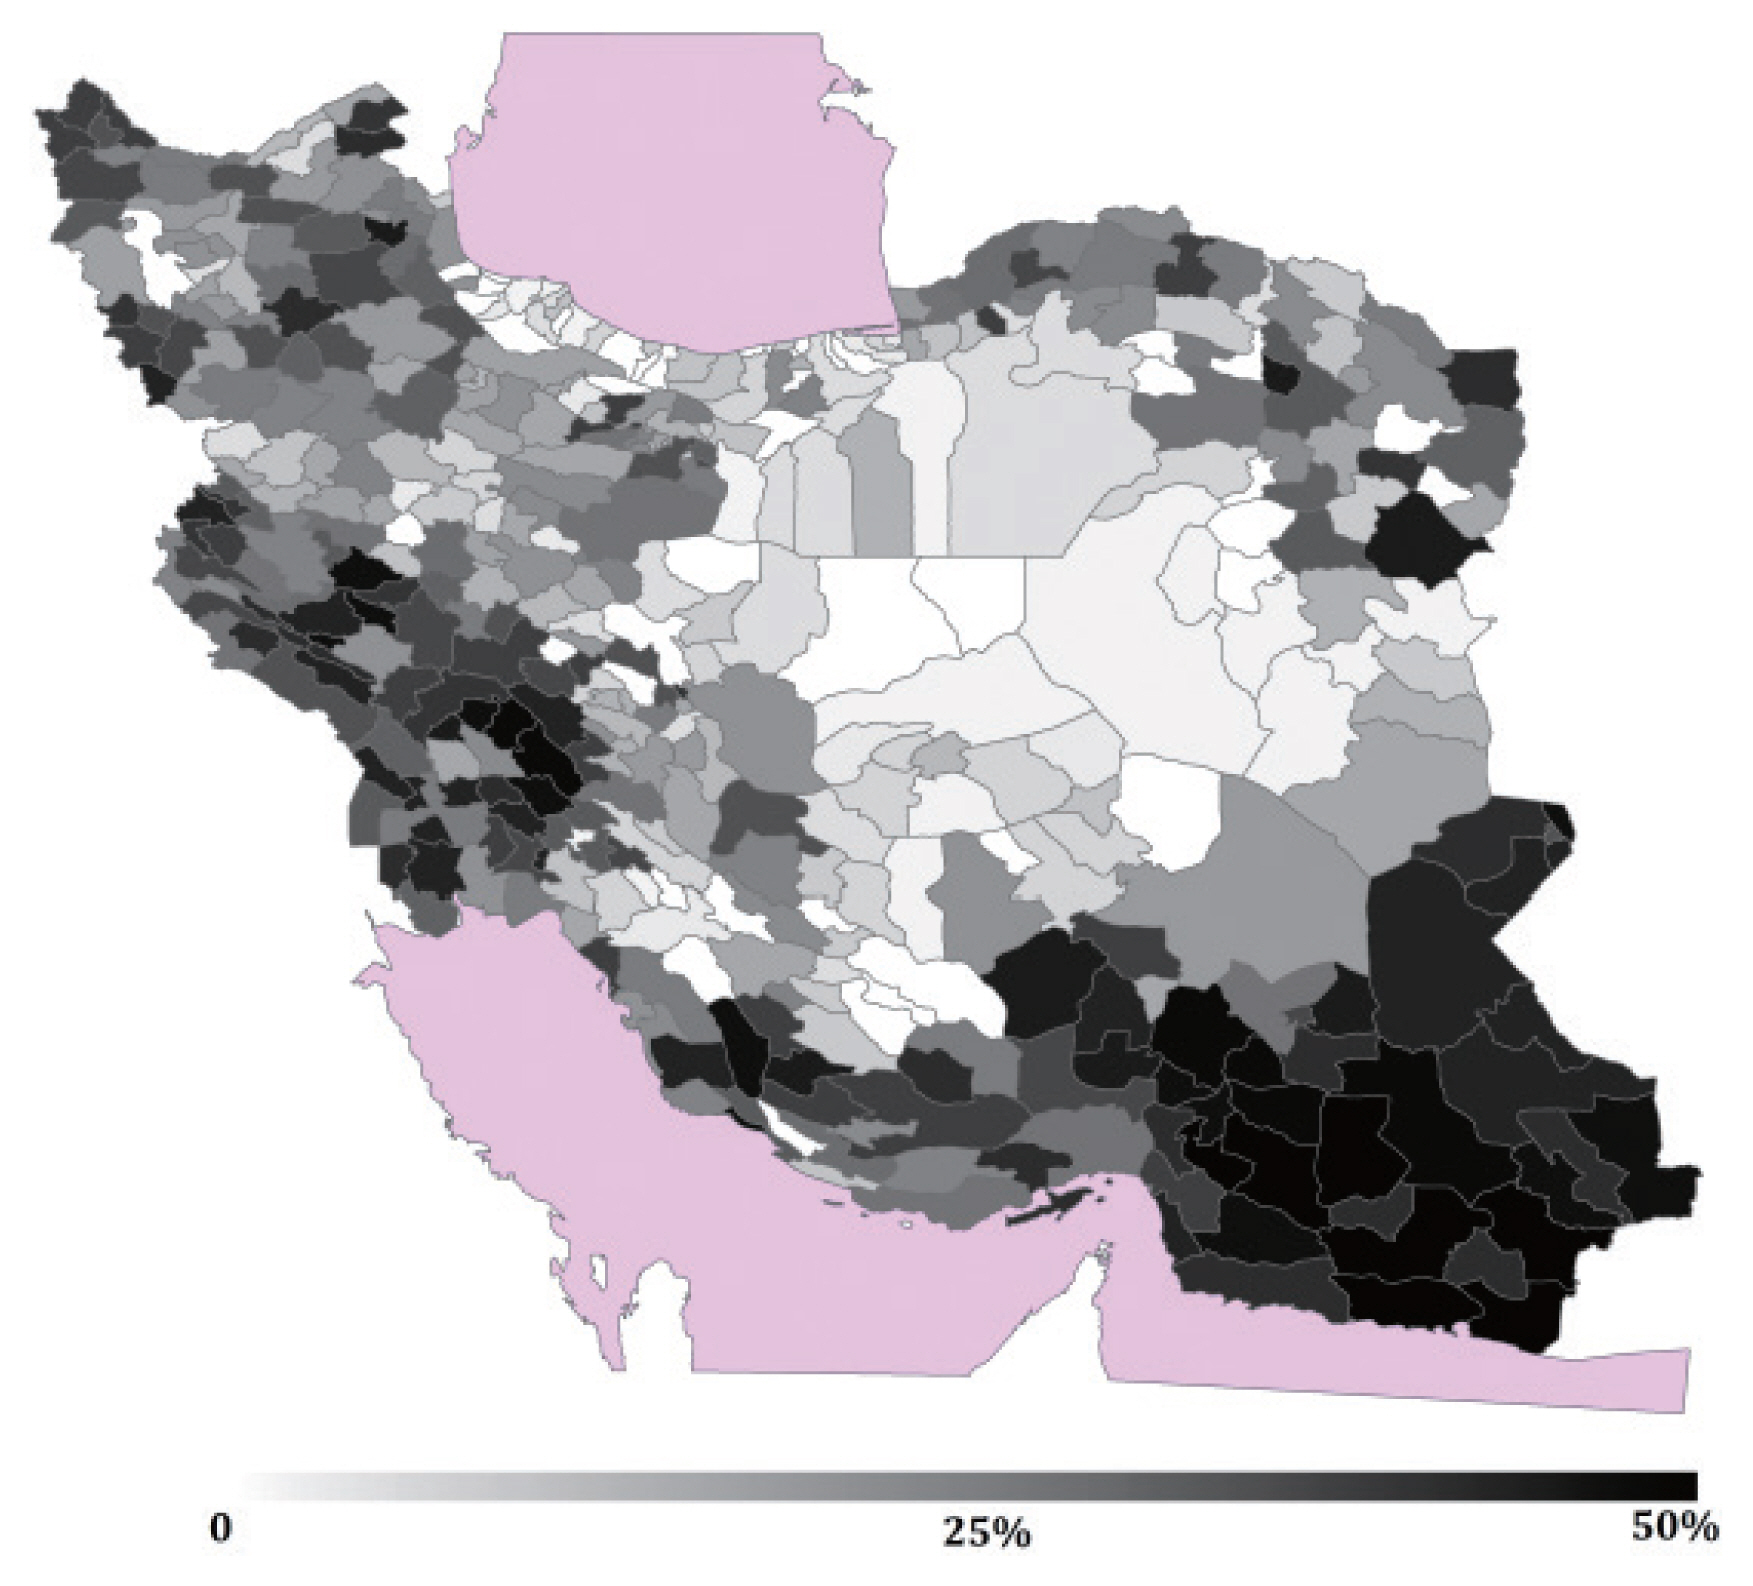
Figure 1 illustrates the prevalence of HC in Iran overall and in the urban and rural counties of Iran. The counties near the southwestern, southern, and western borders of Iran had more HC than the counties in other provinces. Furthermore, the counties located around the coast of the Caspian Sea and near the central desert of Iran faced less HC than the counties in other areas. The HC results for both the urban and rural regions were similar. Nikshahr, a county located in Sistan and Baluchestan, had the highest proportion of HC observed in any of the provinces of Iran.
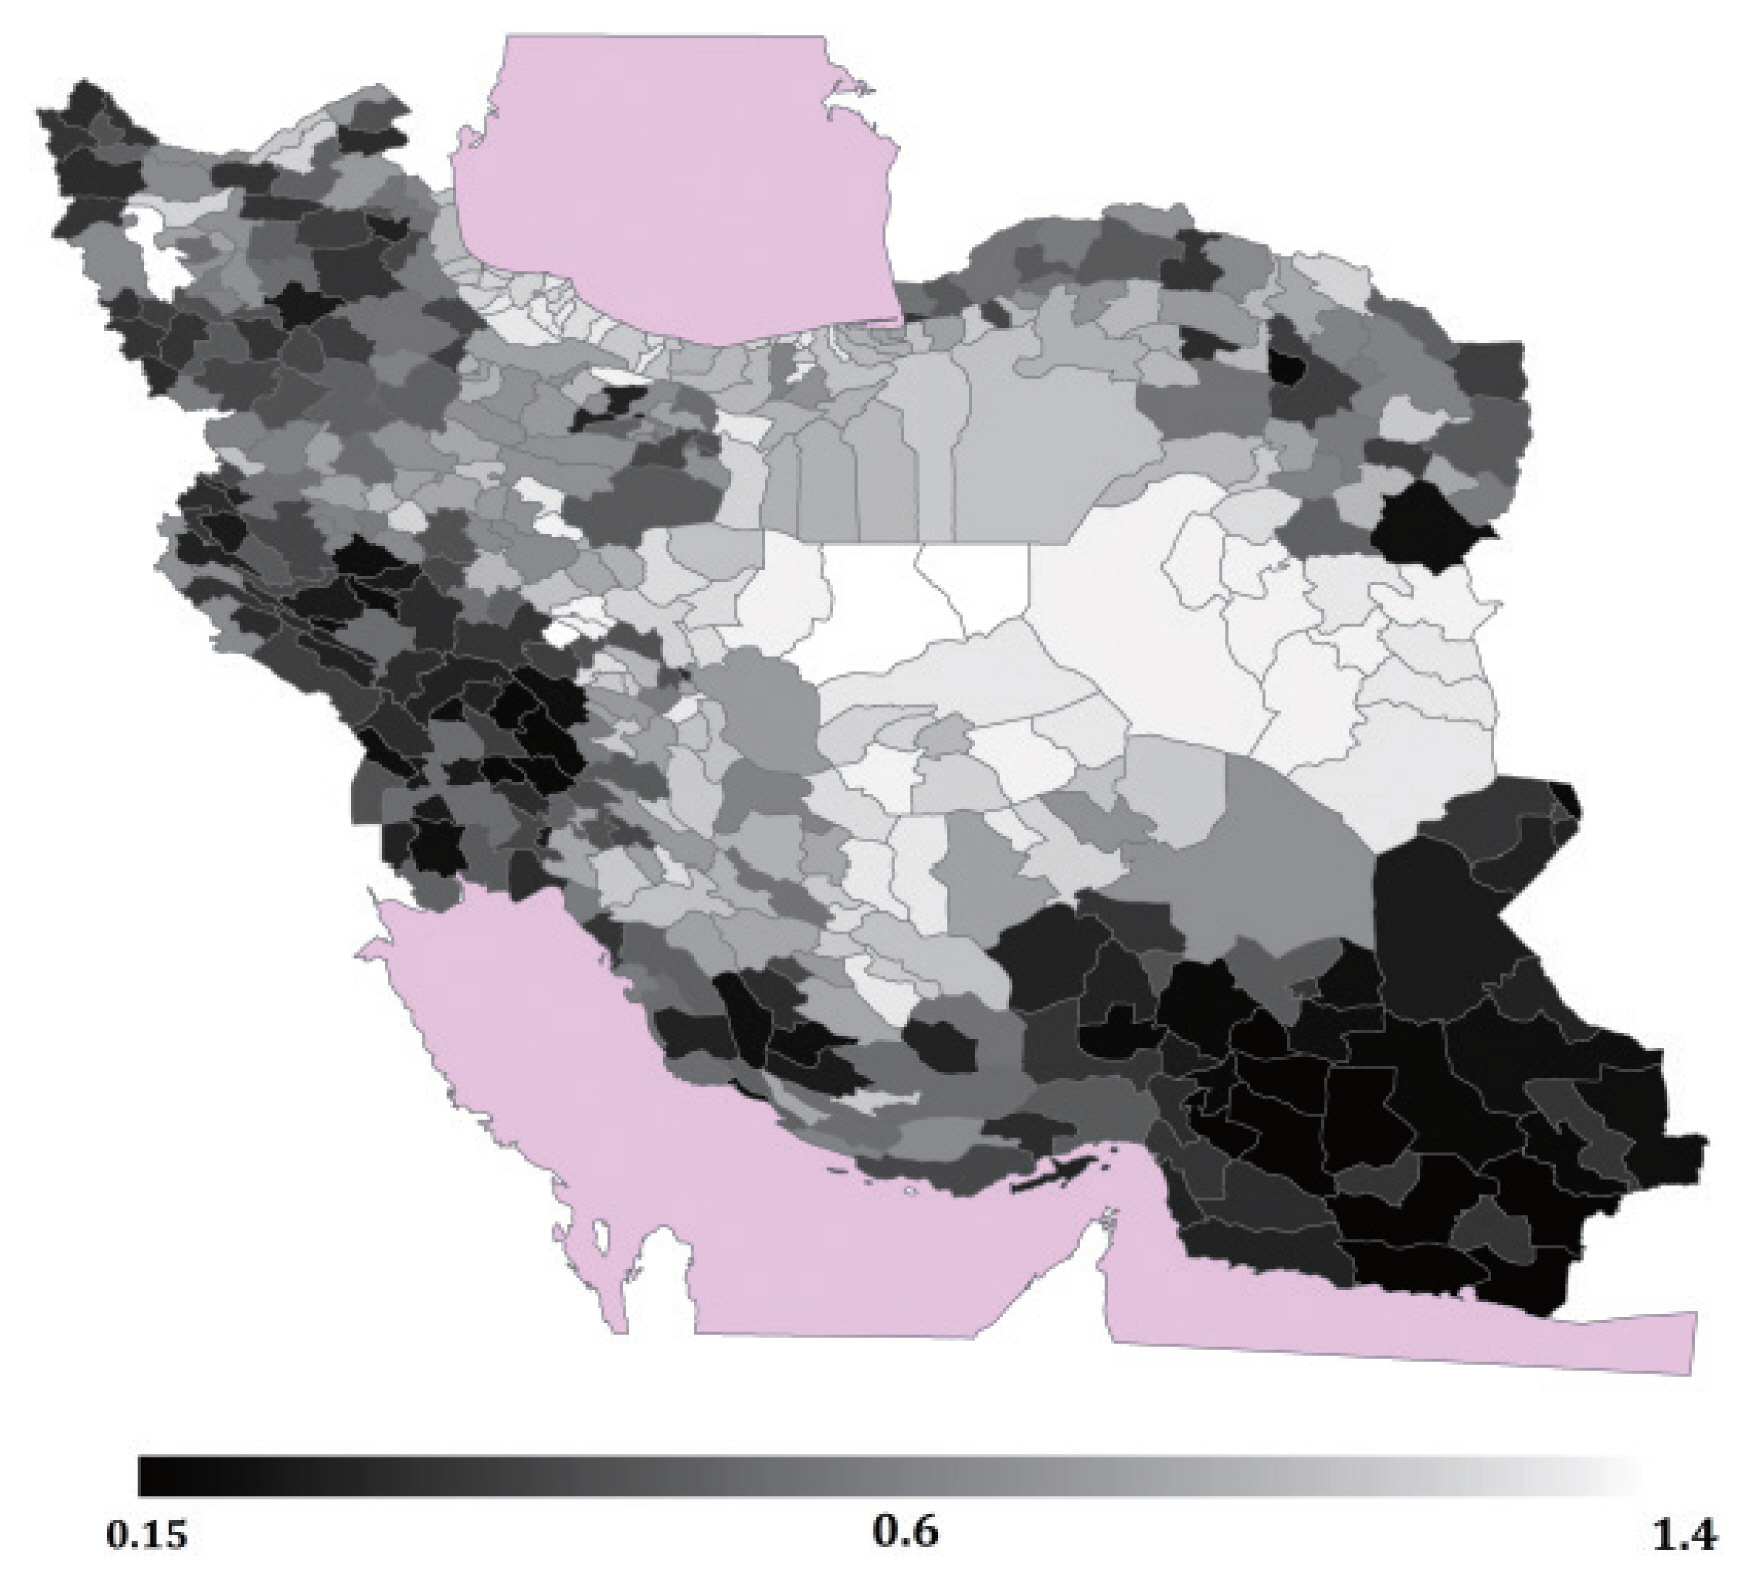
The ECI for the counties is shown in Figure 2. The spatial results were similar to those presented in the HC maps. The highest average ECI value (1.340) was found in Delegan County, which is located in the southwest of Iran, and the lowest ECI (0.152) was found in Khor va Biabanak, a county near the Dasht-e Kavir desert of Iran.
Equivalized Crowding Index and Household Overcrowding in Wealth Deciles
Figure 3 presents the prevalence of HC in different wealth deciles. The highest prevalence of HC was found among households in the first decile (24.3%), followed by the second decile (14.5%), and the lowest prevalence was found in the 10th decile (3.5%). The ECI for the households in the first decile was 0.772, while the ECI for those in the 10th decile was 0.547 (Figure 3).
Concentration Index
The concentration indices and the ECI of HC for the overall population and for urban and rural regions are summarized in Table 2. The concentration indices for the overall population, urban households, and rural households were −0.036, −0.022, and −0.034, respectively. These findings indicated that HC was more prevalent among the poor.
Table 2 presents the relationships between income, number of men in the household, and other explanatory factors of the ECI and HC in Iran in 2016. The number of men in the household, the average age of the household members, the number of illiterate household members, and household size had each a positive and statistically significant relationship with the prevalence of HC and ECI (Supplemental Material 1). Annual income and the wealth index of households also showed indirect and significant associations with the prevalence of HC and ECI.
This study determined the prevalence of HC in Iran and across its provinces in 2016. The findings showed that the prevalence of HC in Iran in 2016 was 8.2% of households. HC was more common in rural households and counties with lower wealth status.
The prevalence of overall HC in Iran (8.2%) was lower than that reported in Ecuador (29.8%) and higher than that presented in the WHO report for households in Latin America and the Caribbean (6.0%), and the EU (0.4%) [5]. However, the prevalence of overcrowding in our study is lower than that reported by studies from New Zealand in 2006 (10.4%), and in 1991 (11.9%) [16]. These discrepancies in the magnitude of overcrowding might be related to several factors, including variation over time and other contextual and socioeconomic factors. Nonetheless, our findings show that a considerable proportion of people are facing an unfavorable situation to meet their basic needs, increasing their risk of suffering from conditions affecting their physical and mental health.
The highest proportion of HC in New Zealand was found in Manukau (22.0%), and the lowest in South Canterbury (3.4%) [6]. Another study in Ecuador, which calculated the overcrowding index based on more than 3 individuals living in a room, reported the prevalence to be 29.8% of the total population. The prevalence of overcrowding in urban and rural settings was 26.6% and 36.0%, respectively [15].
The highest average of ECI in our study was 1.340 for Delegan County, located in the southwest of Iran, and the lowest was 0.152 for Khor va Biabanak County, found near the Dasht-e Kavir desert of Iran. Another study conducted in Iran reported an average household crowding index (HCI) of 1.1 for pregnant women, while 53.0% and 8.6% of persons had HCIs ≥1 and > 2, respectively [7].
The proportions of HC observed among the poorest or first decile (24.3 vs. 15.0%), and the richest or 10th decile (3.5 vs. 2.0%) of the households our study were higher than in the 2013 census-based report from New Zealand [6]. A study in Canada reported 2–3 times more overcrowding in the lower wealth groups of households than in the higher wealth groups of households [17]. However, the extent of overcrowding observed in the lowest decile of the households in our study is likely to lead to physical, psychological, and social problems and therefore requires special attention.
The income of the crowed households in our study was lower than that of uncrowded households, implying a higher proportion of unemployed household members. This condition, in turn, affects household members’ behavior and performance. A prior study reported that the people of Murray, Kentucky and the Pacific had larger household sizes, and were more likely to experience overcrowding [4]. Unlike our findings, other studies reported more crowding among younger households than among older households [17].
Evidence has shown a strong association between literacy and household income [18], with higher literacy levels associated with higher earning. This condition contributes to the decline in HC [19]. Consistently, our finding also indicated less crowding among households that contained members with a higher level of literacy. Nevertheless, a significant difference in income was not found between urban and rural residents. A higher number of men in the household was associated with a higher possibility of overcrowding. Similarly, a higher average age of household members, was associated with more severe HC. Evidence has shown an inverse relationship between HC and income, meaning that more severe HC is associated with lower household income [17]. Generally, low socioeconomic status is related to high HC, and leads to health problems in households. Likewise, our findings indicated a significant relationship between the number of illiterate persons in a household and HC. Household overcrowding is a driver of lower education among family members and a higher level of inequality over the life course [2].
Furthermore, the proportions of overcrowding among urban (6.3 vs. 36.0%), and rural (10.1 vs. 26.6%) households in our study are lower than those reported in Ecuador [15]. The average age of persons in overcrowded households was higher than in less overcrowded households. The high number of illiterate persons in overcrowded families in our study might imply a lack of health literacy, poverty, or other social-cultural conditions. Furthermore, living area had a positive relationship with the magnitude of overcrowding.
In societies with a high prevalence of HC, people experience various challenges including illnesses, food insecurity, and psychological problems [9,11,19,20]. Policies and strategies need to consider the public health implications of issues related to HC. Strategies aiming to provide standard housing to citizens, especially in under-resourced countries, are not feasible both because they are costly and because they compromise other development activities, including efforts to provide access to healthcare services, coverage of health insurance, and subsidies for necessities, empowerment programs for mothers and heads of households, and health promotion strategies. Regularly tracking households for public health concerns such as communicable diseases, environment-related conditions, and psychosocial disorders is critical for designing appropriate policies, strategies, and interventions. Despite their context-specific nature, different strategies focusing on HC can directly or indirectly strive to achieve better health outcomes.
This study provided a comprehensive understanding of the extent of HC in Iran using different measures. However, our findings should be interpreted with caution. First, the analysis utilized secondary data, from which other variables which could have influenced HC are likely to have been omitted. Second, the limited data used in the analysis led to the use of the ECI method of determining HC, although several other methods are available. Third, a cross-sectional study cannot establish a causal relationship between HC and the explanatory variables included in the analysis. Thus, future studies analyzing the health status of households facing overcrowding need to consider these concerns.
The findings of this study indicated a high prevalence of HC across all the provinces in Iran. The prevalence of HC was higher among rural households and those with lower socioeconomic status. Thus, health promotion and empowerment strategies are required to prevent and reduce the negative consequences of HC through the design and implementation of HC screening programs, especially for disadvantaged households.
Supplemental material is available at https://doi.org/10.3961/jpmph.20.568.

CONFLICT OF INTEREST

The authors have no conflicts of interest associated with the material presented in this paper.

FUNDING

The study was funded by the deputy of research, Guilan University of Medical Sciences.

AUTHOR CONTRIBUTIONS

Conceptualization: EHR, LJH. Data curation: LJH, MNG. Formal analysis: EHR, AHS. Funding acquisition: SR, EHR. Methodology: MNG, EHR. Project administration: SR. Visualization: AW, SR. Writing – original draft: EHR, LJH. Writing – review & editing: AW, AHS, SR, MNG.

None.
Figure 1
Prevalence of household overcrowding in Iranian counties.
jpmph-20-568f1.jpg
Figure 2
Average of Equivalized Crowding Index in Iranian counties.
jpmph-20-568f2.jpg
Figure 3
(A) Equivalized Crowding Index (ECI) and (B) prevalence of household overcrowding (HC) in different wealth deciles.
jpmph-20-568f3.jpg
Table 1
Prevalence of HC in provinces of Iran (total, urban population, rural population)
Province Total population Urban population Rural population


Prevalence of HC SD Prevalence of HC SD Prevalence of HC SD
Yazd 0.024 0.004 0.025 0.006 0.023 0.006

Guilan 0.018 0.004 0.009 0.004 0.025 0.006

Mazandaran 0.027 0.005 0.025 0.007 0.028 0.007

Semnan 0.023 0.005 0.017 0.006 0.029 0.008

South Khorasan 0.024 0.004 0.016 0.005 0.030 0.006

Isfahan 0.055 0.006 0.068 0.009 0.042 0.008

Hamedan 0.040 0.006 0.035 0.007 0.045 0.009

Kordestan 0.057 0.008 0.069 0.012 0.046 0.010

Qazvin 0.047 0.007 0.043 0.010 0.049 0.009

Markazi 0.052 0.006 0.052 0.009 0.052 0.008

Fars 0.058 0.006 0.047 0.008 0.067 0.009

Tehran 0.057 0.005 0.051 0.006 0.076 0.012

Golestan 0.070 0.007 0.054 0.009 0.085 0.011

Alborz 0.074 0.008 0.062 0.011 0.085 0.012

Chaharmahal and Bakhtiari 0.074 0.008 0.059 0.011 0.087 0.013

Razavi Khorasan 0.074 0.006 0.057 0.008 0.089 0.010

Qom 0.091 0.009 0.092 0.012 0.090 0.013

Zanjan 0.073 0.008 0.051 0.009 0.099 0.013

Kohgiluyeh and Boyer-Ahmad 0.060 0.007 0.015 0.005 0.101 0.012

North Khorasan 0.079 0.007 0.057 0.009 0.102 0.011

Eastern Azerbaijan 0.067 0.007 0.023 0.006 0.105 0.012

Kermanshah 0.104 0.009 0.083 0.012 0.121 0.012

Western Azerbaijan 0.105 0.009 0.085 0.012 0.123 0.013

Booshehr 0.111 0.009 0.090 0.012 0.133 0.015

Ardebil 0.095 0.009 0.063 0.010 0.135 0.015

Hormozgan 0.129 0.009 0.097 0.012 0.152 0.012

Ilam 0.126 0.010 0.097 0.013 0.153 0.016

Khoozestan 0.141 0.009 0.102 0.012 0.176 0.014

Lorestan 0.141 0.011 0.072 0.012 0.198 0.016

Kerman 0.158 0.010 0.106 0.013 0.203 0.016

Sistan and Baluchestan 0.287 0.012 0.226 0.016 0.345 0.018

HC, household overcrowding; SD, standard deviation.

Table 2
Concentration index of the ECI for the overall, urban, and rural population of Iran, 2016
Variables Observations Index value SE p-value
Overall population 38 145 −0.036 0.002 <0.001
Urban 18 808 −0.022 0.003 <0.001
Rural 19 337 −0.034 0.003 <0.001
F-statistic=9.101, p-value=0.003

ECI, Equivalized Crowding Index; SE, standard error.

Figure & Data

References

    Citations

    Citations to this article as recorded by  
    • Future scenarios of palliative care in health system of Iran: a multi-method study
      Salman Barasteh, Akram Parandeh, Maryam Rassouli, Rohallah Zaboli, Amir Vahedian Azimi, Morteza Khaghanizadeh
      Frontiers in Public Health.2024;[Epub]     CrossRef
    • Social determinants of health and diabetes: Results from a cohort study in Iran
      SeyedJalal Hashemi, Mehrnoosh Jasemzadeh, Nader Saki, Bahman Cheraghian, Sara Sarvandian, Ali Montazeri, Maedeh Raeisizadeh, Marzieh Araban
      Asian Journal of Social Health and Behavior.2023; 6(2): 86.     CrossRef
    • Inadequate housing and pulmonary tuberculosis: a systematic review
      Ju-Yeun Lee, Namhee Kwon, Ga-yeon Goo, Sung-il Cho
      BMC Public Health.2022;[Epub]     CrossRef

    Figure
    • 0
    • 1
    • 2
    Household Overcrowding in Iran, a Low-middle-income Country: How Major of a Public Health Concern Is It?
    Image Image Image
    Figure 1 Prevalence of household overcrowding in Iranian counties.
    Figure 2 Average of Equivalized Crowding Index in Iranian counties.
    Figure 3 (A) Equivalized Crowding Index (ECI) and (B) prevalence of household overcrowding (HC) in different wealth deciles.
    Household Overcrowding in Iran, a Low-middle-income Country: How Major of a Public Health Concern Is It?
    Province Total population Urban population Rural population


    Prevalence of HC SD Prevalence of HC SD Prevalence of HC SD
    Yazd 0.024 0.004 0.025 0.006 0.023 0.006

    Guilan 0.018 0.004 0.009 0.004 0.025 0.006

    Mazandaran 0.027 0.005 0.025 0.007 0.028 0.007

    Semnan 0.023 0.005 0.017 0.006 0.029 0.008

    South Khorasan 0.024 0.004 0.016 0.005 0.030 0.006

    Isfahan 0.055 0.006 0.068 0.009 0.042 0.008

    Hamedan 0.040 0.006 0.035 0.007 0.045 0.009

    Kordestan 0.057 0.008 0.069 0.012 0.046 0.010

    Qazvin 0.047 0.007 0.043 0.010 0.049 0.009

    Markazi 0.052 0.006 0.052 0.009 0.052 0.008

    Fars 0.058 0.006 0.047 0.008 0.067 0.009

    Tehran 0.057 0.005 0.051 0.006 0.076 0.012

    Golestan 0.070 0.007 0.054 0.009 0.085 0.011

    Alborz 0.074 0.008 0.062 0.011 0.085 0.012

    Chaharmahal and Bakhtiari 0.074 0.008 0.059 0.011 0.087 0.013

    Razavi Khorasan 0.074 0.006 0.057 0.008 0.089 0.010

    Qom 0.091 0.009 0.092 0.012 0.090 0.013

    Zanjan 0.073 0.008 0.051 0.009 0.099 0.013

    Kohgiluyeh and Boyer-Ahmad 0.060 0.007 0.015 0.005 0.101 0.012

    North Khorasan 0.079 0.007 0.057 0.009 0.102 0.011

    Eastern Azerbaijan 0.067 0.007 0.023 0.006 0.105 0.012

    Kermanshah 0.104 0.009 0.083 0.012 0.121 0.012

    Western Azerbaijan 0.105 0.009 0.085 0.012 0.123 0.013

    Booshehr 0.111 0.009 0.090 0.012 0.133 0.015

    Ardebil 0.095 0.009 0.063 0.010 0.135 0.015

    Hormozgan 0.129 0.009 0.097 0.012 0.152 0.012

    Ilam 0.126 0.010 0.097 0.013 0.153 0.016

    Khoozestan 0.141 0.009 0.102 0.012 0.176 0.014

    Lorestan 0.141 0.011 0.072 0.012 0.198 0.016

    Kerman 0.158 0.010 0.106 0.013 0.203 0.016

    Sistan and Baluchestan 0.287 0.012 0.226 0.016 0.345 0.018
    Variables Observations Index value SE p-value
    Overall population 38 145 −0.036 0.002 <0.001
    Urban 18 808 −0.022 0.003 <0.001
    Rural 19 337 −0.034 0.003 <0.001
    F-statistic=9.101, p-value=0.003
    Table 1 Prevalence of HC in provinces of Iran (total, urban population, rural population)

    HC, household overcrowding; SD, standard deviation.

    Table 2 Concentration index of the ECI for the overall, urban, and rural population of Iran, 2016

    ECI, Equivalized Crowding Index; SE, standard error.


    JPMPH : Journal of Preventive Medicine and Public Health
    TOP