
Articles
- Page Path
- HOME > J Prev Med Public Health > Volume 53(5); 2020 > Article
-
Original Article
Relationship Between Non-alcoholic Fatty Liver Disease and Decreased Bone Mineral Density: A Retrospective Cohort Study in Korea -
Jisun Sung1
 , Seungho Ryu2, Yun-Mi Song3, Hae-Kwan Cheong1
 -
Journal of Preventive Medicine and Public Health 2020;53(5):342-352.
DOI: https://doi.org/10.3961/jpmph.20.089
Published online: July 17, 2020
1Department of Social and Preventive Medicine, Sungkyunkwan University School of Medicine, Suwon, Korea
2Department of Occupational and Environmental Medicine, Kangbuk Samsung Hospital, Sungkyunkwan University School of Medicine, Seoul, Korea
3Department of Family Medicine, Samsung Medical Center, Sungkyunkwan University School of Medicine, Seoul, Korea
- Corresponding author: Hae-Kwan Cheong, MD, PhD Department of Social and Preventive Medicine, Sungkyunkwan University School of Medicine, 2066 Seobu-ro, Jangan-gu, Suwon 16419, Korea E-mail: hkcheong@skku.edu
Copyright © 2020 The Korean Society for Preventive Medicine
This is an Open Access article distributed under the terms of the Creative Commons Attribution Non-Commercial License (http://creativecommons.org/licenses/by-nc/4.0/) which permits unrestricted non-commercial use, distribution, and reproduction in any medium, provided the original work is properly cited.
ABSTRACT
-
Objectives
- The aim of this retrospective cohort study was to investigate whether non-alcoholic fatty liver disease (NAFLD) was associated with incident bone mineral density (BMD) decrease.
-
Methods
- This study included 4536 subjects with normal BMD at baseline. NAFLD was defined as the presence of fatty liver on abdominal ultrasonography without significant alcohol consumption or other causes. Decreased BMD was defined as a diagnosis of osteopenia, osteoporosis, or BMD below the expected range for the patient’s age based on dual-energy X-ray absorptiometry. Cox proportional hazards models were used to estimate the hazard ratio of incident BMD decrease in subjects with or without NAFLD. Subgroup analyses were conducted according to the relevant factors.
-
Results
- Across 13 354 person-years of total follow-up, decreased BMD was observed in 606 subjects, corresponding to an incidence of 45.4 cases per 1000 person-years (median follow-up duration, 2.1 years). In the model adjusted for age and sex, the hazard ratio was 0.65 (95% confidence interval, 0.51 to 0.82), and statistical significance disappeared after adjustment for body mass index (BMI) and cardiometabolic factors. In the subgroup analyses, NAFLD was associated with a lower risk of incident BMD decrease in females even after adjustment for confounders. The direction of the effect of NAFLD on the risk of BMD decrease changed depending on BMI category and body fat percentage, although the impact was statistically insignificant.
-
Conclusions
- NAFLD had a significant protective effect on BMD in females. However, the effects may vary depending on BMI category or body fat percentage.
- Osteoporosis is a systemic skeletal disorder in which the bones become weak and fragile due to a decrease in bone mass and changes in the microstructure [1]. According to the 2008-2011 Korean National Health and Nutrition Survey, the prevalence of osteoporosis in adults over 50 years old was 22.4% (37.3% in female and 7.5% in male) [2]. In a study based on National Health Insurance claims data, the medical expenses of osteoporosis patients increased by 9.2% annually over that same period and accounted for 16.7% of the national health expenditure [3]. In Korea, the number of osteoporosis patients and the burden of osteoporosis are expected to increase steeply due to the rapid aging of the population [4].
- Obesity is a worldwide health problem, and its prevalence is increasing due to decreased physical activity and excessive caloric intake [5]. The prevalence of obesity in Korean adults increased from 26.0% in 1998 to 31.7% in 2007 and has remained at approximately 31-33% [6]. Obesity increases the risk of chronic diseases such as heart disease, stroke, and diabetes and has a health-damaging effect, but it is known to have a protective effect on osteoporosis [7,8]. However, recent studies have shown that body fat deposition can have a deleterious effect on bone, and visceral fat deposition is particularly detrimental to bone metabolism [9-13].
- Non-alcoholic fatty liver disease (NAFLD) is a metabolic liver disease associated with obesity. NAFLD is becoming increasingly prevalent as obesity becomes more common; in Korea, the prevalence of NAFLD was between 16-33% in the early to late 2000s [14]. NAFLD is closely related to visceral fat deposition and appears to play a role in the pathogenesis of cardiometabolic disease through insulin resistance and chronic systemic inflammation [15,16]. These mechanisms have led to the hypothesis that NAFLD may affect bone metabolism in a similar fashion to visceral fat, and several case-control studies have demonstrated a significant association between NAFLD and low bone mineral density (BMD) in children or adolescents [17]. In contrast, cross-sectional studies in adults have shown sex-dependent results, with a consistent negative association between NAFLD and BMD in males and an inconsistent association in females [18-21]. Recently, 2 Chinese cohort studies reported that NAFLD was a significant risk factor for developing osteoporosis or decreased BMD regardless of sex [22,23]. Chen et al. [22] reported that the risk of developing osteoporosis was 1.35 times higher in the NAFLD cohort of that study than in the control cohort, and Shen et al. [23] reported that the risk of developing low BMD was 2.24 times higher in the NAFLD group than in the non-NAFLD group.
- Most studies conducted so far have been case-control or cross-sectional studies, although recent cohort studies have been reported. The goal of the present retrospective cohort study was to investigate whether NAFLD was associated with a higher risk of incident BMD decrease in Koreans and to identify the modifying effects of relevant factors, including sex, obesity, and menopausal status, using periodic health check-up cohort data from hospitals.
INTRODUCTION
- Study Subjects
- This study included 8824 subjects who underwent abdominal ultrasonography and dual-energy X-ray absorptiometry (DXA) 2 or more times between 2002 and 2015 at Kangbuk Samsung Health Screening Center clinics in Seoul and Suwon. Among them, those who met the exclusion criteria at the first check-up were excluded. The exclusion criteria were as follows: (1) missing data for sex, height, weight, or alcohol consumption (n=1352); (2) history of malignancy (n=276); (3) significant alcohol intake (>210 g/wk for male and >140 g/wk for female) (n=477); (4) positive serological markers for hepatitis B or hepatitis C (n=272); (5) cirrhosis or chronic liver disease on ultrasonography (n=17); (6) diagnosis via DXA of osteoporosis, osteopenia, or BMD below the expected range (n=1885); and (7) current use of osteoporosis medication (n=9). After exclusion, 4536 subjects were included in the analysis.
- Health Questionnaire
- Prior to the health examination, the subjects were asked to complete a health questionnaire on their own. Based on the questionnaire, patients were categorized into 2 groups with regard to smoking status: (1) never or former smokers and (2) current smokers. Alcohol intake, in grams per week, was calculated based on the average frequency of drinking per week and the amount consumed per day. Based on the frequency of vigorous physical activity, patients were similarly categorized into either those who exercised 3 times a week or more or those who exercised fewer than 3 times a week. Via the questionnaire, we asked about the patients’ disease history, including cancer, hypertension, diabetes, dyslipidemia, osteoporosis, and any current medications. Females were also asked about their menopausal status. If answers to menopausal items were missing, females under 55 years were considered premenopausal and females 55 years or older were considered postmenopausal.
- Anthropometric and Biochemical Measurements
- The patients’ height and body weight were measured during the health check-up. Body mass index (BMI, kg/m2) was calculated by dividing the body weight (in kg) by the square of the height (in m2). With regard to BMI, patients were divided into 5 categories according to the Asia-Pacific standard: (1) underweight (BMI<18.5 kg/m2), (2) normal (18.5 kg/m2 ≤BMI≤ 22.9 kg/m2), (3) overweight (23.0 kg/m2 ≤BMI≤24.9 kg/m2), (4) obese (25.0 kg/m2 ≤BMI≤29.9 kg/m2), and (5) severely obese (BMI ≥30.0 kg/m2) [24]. Body fat percentage was calculated by dividing body fat mass, which was measured with a body composition device (Inbody720; Biospace, Seoul, Korea), by body weight. Body fat percentage quartiles were separately obtained for male and female. Blood pressure (BP, mmHg) was measured in the upper arm by skilled nurses or assistant nurses. For this measurement, after the subject had rested for more than 5 minutes, the BP was assessed with the subject seated on a chair and the arm at the level of the heart (53 000-E2; Welch Allyn, New York, NY, USA).
- All biochemical tests were performed after at least 8 hours of fasting. Serum glucose was measured using the hexokinase ultraviolet method. Insulin was measured via immunoassay or radioimmunoassay. The homeostatic model assessment for insulin resistance (HOMA-IR) was calculated using the formula HOMA-IR=fasting insulin (μU/mL)×fasting blood glucose (mg/dL)/405. In this study, insulin resistance was determined based on a HOMA-IR cut-off value of 2.5. Serum high-sensitivity C-reactive protein (hsCRP) levels were measured via turbidimetric immunoassay. Patients were divided into 3 categories based on the median hsCRP level of 0.04 mg/dL: (1) hsCRP <0.04 mg/dL, (2) hsCRP ≥0.04 mg/dL, and (3) missing.
- Ultrasonography and Definition of Non-alcoholic Fatty Liver Disease
- Fatty liver was diagnosed using abdominal ultrasonography. This condition was diagnosed when the liver echogenicity was greater than the echogenicity of the kidney or spleen. It was diagnosed as mild, moderate, or severe according to the magnitude of echogenicity increase and the degree of visualization of the diaphragm or blood vessels. The kappa statistic for evaluating the inter-observer agreement for the diagnosis of fatty liver was 0.74, which indicated intermediate to good agreement. The kappa statistic for evaluating the intra-observer agreement was 0.94, indicating excellent agreement [25]. NAFLD was diagnosed when evidence of hepatic steatosis was found via either imaging or histology and no potential causes of secondary hepatic fat accumulation (such as significant alcohol intake, the use of steatogenic medications, or other liver diseases) were present. The definition of significant alcohol intake varies from study to study, with an upper limit of 10-40 g/d of pure alcohol. According to the guidelines published by the American Association for the Study of Liver Diseases, the Korean Association for the Study of the Liver defined significant alcohol consumption as more than 210 g/wk in male and more than 140 g/wk in female over the last 2 years. In the present study, subjects who had significant alcohol consumption according to the definition of the Korean Association for the Study of the Liver were excluded.
- Dual-energy X-ray Absorptiometry and Definition of Decreased Bone Mineral Density
- BMD (g/cm2) was measured in the lumbar spine or femur using DXA (Prodgy, GE Healthcare, Madison, WI, USA; HOLOGIC QDR 4500W, Hologic Inc., Bedford, MA, USA). In postmenopausal females and males aged 50 years or older, the T-score was used to interpret the BMD value. The T-score represents an absolute risk of fracture and can be obtained by comparing the patient’s BMD with the BMD of the group of young adults with the highest BMD. According to the criteria proposed by the World Health Organization, the patient’s BMD was classified as normal when the T-score was -1.0 or higher, as osteopenia when it was lower than -1.0 and higher than -2.5, and as osteoporosis when it was lower than -2.5. In premenopausal females and males younger than 50 years old, the Z-score was used to interpret the BMD value. The Z-score can be obtained by comparing the patient’s BMD with the mean BMD of the same age group. Using the Z-score, the patient’s BMD was classified as normal if it was higher than -2.0 and as below the expected range for the patient’s age if it was -2.0 or lower.
- In the present study, the results of the physician’s interpretation of the patient’s BMD were used for the outcome variable. For the analysis, a dichotomous outcome variable, decreased BMD (or BMD decrease), was created, the interpretation of which corresponded to either (1) osteopenia, osteoporosis, or a BMD below the expected range for the patient’s age, or (2) an affirmative answer regarding whether the patient was currently taking osteoporosis medication. When a decrease in BMD is found at regular check-ups, it is difficult to know when the decrease actually occurred. Thus, in the present study, the time of initiation of the decrease in BMD was assumed to be the mid-point between the last time point when the test result was normal and the time point when the outcome of BMD decrease was detected. The observation period was calculated using the newly defined time point.
- Hypertension, Diabetes, and Dyslipidemia
- The subjects were considered to have hypertension if their systolic BP was greater than 140 mmHg or their diastolic BP was greater than 90 mmHg, if they answered ‘yes’ regarding whether they had been diagnosed with hypertension, or if they answered ‘yes’ regarding whether they currently took antihypertensive medication. Subjects were defined as having diabetes if their fasting blood glucose was above 126 mg/dL, if they answered ‘yes’ to the question about the diagnosis of diabetes, or if they answered ‘yes’ to the question about whether they currently took diabetes medication. If they answered ‘yes’ regarding whether they had been diagnosed with dyslipidemia, hyperlipidemia, hypercholesterolemia, or hypertriglyceridemia, they were considered to have a history of dyslipidemia.
- Statistical Analysis
- The subjects were divided by sex, and the basic characteristics according to the presence of NAFLD were summarized for each sex and compared. Continuous data were summarized as mean and standard deviation when normally or near-normally distributed and as median and quartile when skewed. Categorical data were summarized as frequency and percentage. For the comparison between the groups, continuous data were assessed with the independent t-test, and categorical data were evaluated with the chi-square or Fisher exact test.
- The number of total person-years was obtained by summing the observation periods of the subjects. The observation period was defined as the interval from the time of the first DXA test to the end of observation, which was defined as the last test or the time of occurrence of BMD decrease. The incidence rate per 1000 person-years was calculated by dividing the number of persons with decreased BMD by the total number of personyears and multiplying the resulting value by 1000. The subjects were divided into 2 subgroups based on a BMI of 23.0 kg/m2, which is the threshold for overweight, and the incidence rate of BMD decrease was calculated according to the presence of NAFLD in each subgroup. The incidence rates were also calculated for the male and female subgroups.
- Kaplan-Meier survival curves were drawn to visualize the differences in the rate of BMD decrease by the categories of interest, and log-rank tests were used to confirm whether statistically significant differences in the survival curves were present. To use the Cox proportional hazards model, log-log survival plots were drawn to confirm that the proportional hazards assumption was violated. Using the Cox proportional hazards model, hazard ratios (HRs) and 95% confidence intervals (CIs) for incident BMD decrease according to NAFLD status were obtained. All confounding factors were adjusted for as categorical variables except for age. The cut-off points were 2.5 for HOMA-IR; 0.04 mg/dL for hsCRP; 19.2%, 22.2%, 25.5%, and 41.3% for male’s body fat percentage quartiles; and 25.1%, 28.9%, 32.7%, and 50.2% for female’s body fat percentage quartiles. To test the modifying effects of age, sex, menopausal status, BMI, and body fat percentage category, subgroup analyses were conducted, and the interaction term between each variable and the NAFLD variable was included in each model.
- All statistical analyses were conducted using R version 3.4.1 (https://cran.r-project.org/bin/windows/base/old/3.4.1/), and p-values less than 0.05 were considered to indicate statistical significance.
- Ethics Statement
- This study was approved by the Institutional Review Board of Kangbuk Samsung Hospital (No. 2017-05-022).
METHODS
- A total of 4536 subjects were included (1006 males and 3530 females). Of the males, 434 (43.1%) had NAFLD, while 446 (12.6%) of the females had NAFLD. The mean age of the males was 49.3±9.8 years, and the mean age of the females was 43.3±7.8 years. In males, the mean age of the subjects did not differ significantly according to NAFLD status, whereas in females, the mean age was higher among subjects with NAFLD (Table 1). Most metabolic indicators showed statistically significant differences according to NAFLD status in both sexes. The proportion of obesity, hypertension, diabetes, and a history of dyslipidemia was higher in subjects with NAFLD than in subjects without NAFLD. In males, the proportion of those who engaged in vigorous physical activity more than 3 times a week was higher in subjects without NAFLD than in subjects with the condition.
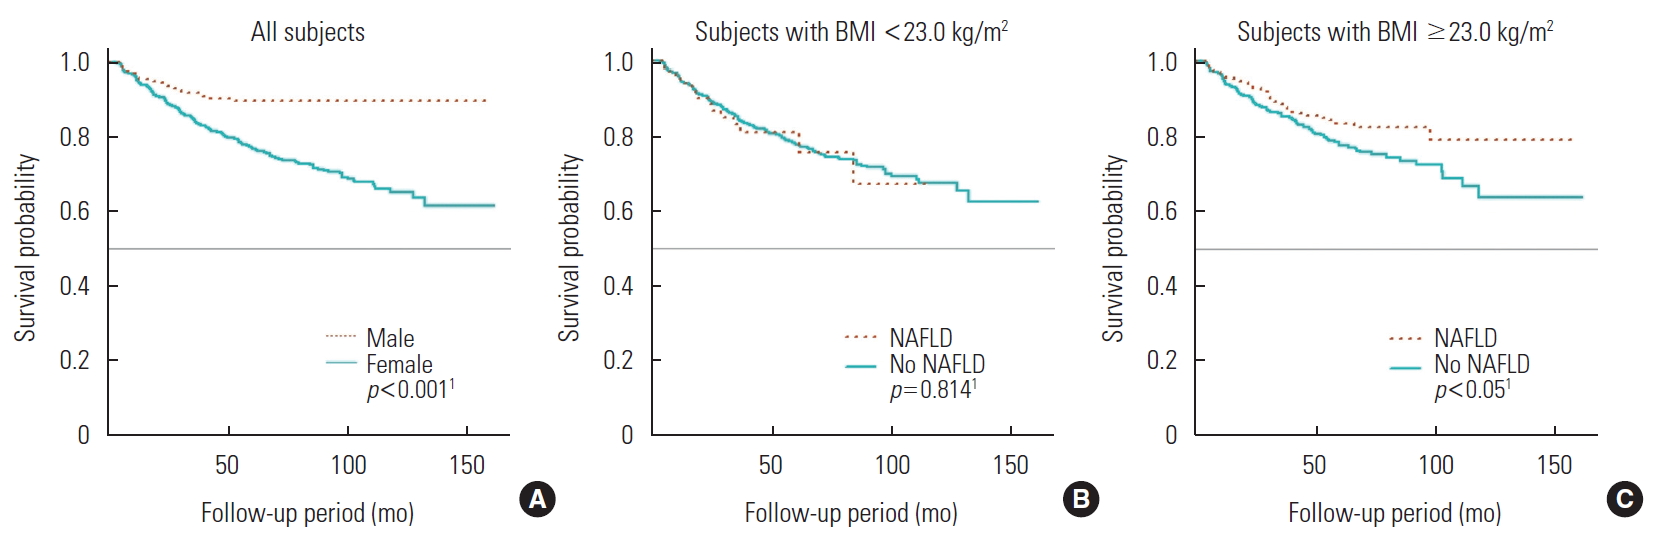
- Across 13 354 person-years of total follow-up, decreased BMD was observed in 606 subjects, corresponding to an incidence rate of 45.4 cases per 1000 person-years (median follow-up duration, 2.1 years). Table 2 shows the incidence according to sex, BMI, and NAFLD status. In the group with BMI greater than 23.0 kg/m2, those with NAFLD had a lower incidence of BMD decrease than those without NAFLD (incidence rate ratio, 0.70; 95% CI, 0.53 to 0.93). Figure 1 shows the Kaplan-Meier curves depicting the probability of avoiding incident BMD decrease over time.
- Table 3 shows the HRs and 95% CIs for incident BMD decrease according to NAFLD status. In model 1 (adjusted for age and sex), the HR for incident BMD decrease in subjects with NAFLD relative to subjects without NAFLD was 0.65 (95% CI, 0.51 to 0.82), indicating that those with NAFLD had a 35% lower risk of BMD decrease. In model 2 (adjusted for age, sex, and BMI), the HR was 0.78 (95% CI, 0.61 to 1.01), indicating that patients with NAFLD had a 22% lower risk of BMD decrease, although this difference was not statistically significant. In model 3 (additionally adjusted for cardiometabolic factors), the HR was 0.83 (95% CI, 0.64 to 1.08), meaning that the patients with NAFLD had a 17% lower risk of decreased BMD; again, however, this distinction was not statistically significant. Finally, in model 4, which was additionally adjusted for lifestyle factors relative to model 3, the HR was 0.79 (95% CI, 0.61 to 1.03). As such, NAFLD was associated with a 21% lower risk of decreased BMD in this model, but this finding was statistically insignificant.
- Table 4 shows the results of the subgroup analyses. In the subjects under 50 years old, the adjusted HR for incident BMD decrease in subjects with NAFLD versus subjects without the condition was 0.81 (95% CI, 0.54 to 1.22), and in the subjects over age 50, the HR was 0.83 (95% CI, 0.58 to 1.18). No significant interaction was found between NAFLD and age. For male subjects, the HR for incident BMD decrease in subjects with NAFLD relative to subjects without NAFLD was 0.93 (95% CI, 0.52 to 1.66). For female subjects, the HR was 0.73 (95% CI, 0.54 to 0.99), and NAFLD was associated with a significantly (27%) lower risk of decreased BMD. No significant interaction was found between NAFLD and sex. In the subgroup analysis according to menopausal status, the HR was 0.72 (95% CI, 0.44 to 1.20) for premenopausal female and 0.79 (95% CI, 0.54 to 1.15) for postmenopausal female. No significant interaction was found between NAFLD and menopausal status. In the subgroup analysis based on the cut-off of a BMI of 23.0 kg/m2, the HR was 1.09 (95% CI, 0.67 to 1.78) for subjects with BMI <23.0 kg/m2 and 0.79 (95% CI, 0.58 to 1.03) for subjects with BMI ≥23.0 kg/m2. The subgroup with BMI of 23.0 kg/m2 or greater was further divided based on a BMI threshold of 25.0 kg/m2, and the resulting HRs were 0.69 (95% CI, 0.43 to 1.09) for subjects with BMI 23.0-24.9 kg/m2 and 0.98 (95% CI, 0.62 to 1.54) for subjects with BMI 25.0 kg/m2 or greater. No significant interaction was found between NAFLD and BMI category. In the analysis according to body fat percentage quartile, the HR was 0.42 (95% CI, 0.09 to 1.98) for subjects in the first quartile, 1.28 (95% CI, 0.66 to 2.50) for subjects in the second quartile, 0.65 (95% CI, 0.38 to 1.10) for subjects in the third quartile, and 0.83 (95% CI, 0.54 to 1.26) for subjects in the fourth quartile. A significant interaction between NAFLD and body fat percentage quartile was found (p for interaction, 0.034).
RESULTS
- The authors conducted a retrospective cohort study to investigate the relationship between NAFLD and incident BMD decrease. NAFLD was found to have a protective effect on the development of decreased BMD, but the statistical significance disappeared after adjustment for confounding factors, including BMI. In the subgroup analysis, in female, the protective effect of NAFLD on the development of decreased BMD remained after adjustment for confounding factors.
- Previous epidemiological studies in adults have consistently reported a link between NAFLD and low BMD in male [18,20,21,26]. These associations have been found to be statistically significant after adjustment for BMI, waist circumference, metabolic indices including BP, lipids, glucose, HOMA-IR, hsCRP levels, physical activity, smoking, and alcohol consumption. However, in the present study, NAFLD was not found to be associated with the development of decreased BMD in male, and it is necessary to consider why these differences may have appeared. Kim et al. [27] found that NAFLD without significant liver fibrosis as assessed with liver transient elastography was not associated with low BMD, but NAFLD with significant liver fibrosis was associated with low BMD. Pardee et al. [28] reported that BMD was significantly lower in children with steatohepatitis confirmed by biopsy than in children with simple fatty liver. These results suggest that progressive NAFLD is more closely associated with low BMD than is early NAFLD. Most of the subjects in the present study would have been diagnosed with early NAFLD at periodic health check-ups if asymptomatic, and nearly 90% of the subjects had mild fatty liver (mild, 87.8%; moderate, 10.4%; severe, 1.8%). Therefore, their condition was less likely to be accompanied by liver fibrosis or steatohepatitis, and it would have been difficult to detect the detrimental effect of NAFLD on BMD. In a cross-sectional analysis conducted with only the first-visit data, low BMD was not associated with mild NAFLD, but it was significantly associated with moderate NAFLD.
- Unlike in male, the results of previous studies were not consistent in female. Moon et al. [19] reported that NAFLD was significantly associated with low BMD in postmenopausal female after adjustment for age, BMI, alanine aminotransferase levels, smoking, alcohol consumption, and metabolic syndrome. Cui et al. [26] also reported that postmenopausal female in the NAFLD group of their study had lower BMD after adjustment for weight, BMI, waist circumference, high-density lipoprotein, and alanine aminotransferase levels. Xia et al. [20] studied the association between BMD and liver fat content as measured with an ultrasound-based quantitative method and found that high liver fat content was significantly associated with low BMD in postmenopausal female after adjustment for age, body weight, smoking, alcohol consumption, BP, cholesterol, and uric acid levels. However, the statistical significance disappeared in a model additionally adjusted for body fat percentage and trunk-to-appendicular fat ratio, as well as in a model additionally adjusted for vitamin D and biomarkers of bone metabolism. The statistical significance still remained in male in these models, a difference which Xia et al. [20] explained as potentially due to differences in the mechanisms of osteoporosis development, body fat distribution, and sex hormone levels between sexes. Lee et al. [18] reported a positive association between NAFLD and lumbar spine BMD in postmenopausal female, which contrasted with the results in male. Lee et al. [18] suggested that the higher upper body fat distribution in postmenopausal female hinders spinal bone loss. In the present study, NAFLD was found to have a protective effect on the development of decreased BMD in female, and this effect remained statistically significant after adjustment for various confounding factors. In the subgroup analysis according to menopausal status, the protective effect was slightly greater in premenopausal female than in postmenopausal female, although this difference was not statistically significant. This suggested that a limit exists in explaining the protective effect due to differences in fat distribution in postmenopausal female. Comparing the studies that reported an association between NAFLD and low BMD in postmenopausal female with the studies that did not, the participants in the former studies tended to have lower lumbar BMD values despite being younger than those in the latter studies [18-20,26]. This suggests that the populations of the former studies may have lower baseline bone mass than those of the latter. Therefore, it is possible that any lifestyle or clinical characteristics that increase the baseline bone mass compensated for the detrimental effect of NAFLD on BMD or even had a positive effect. The subjects in the present study were relatively young and healthy, and NAFLD may have had a positive effect. Lifestyle modifications made after NAFLD was diagnosed, such as changes in exercise or eating habits, may also have been protective against BMD decrease.
- Analyses of the subgroups based on BMI and body fat percentage showed intriguing results, although these results were not statistically significant. NAFLD was associated with an increased risk of BMD decrease in the underweight and normal weight group (BMI <23.0 kg/m2), whereas the condition was associated with a decreased risk of BMD decrease in the overweight and obese group (BMI ≥23.0 kg/m2). Looking at the overweight and obese groups separately, NAFLD status corresponded to a 31% lower risk of BMD decrease in the overweight group, but only a 2% lower risk in the obese group. Similar results were obtained in the subgroup analysis based on body fat percentage. In the second-quartile subjects, NAFLD increased the risk of BMD decrease, while in the third and fourth quartiles, NAFLD was associated with a decreased risk of BMD decrease. In the third quartile, the risk was 35% lower, but it was only 17% lower in the fourth-quartile group. These results may indicate that the effect of NAFLD on BMD depends on the degree of obesity or body fat percentage. This may be due to the positive effects of obesity on the bone through mechanical loading, female hormone conversion in adipose tissue, and adipokines related to bone formation. These positive effects could offset the detrimental effects of NAFLD on the bone. However, as the degree of obesity intensifies, the harmful effects of obesity and NAFLD increase, and the protective effect of obesity becomes relatively small.
- The pathophysiology of the effect of NAFLD on BMD is not clear, but the key mechanisms are presumed to be insulin resistance and chronic inflammation [17,29]. Insulin promotes the proliferation and differentiation of osteoblasts, the generation of anabolic signals, and collagen synthesis, which influence the properties of bone. In an animal experiment, bone was found to be a site of insulin resistance, and in rats fed a high-fat diet, insulin resistance was found to be associated with reduced osteoblast proliferation and differentiation and increased osteoblast apoptosis, which resulted in decreased bone density of the jaw. A liver affected by NAFLD interacts closely with inflamed visceral fat tissue and secretes various proinflammatory cytokines, including interleukin-6 and tumor necrosis factor α. These signals lead to chronic inflammation, an important contributor to the pathogenesis of osteopenia and osteoporosis. Osteocalcin (a bone-derived hormone), osteopontin and osteoprotegerin (bone matrix glycoproteins), and leptin and adiponectin (adipocyte-derived hormones) are also thought to play a role in the link between NAFLD and low BMD. In addition, the severity of NAFLD is associated with vitamin D deficiency, which is believed to adversely impact bone metabolism. Additionally, physical inactivity and sedentary lifestyles in patients with NAFLD may be risk factors for low BMD.
- This study had several limitations. First, simple fatty liver, steatohepatitis, and fibrosis could not be distinguished because the diagnosis was based on ultrasonography, and biopsy was not performed. Second, the subjects were relatively young and the median follow-up period was short, which made it difficult to observe the clinical outcomes of BMD decrease. Third, no indicators related to bone metabolism, including bone-derived hormones or vitamin D, were included. Finally, the exact time of BMD decrease was unknown, since only the extent of the change that had occurred within a certain interval was known. Such data are referred to as interval-censored data and are often observed in health examination datasets. In such cases, the time point of occurrence can be estimated using various statistical techniques or replaced with the left end, mid-point, or right end of the interval in what is termed the single imputation method [30-32]. Although the single imputation method may be naïve and biased, it is very commonly used because it is simple and can take advantage of existing analytical methods for the processing of right-censored data. In this study, mid-point imputation, known to be the least biased of the single imputation methods, was used.
- The strength of this study was, first, that it is one of only a few cohort studies to evaluate the effect of NAFLD on BMD while taking into account the time sequence of the fatty liver diagnosis and time of incidence of decreased BMD. Compared to the previous cohort studies, our study had some strengths. We considered a wider variety of possible confounders, such as insulin resistance, than a Taiwanese cohort study that only considered comorbidities using National Health Insurance Research Database information [22]. Additionally, while the accuracy of diagnosis in health insurance data is generally low, in this study, fatty liver was confirmed via ultrasonography and normal BMD at baseline was ensured via DXA examinations. The number of subjects in this study was also higher than that of another cohort study, conducted in Zhejiang, China (4536 vs. 1064 subjects, respectively) [23]. Second, this study included young sexes, which allowed us to evaluate the effects of NAFLD on BMD in a younger population of individuals who usually do not undergo BMD examination. Third, by analyzing the subgroups based on several relevant factors, including BMI and body fat percentage, we found that the effect of NAFLD on BMD may vary among certain subgroups.
- In conclusion, NAFLD was found to have a significant protective effect on BMD decrease only in female. However, the effects may vary depending on BMI category or body fat percentage.
DISCUSSION
-
CONFLICT OF INTEREST
The authors have no conflicts of interest associated with the material presented in this paper.
-
FUNDING
None.
Notes
ACKNOWLEDGEMENTS
-
AUTHOR CONTRIBUTIONS
Conceptualization: JS, HKC. Data curation: JS. Formal Analysis: JS. Funding acquisition: None. Methodology: JS, HKC. Writing – original draft: JS. Writing – review & editing: JS, HKC, SR, YMS.
Notes
| Characteristics |
Male |
Female |
||||
|---|---|---|---|---|---|---|
|
Presence of NAFLD at baseline |
p-value1 |
Presence of NAFLD at baseline |
p-value1 | |||
| No (n=572) | Yes (n=434) | No (n=3084) | Yes (n=446) | |||
| Age (y) | 49.0±10.2 | 49.6±9.3 | 0.349 | 42.6±7.5 | 47.6±8.1 | <0.001 |
| BMI (kg/m2) | 23.2±2.4 | 25.6±2.3 | <0.001 | 21.5±2.5 | 25.3±3.1 | <0.001 |
| Fat percentage (%) | 20.4±4.5 | 24.8±4.5 | <0.001 | 28.1±5.1 | 34.7±4.8 | <0.001 |
| SBP (mmHg) | 113.0±12.3 | 116.0±12.5 | <0.001 | 105.6±13.5 | 113.8±15.9 | <0.001 |
| DBP (mmHg) | 74.1±8.8 | 75.6±8.9 | 0.010 | 67.9±9.3 | 73.0±10.4 | <0.001 |
| Glucose (mg/dL) | 95.0 [89.0, 101.0] | 97.0 [91.3, 106.0] | <0.001 | 90.0 [85.0, 95.0] | 96.0 [91.0, 104.0] | <0.001 |
| HOMA-IR | 1.2 [0.8, 1.8] | 1.9 [1.3, 2.5] | <0.001 | 1.4 [1.0, 1.9] | 2.2 [1.6, 3.0] | <0.001 |
| hsCRP (mg/dL) | 0.04 [0.02, 0.09] | 0.07 [0.04, 0.13] | 0.173 | 0.03 [0.01, 0.06] | 0.08 [0.04, 0.16] | <0.001 |
| Obesity | 132 (23.1) | 256 (59.0) | <0.001 | 267 (8.7) | 219 (49.1) | <0.001 |
| Hypertension | 121 (21.2) | 134 (30.9) | <0.001 | 226 (7.3) | 93 (20.9) | <0.001 |
| Diabetes | 41 (7.2) | 61 (14.1) | <0.001 | 25 (0.8) | 46 (10.3) | <0.001 |
| Dyslipidemia history | 98 (17.1) | 104 (24.0) | 0.009 | 138 (4.5) | 58 (13.0) | <0.001 |
| Vigorous physical activity (≥3 times/wk) | 142 (24.8) | 74 (17.1) | 0.008 | 643 (20.8) | 87 (19.5) | 0.701 |
| Current smoker | 163 (28.5) | 125 (28.8) | 1.000 | 643 (20.8) | 87 (19.5) | 0.701 |
| Alcohol consumption (≥1 unit/d) | 310 (54.2) | 227 (52.3) | 0.595 | 61 (2.0) | 9 (2.0) | 1.000 |
Values are presented as mean±standard deviation or median [interquartile range], or number (%).
NALFD, non-alcoholic fatty liver disease; BMI, body mass index; SBP, systolic blood pressure; DBP, diastolic blood pressure; HOMA-IR, homeostatic model assessment for insulin resistance; hsCRP, high-sensitivity C-reactive protein.
1 Continuous data were tested with independent t-test and categorical data were tested with chi-square or Fisher's exact test.
| Subjects | BMI (kg/m2) | Presence of NAFLD at baseline | No. of subjects | Person-years | No. of incident cases | Incidence rate per 1000 person-years | RR (95% CI) |
|---|---|---|---|---|---|---|---|
| Total | <23.0 | Yes | 149 | 370.8 | 19 | 51.2 | 1.08 (0.68, 1.71) |
| No | 2612 | 7720.9 | 367 | 47.5 | |||
| ≥23.0 | Yes | 731 | 2048.5 | 68 | 33.2 | 0.70 (0.53, 0.93)* | |
| No | 1044 | 3214.0 | 152 | 47.3 | |||
| Male | <23.0 | Yes | 47 | 107.5 | 4 | 37.2 | 1.07 (0.37, 3.14) |
| No | 260 | 577.0 | 20 | 34.7 | |||
| ≥23.0 | Yes | 387 | 970.5 | 21 | 21.6 | 0.95 (0.51, 1.77) | |
| No | 312 | 834.7 | 19 | 22.8 | |||
| Female | <23.0 | Yes | 102 | 263.3 | 15 | 57.0 | 1.17 (0.70, 1.97) |
| No | 2352 | 7143.9 | 347 | 48.6 | |||
| ≥23.0 | Yes | 344 | 1078.0 | 47 | 43.6 | 0.78 (0.56, 1.09) | |
| No | 732 | 2379.3 | 133 | 55.9 |
| NAFLD | Model 1 | Model 2 | Model 3 | Model 4 |
|---|---|---|---|---|
| No | 1.00 (reference) | 1.00 (reference) | 1.00 (reference) | 1.00 (reference) |
| Yes | 0.65 (0.51, 0.82)* | 0.78 (0.61, 1.01) | 0.83 (0.64, 1.08) | 0.84 (0.65, 1.10) |
Values are presented as adjusted hazard ratio (95% confidence interval).
NAFLD, non-alcoholic fatty liver disease; BMI, body mass index; HOMA-IR, homeostatic model assessment for insulin resistance; hsCRP, high-sensitivity C-reactive protein.
1 Model 1: adjusted for age, sex; Model 2: adjusted for age, sex, BMI; Model 3: adjusted for age, sex, BMI, hypertension, diabetes, history of dyslipidemia, HOMA-IR, hsCRP; Model 4: model 3 + adjusted for current smoking status, alcohol intake, vigorous physical activity.
* p<0.05.
| Subgroups | No. incident cases |
NAFLD, aHR (95% CI) |
p for interaction | |
|---|---|---|---|---|
| No | Yes | |||
| Age (y)1 | 0.332 | |||
| <50 (n = 3376) | 362 | 1.00 (reference) | 0.81 (0.54, 1.22) | |
| ≥50 (n = 1160) | 244 | 1.00 (reference) | 0.83 (0.58, 1.18) | |
| Sex2 | 0.192 | |||
| Male (n = 1006) | 64 | 1.00 (reference) | 0.93 (0.52, 1.66) | |
| Female (n = 3530) | 542 | 1.00 (reference) | 0.73 (0.54, 0.99)* | |
| Menopause3 | 0.844 | |||
| Premenopausal female (n = 2795) | 311 | 1.00 (reference) | 0.72 (0.44, 1.20) | |
| Postmenopausal female (n = 735) | 231 | 1.00 (reference) | 0.79 (0.54, 1.15) | |
| BMI (kg/m2) subgroups I4 | 0.220 | |||
| <23.0 (n = 2761) | 386 | 1.00 (reference) | 1.09 (0.67, 1.78) | |
| ≥23.0 (n = 1775) | 220 | 1.00 (reference) | 0.79 (0.58, 1.03) | |
| BMI (kg/m2) subgroups II4 | 0.637 | |||
| <23.0 (n = 2761) | 386 | 1.00 (reference) | 1.09 (0.67, 1.78) | |
| 23.0-24.9 (n = 901) | 129 | 1.00 (reference) | 0.69 (0.43, 1.09) | |
| ≥25.0 (n = 874) | 91 | 1.00 (reference) | 0.98 (0.62, 1.54) | |
| Body fat percentage5 | 0.034 | |||
| Q1 (n = 1097) | 145 | 1.00 (reference) | 0.42 (0.09, 1.98) | |
| Q2 (n = 1094) | 138 | 1.00 (reference) | 1.28 (0.66, 2.50) | |
| Q3 (n = 1097) | 147 | 1.00 (reference) | 0.65 (0.38, 1.10) | |
| Q4 (n = 1097) | 123 | 1.00 (reference) | 0.83 (0.54, 1.26) | |
NAFLD, non-alcoholic fatty liver disease; aHR, adjusted hazard ratio; CI, confidence interval; BMI, body mass index; Q, quartile; HOMA-IR, homeostatic model assessment for insulin resistance; hsCRP, high-sensitivity C-reactive protein.
1 Aadjusted for sex, BMI, hypertension, diabetes, history of dyslipidemia, HOMA-IR, hsCRP, current smoking status, alcohol intake, vigorous physical activity.
2 Adjusted for age, BMI, hypertension, diabetes, history of dyslipidemia, HOMA-IR, hsCRP, current smoking status, alcohol intake, vigorous physical activity.
3 Adjusted for age, sex, BMI, hypertension, diabetes, history of dyslipidemia, HOMA-IR, hsCRP, current smoking status, alcohol intake, vigorous physical activity.
4 Adjusted for age, sex, body fat percentage, hypertension, diabetes, history of dyslipidemia, HOMA-IR, hsCRP, current smoking status, alcohol intake, vigorous physical activity.
5 Adjusted for age, sex, BMI, hypertension, diabetes, history of dyslipidemia, HOMA-IR, hsCRP, current smoking status, alcohol intake, vigorous physical activity.
* p<0.05.
- 1. WHO Scientific Group on the Prevention and Management of Osteoporosis. Prevention and management of osteoporosis: report of a WHO scientific group. 2003 [cited 2020 Mar 1]. Available from: https://apps.who.int/iris/handle/10665/42841
- 2. Kim YA. Osteoporosis or low bone mass in adults aged 50 years old and above in Republic of Korea, 2008-2011. Public Health Wkly Rep 2013;7(42):939-942. (Korean)
- 3. Ha YC, Kim HY, Jang S, Lee YK, Kim TY. Economic burden of osteoporosis in South Korea: claim data of the National Health Insurance Service from 2008 to 2011. Calcif Tissue Int 2017;101(6):623-630ArticlePubMedPDF
- 4. Chung YS. Current and upcoming treatments for osteoporosis. J Rheum Dis 2012;19(1):4-10. (Korean)Article
- 5. Choi JM, Kim CB. Obesity management and scientific evidence. J Korean Med Assoc 2011;54(3):250-265. (Korean)Article
- 6. Korea Centers for Disease Control and Prevention. Korea health statistics 2015: Korea National Health and Nutrition Examination Survey (KNHANES VI-3). [cited 2020 Mar 1]. Available from: https://knhanes.cdc.go.kr/knhanes/sub04/sub04_03.do?classType=7 (Korean)
- 7. World Health Organization. Global status report on noncommunicable diseases. 2010 [cited 2020 Mar 1]. Available from: https://apps.who.int/iris/handle/10665/44579
- 8. Cao JJ. Effects of obesity on bone metabolism. J Orthop Surg Res 2011;6: 30ArticlePubMedPMC
- 9. Zhao LJ, Liu YJ, Liu PY, Hamilton J, Recker RR, Deng HW. Relationship of obesity with osteoporosis. J Clin Endocrinol Metab 2007;92(5):1640-1646ArticlePubMedPMCPDF
- 10. Zhao LJ, Jiang H, Papasian CJ, Maulik D, Drees B, Hamilton J, et al. Correlation of obesity and osteoporosis: effect of fat mass on the determination of osteoporosis. J Bone Miner Res 2008;23(1):17-29ArticlePubMed
- 11. Kim JH, Choi HJ, Kim MJ, Shin CS, Cho NH. Fat mass is negatively associated with bone mineral content in Koreans. Osteoporos Int 2012;23(7):2009-2016ArticlePubMedPDF
- 12. Shapses SA, Pop LC, Wang Y. Obesity is a concern for bone health with aging. Nutr Res 2017;39: 1-13ArticlePubMedPMC
- 13. Walsh JS, Vilaca T. Obesity, type 2 diabetes and bone in adults. Calcif Tissue Int 2017;100(5):528-535ArticlePubMedPMCPDF
- 14. Korean Association for the Study of the Liver (KASL). KASL clinical practice guidelines: management of nonalcoholic fatty liver disease. Clin Mol Hepatol 2013;19(4):325-348ArticlePubMedPMC
- 15. Shulman GI. Ectopic fat in insulin resistance, dyslipidemia, and cardiometabolic disease. N Engl J Med 2014;371(12):1131-1141ArticlePubMed
- 16. Targher G, Day CP, Bonora E. Risk of cardiovascular disease in patients with nonalcoholic fatty liver disease. N Engl J Med 2010;363(14):1341-1350ArticlePubMed
- 17. Targher G, Lonardo A, Rossini M. Nonalcoholic fatty liver disease and decreased bone mineral density: is there a link? J Endocrinol Invest 2015;38(8):817-825ArticlePubMedPDF
- 18. Lee SH, Yun JM, Kim SH, Seo YG, Min H, Chung E, et al. Association between bone mineral density and nonalcoholic fatty liver disease in Korean adults. J Endocrinol Invest 2016;39(11):1329-1336ArticlePubMedPDF
- 19. Moon SS, Lee YS, Kim SW. Association of nonalcoholic fatty liver disease with low bone mass in postmenopausal women. Endocrine 2012;42(2):423-429ArticlePubMedPDF
- 20. Xia MF, Lin HD, Yan HM, Bian H, Chang XX, Zhang LS, et al. The association of liver fat content and serum alanine aminotransferase with bone mineral density in middle-aged and elderly Chinese men and postmenopausal women. J Transl Med 2016;14: 11ArticlePubMedPMC
- 21. Yang HJ, Shim SG, Ma BO, Kwak JY. Association of nonalcoholic fatty liver disease with bone mineral density and serum osteocalcin levels in Korean men. Eur J Gastroenterol Hepatol 2016;28(3):338-344ArticlePubMedPMC
- 22. Chen HJ, Yang HY, Hsueh KC, Shen CC, Chen RY, Yu HC, et al. Increased risk of osteoporosis in patients with nonalcoholic fatty liver disease: a population-based retrospective cohort study. Medicine (Baltimore) 2018;97(42):e12835ArticlePubMedPMC
- 23. Shen Z, Cen L, Chen X, Pan J, Li Y, Chen W, et al. Increased risk of low bone mineral density in patients with non-alcoholic fatty liver disease: a cohort study. Eur J Endocrinol 2020;182(2):157-164ArticlePubMed
- 24. World Health Organization. The Asia-Pacific perspective: redefining obesity and its treatment. 2000 [cited 2020 Mar 1]. Available from: https://apps.who.int/iris/handle/10665/206936
- 25. Kim CW, Yun KE, Jung HS, Chang Y, Choi ES, Kwon MJ, et al. Sleep duration and quality in relation to non-alcoholic fatty liver disease in middle-aged workers and their spouses. J Hepatol 2013;59(2):351-357ArticlePubMed
- 26. Cui R, Sheng H, Rui XF, Cheng XY, Sheng CJ, Wang JY, et al. Low bone mineral density in Chinese adults with nonalcoholic fatty liver disease. Int J Endocrinol 2013;2013: 396545ArticlePubMedPMCPDF
- 27. Kim G, Kim KJ, Rhee Y, Lim SK. Significant liver fibrosis assessed using liver transient elastography is independently associated with low bone mineral density in patients with non-alcoholic fatty liver disease. PLoS One 2017;12(7):e0182202ArticlePubMedPMC
- 28. Pardee PE, Dunn W, Schwimmer JB. Non-alcoholic fatty liver disease is associated with low bone mineral density in obese children. Aliment Pharmacol Ther 2012;35(2):248-254ArticlePubMed
- 29. Poggiogalle E, Donini LM, Lenzi A, Chiesa C, Pacifico L. Non-alcoholic fatty liver disease connections with fat-free tissues: a focus on bone and skeletal muscle. World J Gastroenterol 2017;23(10):1747-1757ArticlePubMedPMC
- 30. Yun EY, Kim CR. Estimation of survival function and median survival time in interval-censored data. Korean J Appl Stat 2010;23(3):521-531. (Korean)ArticlePDF
- 31. Park SH, Kim J, Nam CM. Comparison of estimation methods of Cox proportional hazards model with interval-censored data. J Health Info Stat 2015;40(3):53-59. (Korean)
- 32. Lee TC, Zeng L, Thompson DJ, Dean CB. Comparison of imputation methods for interval censored time‐to‐event data in joint modelling of tree growth and mortality. Can J Stat 2011;39(3):438-457Article
REFERENCES
Figure & Data
References
Citations
- Anti-osteoporotic treatments in the era of non-alcoholic fatty liver disease: friend or foe
Maria Eleni Chondrogianni, Ioannis Kyrou, Theodoros Androutsakos, Christina-Maria Flessa, Evangelos Menenakos, Kamaljit Kaur Chatha, Yekaterina Aranan, Athanasios G. Papavassiliou, Eva Kassi, Harpal S. Randeva
Frontiers in Endocrinology.2024;[Epub] CrossRef - Association between body fat and bone mineral density in Korean adults: a cohort study
Hyunjung Yoon, Eunju Sung, Jae-Heon Kang, Cheol-Hwan Kim, Hocheol Shin, Eunsol Yoo, Minyoung Kim, Mi Yeon Lee, Sujeong Shin
Scientific Reports.2023;[Epub] CrossRef - Liver fibrosis is associated with impaired bone mineralization and microstructure in obese individuals with non-alcoholic fatty liver disease
Ilaria Barchetta, Carla Lubrano, Flavia Agata Cimini, Sara Dule, Giulia Passarella, Arianna Dellanno, Alberto Di Biasio, Frida Leonetti, Gianfranco Silecchia, Andrea Lenzi, Maria Gisella Cavallo
Hepatology International.2023; 17(2): 357. CrossRef - Non-Alcoholic Fatty Liver Disease and Bone Tissue Metabolism: Current Findings and Future Perspectives
Oxana M. Drapkina, Anastasia Yu. Elkina, Anna F. Sheptulina, Anton R. Kiselev
International Journal of Molecular Sciences.2023; 24(9): 8445. CrossRef - Nonalcoholic Fatty Liver Disease Is Associated With Decreased Bone Mineral Density in Adults: A Systematic Review and Meta‐Analysis
Ying‐Hao Su, Kuo‐Liong Chien, Shu‐Hua Yang, Wei‐Tso Chia, Jen‐Hau Chen, Yen‐Ching Chen
Journal of Bone and Mineral Research.2023; 38(8): 1092. CrossRef - The National Consensus statement on the management of adult patients with non-alcoholic fatty liver disease and main comorbidities
Marina V. Maevskaya, Yulia V. Kotovskaya, Vladimir T. Ivashkin, Olga N. Tkacheva, Ekaterina A. Troshina, Marina V. Shestakova, Valeriy V. Breder, Natalia I. Geyvandova, Vladimir L. Doshchitsin, Ekaterina N. Dudinskaya, Ekaterina V. Ershova, Khava B. Kodzo
Terapevticheskii arkhiv.2022; 94(2): 216. CrossRef - Nonalcoholic fatty liver disease and osteoporosis: A potential association with therapeutic implications
Ilias D. Vachliotis, Athanasios D. Anastasilakis, Antonis Goulas, Dimitrios G. Goulis, Stergios A. Polyzos
Diabetes, Obesity and Metabolism.2022; 24(9): 1702. CrossRef - Hepatic fibrosis is associated with an increased rate of decline in bone mineral density in men with nonalcoholic fatty liver disease
Ji Won Yoon, Min Joo Kim, Goh-Eun Chung, Jong In Yang, Jeong Yoon Yim, Jin Ju Kim, Sun Mie Kim, Min-Sun Kwak
Hepatology International.2021; 15(6): 1347. CrossRef - NAFLD Associated Comorbidity
L. B. Lazebnik, S. V. Turkina
Experimental and Clinical Gastroenterology.2021; (10): 5. CrossRef
 PubReader
 ePub Link
 Cite
Cite

