Articles
- Page Path
- HOME > J Prev Med Public Health > Volume 44(3); 2011 > Article
-
Special Article
Cost Effectiveness of Interventions to Promote Screening for Colorectal Cancer: A Randomized Trial - Swati Misra1, David R. Lairson1, Wenyaw Chan1, Yu-Chia Chang, L. Kay Bartholomew1, Anthony Greisinger2, Amy McQueen3, Sally W. Vernon1
-
Journal of Preventive Medicine and Public Health 2011;44(3):101-110.
DOI: https://doi.org/10.3961/jpmph.2011.44.3.101
Published online: May 17, 2010
1School of Public Health, University of Texas Health Science Center at Houston, Houston, USA.
2Kelsey Research Foundation, Houston, USA.
3Washington University School of Medicine, St. Louis, USA.
- Corresponding author: David R. Lairson, PhD. 1200 Herman Pressler Dr., Houston, TX 77030 Suite RAS-E307, USA. Tel: +1-713-500-9176, Fax: +1-713-500-9171, David.R.Lairson@uth.tmc.edu
Copyright © 2011 The Korean Society for Preventive Medicine
This is an Open Access article distributed under the terms of the Creative Commons Attribution Non-Commercial License (http://creativecommons.org/licenses/by-nc/3.0/) which permits unrestricted non-commercial use, distribution, and reproduction in any medium, provided the original work is properly cited.
ABSTRACT
-
Objectives
- Screening for colorectal cancer is considered cost effective, but is underutilized in the U.S. Information on the efficiency of "tailored interventions" to promote colorectal cancer screening in primary care settings is limited. The paper reports the results of a cost effectiveness analysis that compared a survey-only control group to a Centers for Disease Control (CDC) web-based intervention (screen for life) and to a tailored interactive computer-based intervention.
-
Methods
- A randomized controlled trial of people 50 and over, was conducted to test the interventions. The sample was 1224 partcipants 50-70 years of age, recruited from Kelsey-Seybold Clinic, a large multi-specialty clinic in Houston, Texas. Screening status was obtained by medical chart review after a 12-month follow-up period. An "intention to treat" analysis and micro costing from the patient and provider perspectives were used to estimate the costs and effects. Analysis of statistical uncertainty was conducted using nonparametric bootstrapping.
-
Results
- The estimated cost of implementing the web-based intervention was $40 per person and the cost of the tailored intervention was $45 per person. The additional cost per person screened for the web-based intervention compared to no intervention was $2602 and the tailored intervention was no more effective than the web-based strategy.
-
Conclusions
- The tailored intervention was less cost-effective than the web-based intervention for colorectal cancer screening promotion. The web-based intervention was less cost-effective than previous studies of in-reach colorectal cancer screening promotion. Researchers need to continue developing and evaluating the effectiveness and cost-effectiveness of interventions to increase colorectal cancer screening.
- About 146 970 new cases of colorectal cancer (CRC) and 49920 CRC deaths were expected in the U.S. in 2009 [1]. U.S. hospital admissions for CRC were projected to increase from 205 000 to 471 000 among people 50 years and older from 1992 to the year 2050 [2]. CRC thus poses a considerable health and economic burden in the U.S. Screening for CRC is effective and cost effective in reducing morbidity and mortality and is recommended by the American Cancer Society (ACS), American Gastroenterological Association, Centers for Disease Control and Prevention and the United States Preventive Services Task Force (USPSTF) [3-6]. Screening modalities recommended by the ACS for persons at average risk aged 50 and above at the time of this study included an annual fecal occult blood test (FOBT) or a flexible sigmoidoscopy (FS) every 5 years, or an annual FOBT and a FS every 5 years or a double contrast barium enema (DCBE) every 5 years or a colonoscopy (COL) every 10 years [3]. The Healthy People 2010 goal that "At least 50 percent of adults aged 50 years or older who have received a FOBT within the preceding 2 years and who have ever received a sigmoidoscopy" were not met [7]. There is a need for interventions to increase adherence to CRC screening (CRCS) in the target population of average risk adults in the U.S.
- Screening promotion interventions have applied the concept of "tailoring" based on the specific attitudes, knowledge and beliefs of the participants [8]. While tailoring was expected to improve the behavioral response, it added to the cost of implementing screening promotion interventions due to the need to collect participant specific information. It was therefore important to inform decision makers about the cost effectiveness of tailored interventions and the uncertainties associated with projecting the results of studies to "real world" applications. Few previous studies of CRCS promotion provide evidence on cost-effectiveness of tailored interventions for improving screening compliance [9-11]. Studies were needed to assess the effectiveness and efficiency of tailored CRCS promotion interventions [12]. The following cost effectiveness analysis was done to determine the efficiency of tailored and web-based interventions for improving adherence to CRCS.
INTRODUCTION
- Project PCCaSO, a randomized trial funded by the National Cancer Institute (R01CA97263-02), was conducted through the University of Texas Health Science Center at Houston School of Public Health (UTSPH) and the Kelsey Research Foundation (KRF) [13].The study protocol was approved by the institutional review board at UTSPH. Participants included 1224 patients from Kelsey-Seybold Clinic (KSC), a large multi-specialty group practice that serves about 400 000 people in greater Houston, Texas. Inclusion criteria were adult patients aged 50 to 70 years who had a visit to the clinic within the past year, had no history of CRC, and either never screened for CRC or were currently due for screening according to the ACS guidelines [3]. Participants were recruited to the study between 2004 and 2006. Patients who had already scheduled a routine physical exam within the next month or agreed to schedule one with their primary care provider at KSC were selected. Participants received an invitation letter and follow-up phone calls from KRF to confirm their participation and obtain a verbal HIPAA authorization. Participants completed a baseline telephone survey to gather information about demographics, history of CRC and CRCS, and beliefs about screening.
- Participants were randomized so that the characteristics of the participants were distributed evenly among the three study groups: 1) tailored interactive computer-based intervention, 2) web-based (screen for life) intervention and 3) survey-only control group (Figure 1). The tailored interactive computer-based intervention was developed and tested by the project team using intervention mapping that utilizes empiric evidence and theory to identify determinants of health behavior and select strategies for an intervention [14]. The 15 to 25 minute computer-based tailored intervention was based on the Transtheoretical Model. The program utilized video vignettes that aimed to identify the individual's stage of readiness to undergo screening, increase their knowledge about CRC, and increase their motivation for CRC screening. The program summarized the patient's primary questions about CRCS and printed a letter to serve as a basis for discussion about CRCS with their physician during their wellness visit. The intervention was informed by expert systems used in previously successful interventions to promote cancer screening [15,16]. The interactive computer program was built using Flash MX 2004 Professional and Adobe products including Photoshop, Illustrator, Premier, and Audition. Data were tracked and converted from the program into a database with MicroSoft Access. Details of the development process and cost of developing the interactive program were previously published [17].The web-based "Screen for Life" program runs on the Center for Disease Control (CDC) website, and provides information about cancer risks and screening recommendations[18]. Participants in this group were asked to view the website while in the Health Information Center (HIC), prior to their medical appointment.
- Participants were asked to arrive at the HIC at KSC 45 minutes prior to their primary care appointment. The intervention groups received their interventions prior to their appointment, while the survey-only control group received no intervention during the HIC visit, but could browse through educational materials located in the HIC or go to their appointment. The physicians were blinded to the study assignment of their patients unless the patients discussed their participation in the study with their physician. A 6-month follow up telephone survey collected data on knowledge, attitudes, and beliefs to assess change in those factors. Patients' medical charts were reviewed one year after the appointment to determine the participant's CRCS status.
- I. Effect Estimation
- The effectiveness measure was the proportion of participants who were adherent with screening in each group within 12 months of receiving the intervention. The screening adherence rates for the two intervention groups were compared with the control group and with each other.
- II. Cost Estimation
- Costs were estimated from the provider and participant perspective for each intervention group and summarized by major activity, which included recruitment, intervention delivery and 6 month follow-up. The material and time cost for each project activity was determined by prospective micro costing, where the resource use was tracked and weighted with local prices. The cost data were gathered from the following sources:
-
Personnel time logs for time spent in minutes for each task of the different project activities
Participant time log data for telephone survey completion and intervention viewing
Purchase orders and invoices for materials used in the project
Estimation of overhead costs as a percentage of the direct cost
- Total cost was computed as the sum of the direct cost for each activity plus the overhead cost. Overhead cost was estimated at 35% of direct cost. Average cost per participant was calculated by dividing the total cost for each intervention by the number of participants in each intervention group. Development cost of the tailored intervention was not included in the analysis as it was considered a "sunk cost." Research costs, including the 12 month follow-up chart review were not included in the analysis. All costs were valued in 2004 U.S. dollars, the year that data collection was initiated.
- III. Description of Costs According to Project Activities
- The cost of recruiting study participants was the sum of the time cost of personnel to: 1) identify eligible participants from the patient database, 2) develop recruitment letters and 3) make follow-up phone calls to enroll eligible patients and obtain consent. Personnel time cost was calculated by multiplying the adjusted salary per minute by the number of minutes spent on the recruitment process [19]. Recruitment costs also included the cost of postage, supplies and materials for sending letters to the eligible participants.
- The cost of administering the intervention at the HIC and conducting the 6-month survey was comprised of personnel time and overhead cost. Personnel cost was calculated by multiplying the adjusted salary per minute by the number of minutes spent delivering the intervention and administering the 6 month survey. Overhead cost included facility, office space, utilities, equipment, computers and database management. It was calculated by multiplying direct costs for each group with a hypothetical overhead rate of 35% [19].
- Time spent by the participants viewing the CRCS information on either the website or the tailored intervention was automatically tracked when they logged onto the computer in the HIC. Patient time cost was calculated by multiplying the total time spent viewing the intervention by the mean hourly wage rate for employed participants; the federal minimum wage rate for retired subjects and a weighted average of the mean hourly wage rate and the federal minimum wage rate for participants with missing employment status. The participant time cost for taking the follow-up telephone survey was similarly calculated. Transportation cost and the travel time cost to and from the HIC was excluded from the analysis, as the study subjects were going to the clinic to visit their primary care physician for their wellness visit.
- IV. Cost-Effectiveness Analysis
- A cost-effectiveness analysis was conducted to identify the most efficient strategy for increasing CRCS compliance compared to a survey-only control group [20]. The incremental cost-effectiveness ratios (ICERs) represent the additional cost per additional person screened for CRC stepping up from the control group to the web-based intervention group and then to the tailored intervention group. ICER was computed by dividing the incremental cost by the incremental effect. The sensitivity of the incremental cost-effectiveness ratios was assessed by tracking changes in the ICER with changes in the assumptions regarding the overhead rate, whether a "real world" program would include a follow-up survey to assess the effect of the interventions on screening behavior, and the assumption that the HIC personnel would not be doing other tasks while patients were going through the interactive computer and web based interventions. The assumption of percent time HIC personnel devoted to the intervention was varied from 100% to 25%. In addition to the recruitment and intervention cost, the base case scenario included the follow-up survey cost and 35% overhead, the worst case scenario included the follow-up survey cost and 40% overhead and the best case scenario included no survey cost and 30% overhead. Costs and effects were not discounted because discounting would have little effect over the one-year follow-up period.
- Statistical uncertainty in the cost and effect estimates was assessed with nonparametric bootstrapping, a method that requires no assumption of the sampling distributions of the estimated cost or outcome [21]. Replicates of cost and effect were obtained and plotted on the cost-effectiveness plane by sampling cost and screening outcome for all the cases with replacement one thousand times (see description in the appendix).
- The missing values of some direct cost variables were imputed using simple linear regression models [22].The screening compliance for each participant; a binary variable, was obtained from the randomized trial.
METHODS
A. Recruitment cost
B. Intervention delivery and follow-up
- The study population was evenly distributed acrosss the study groups About 80.0% of the patients were 50-59 years old, 60.0% were female, 35.0% were white, 47.0% were African American, 12.5% were Hispanic and 75.0% had a post high school level of education. Over 90.0% of the patients had private insurance and 56.0% reported an income of over $50000 per year.
- I. Costs and Cost-Effectiveness
- Table 1 presents a breakdown of the cost per person for administering the web-based educational intervention and the tailored, interactive intervention.
- The average cost was $39.82 and the standard deviation was $6.45 per person for implementing the web-based intervention. The average cost per person for implementing the tailored intervention was $44.87 and the standard deviation was $6.69 per person. Patients were not randomized to intervention or control groups until after they completed the baseline survey. Thus any differences in costs to recruit people were not due to any known/systematic differences between groups. The variability in cost was primarily due to the time cost of both patients and staff during the intervention delivery; more time was required to complete the tailored intervention. For the tailored intervention, about 56% of the direct cost was for intervention delivery, compared to 51% for the web-based education intervention. The remainder of direct cost was primarily for recruitment in each intervention. Estimates of the base case incremental cost-effectiveness analysis are presented in Table 2.
- The screening compliance in the control group was 33.9% compared with 35.4% in the web-based group and 32.0% in the tailored group. The randomized trial did not yield statistically significant differences in screening rates [13]. For the economic evaluation, the point estimates represent the "best" available estimate of program effects and costs. The mean ICER was $ 2602 moving from no intervention to the web-based intervention, whereas the tailored intervention had a negative mean ICER compared to both the control group and the website intervention, due to negative effect. The tailored intervention was dominated by the website intervention as the tailored intervention was more costly and less effective. Tables A1, A2 and A3 present the results of the sensitivity analyses. The average cost and the incremental cost effectiveness ratios showed relatively small changes to alternative assumptions regarding the inclusion of surveys and the overhead rate. The ICER comparing the web-based intervention to the control group declined by 30% when the percent time the HIC personnel devoted to the intervention was decreased from 100% to 25%. However, the cost per additional person screened remained above $1800.
- II. Results of Uncertainty Analysis
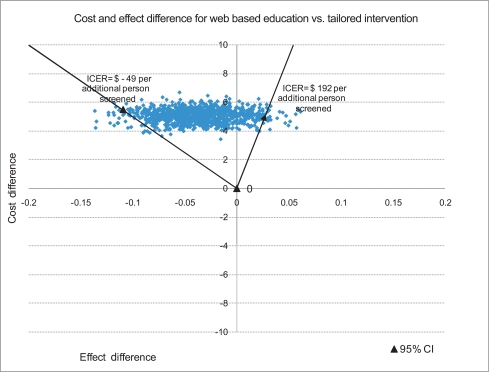
- The joint density of ΔC (difference in cost) and ΔE (difference in effect) when comparing the survey-only control group to the web-based intervention along with the 95% Confidence Interval (CI) for ICER is summarized in Figure 2. The joint density of ΔC and ΔE when comparing the web-based intervention to the tailored intervention along with the 95% CI for ICER is summarized in Figure 3.
- The bootstrapped mean differences for cost and effectiveness per participant presented in Figure 2 imply that the web-based intervention has an added cost with a positive effect compared with no intervention as 68.0% of the bootstrapped replicates fall in the NE quadrant of the cost effectiveness plane. Decision makers may consider implementing this intervention depending on how much they are willing to pay per additional person screened for CRC and their assessment of the chance that the intervention could result in lower screening compliance than the no intervention alternative. Implementing a tailored intervention compared to the web-based education has a negative effect and an added cost as most of the bootstrapped joint density for cost and effect differences per participant fall in the NW quadrant of the CE plane. The results therefore do not provide support for disseminating this type of tailored intervention.
RESULTS
- The results of this large, carefully executed trial of a tailored intervention in a well-organized multi-specialty group practice raise concerns about the efficiency of this resource-intensive approach to CRCS promotion. The tailored computer based intervention was dominated (more costly and less effective) than a simpler web-based education intervention. The web-based education intervention was relatively costly compared to other mail and system reminder based interventions in primary care settings.
- The results are consistent with the general findings from a systematic review of patient directed tailored intervention studies [23]. For example, Myers et al. [24] found that implementation of targeted and tailored interventions for CRCS promotion improved screening compliance compared to regular care or no intervention. However, the value of tailoring interventions was questioned when compliance was shown to be slightly lower than for the interventions involving mail and telephone reminders. Ling et al. [25] presented results of a randomized trial comparing tailored vs. non-tailored physician recommendation letters and enhanced vs. non-enhanced physician office and patient management systems to improve screening rates for CRC in a population of eligible patients aged 50-79 years in 10 primary care physician office practices in Philadelphia. At one year follow-up, a flexible sigmoidoscopy or colonoscopy was obtained by 54.2% of participants in the non-tailored letter, enhanced management group, 53.3% in the tailored-letter, enhanced management group, 43.6% in the tailored-letter, non-enhanced management group and 37.6% in the non-tailored letter, non-enhanced management group. Thus, in the enhanced management group the tailored interventions showed a smaller impact on CRCS compared to providing non-tailored information on CRCS, similar to our findings.
- Our web-based intervention was less cost-effective compared to previous studies of CRCS promotion. In a study by Chirikos et al. [10] the authors presented results of a low-cost inreach intervention to improve mammography rates, FOBT compliance and pap testing compliance in a low-income population of eligible patients aged 50-75 years in a clinical setting. Cancer screening office systems, a reminder system for physicians to check the current screening status of eligible patients and ensure completion of timely screening, was implemented in primary care clinics in Florida. The ICER results for an FOBT was $12 and the compliance rate was 40% for the intervention group, suggesting that the method of a non-computerized reminder system utilizing the available clinic personnel was cost effective for improving cancer screening compliance in a primary care setting. However, participants were low income and the control group screening rate was 12%. Our participants were middle class, insured, with a 30 percent screening rate in the control group. A more recent study evaluated the cost-effectiveness of an intervention among patients of a multi-specialty group practice in eastern Massachusetts [26]. The intervention included a tailored letter, educational brochure, a fecal occult blood test kit with a stamped return envelope, and a phone number to a dedicated line for scheduling a sigmoidosopy or colonoscopy. The baseline screening rate was 63%, the increase in the screening rate was 5.8% and the incremental cost per additional person screened was $94. Costs may be low due to a fully operational electronic medical record system, no mention of overhead costs, and low cost for the FOBT kits. While letters were tailored, there was no discussion of the degree or cost of the tailoring. With multiple program elements, it was not possible to determine the effectivness of the tailoring component.
- The literature on cancer screening promotion supports implementing some form of intervention, whether a targeted intervention with mail or phone reminders or a tailored intervention or generic print based information about cancer screening to patients, or reminder systems to physicians to positively affect screening compliance among the target population of 50-70 years when compared to no intervention [9-12,19,24,25]. However, our findings and those of studies described above, raise questions about the information provided to participants about CRCS. One possible explanation of the limited effect of the interventions is that the baseline survey about colorectal cancer and screening may have cued the control group to action [27]. However, this would not explain why the tailored intervention performed worse than the web-based intervention. Participants spent an average of 23 minutes on the tailored intervention compared to 17 minutes on the web-based program [13]. Perhaps, the more extensive individualized information about cancer and screening raises apprehension about screening, which could result in lower compliance. Also, the role of physicians is very important for screening compliance [28]. Although the physicians in the KSC group practice were informed about the study and the importance of CRCS and patients were encouraged to discuss CRCS with their physician, including doctors more directly in the intervention design may improve screening compliance. A qualitative analysis of a subset of patients' discussions with providers about CRCS in the current study found that providers focused on colonoscopy, which reduced discussion of patient's test preferences and conflicted with our interventions' focus on choice between multiple test options [29].
- Promoting CRCS via website interventions may be a suitable strategy to improve screening rates compared to similar print materials. However, the impact of the website intervention on screening compliance was minimal and the cost per additional person screened was high compared to other studies. The recruitment cost may be reduced with an automated system to determine eligibility for screening. The study relied on staff making multiple phone contacts to determine eligibility from a list of potentially eligible patients. The research context of the intervention contributed to the cost and therefore the cost estimates represent an upper bound of feasible cost in a practice setting. However, KSC was well organized and had partially automated patient records and appointment schedules that facilitated the study.
- The interventions were tested in a single multispecialty clinic thereby limiting the generalizability of the results. Time estimates for the project personnel were self-reported, but time logs were completed on a weekly or monthly basis throughout the trial. Overhead cost was calculated as a percent of the direct cost instead of exact measurement. However, analysis of uncertainty showed that a reasonable range of overhead costs had no substantive effect on the overall findings. While the randomized trial did not yield statistically significant results, the point estimates along with an analysis of uncertainty, provide valuable information for decision-making, which is not about testing hypotheses but about using the best available estimates of program effect and cost to inform decisions about resource allocation [30].
- More research is required to understand the cost and the effectiveness of tailoring and other methods to motivate patients to obtain recommended CRCS tests. This requires an assessment of system, physician and patient-centered efforts to educate patients and providers and to address any perceived barriers to screening [28]. Costs should be fully assessed, including the cost of planning and recruitment of eligible participants, overhead costs, and the cost of developing information for tailoring.
DISCUSSION
-
The authors have no conflicts of interest with the material presented in this paper.
-
This article is available at http://jpmph.org/.
Notes
- 1. Colon and rectal cancer. National Cancer Institute. cited 2011 Feb 17. Available from: http://www.cancer.gov/cancertopics/types/colon-and-rectal
- 2. Seifeldin R, Hantsch JJ. The economic burden associated with colon cancer in the United States. Clin Ther 1999;21(8):1370-1379. 10485508ArticlePubMed
- 3. Smith RA, von Eschenbach AC, Wender R, Levin B, Byers T, Rothenberger D, et al. American Cancer Society guidelines for the early detection of cancer: update of early detection guidelines for prostate, colorectal, and endometrial cancers. Also: update 2001-testing for early lung cancer detection. CA Cancer J Clin 2001;51(1):38-75. 11577479ArticlePubMed
- 4. Levin B, Lieberman DA, McFarland B, Smith RA, Brooks D, Andrews KS, et al. Screening and surveillance for the early detection of colorectal cancer and adenomatous polyps, 2008: a joint guideline from the American Cancer Society, the US Multi-Society Task Force on Colorectal Cancer, and the American College of Radiology. CA Cancer J Clin 2008;58(3):130-160. 18322143ArticlePubMed
- 5. Screening for colorectal cancer. US Preventive Services Task Force. cited 2011 Feb 17. Available from: http://www.uspreventiveservicestaskforce.org/uspstf/uspscolo.htm
- 6. Colorectal cancer screening tests. Centers for Disease Control and Prevention (CDC). cited 2011 Feb 17. Available from: http://www.cdc.gov/cancer/colorectal/basic_info/screening/tests.htm
- 7. Healthy people 2010 targets. Centers for Disease Control and Prevention (CDC). cited 2011 Feb 17. Available from: http://apps.nccd.cdc.gov/SAHA/Default/HealthyTargets.aspx
- 8. Transtheoretical model: detailed overview of the transtheoretical model. Cancer Prevention Research Center. cited 2011 Feb 17. Available from: http://www.uri.edu/research/cprc/TTM/detailedoverview.htm
- 9. Sequist TD, Zaslavsky AM, Marshall R, Fletcher RH, Ayanian JZ. Patient and physician reminders to promote colorectal cancer screening: a randomized controlled trial. Arch Intern Med 2009;169(4):364-371. 19237720ArticlePubMedPMC
- 10. Chirikos TN, Christman LK, Hunter S, Roetzheim RG. Cost-effectiveness of an intervention to increase cancer screening in primary care settings. Prev Med 2004;39(2):230-238. 15226030ArticlePubMed
- 11. Lairson DR, DiCarlo M, Myers RE, Wolf T, Cocroft J, Sifri R, et al. Cost-effectiveness of targeted and tailored interventions on colorectal cancer screening use. Cancer 2008;112(4):779-788. 18098272ArticlePubMed
- 12. Andersen MR, Urban N, Ramsey S, Briss PA. Examining the cost-effectiveness of cancer screening promotion. Cancer 2004;101(5 Suppl):1229-1238. 15316909ArticlePubMed
- 13. Vernon SW, Bartholomew LK, McQueen A, Bettencourt JL, Greisinger A, Coan SP, et al. A randomized controlled trial of a tailored interactive computer intervention to promote colorectal cancer screening: sometimes more is just the same. Ann Behav Med DOI: 10.1007/s12160-010-9258-5Article
- 14. Bartholomew LK, Parcel GS, Kok G. Intervention mapping: a process for developing theory and evidence-based health education programs. Health Educ Behav 1998;25(5):545-563. 9768376ArticlePubMed
- 15. Prochaska JO, DiClemente CC, Velicer WF, Rossi JS. Standardized, individualized, interactive, and personalized self-help programs for smoking cessation. Health Psychol 1993;12(5):399-405. 8223364ArticlePubMed
- 16. Velicer WF, Prochaska JO, Bellis JM, DiClemente CC, Rossi JS, Fava JL, et al. An expert system intervention for smoking cessation. Addict Behav 1993;18(3):269-290. 8342440ArticlePubMed
- 17. Lairson DR, Chang YC, Bettencourt JL, Vernon SW, Greisinger A. Estimating development cost for a tailored interactive computer program to enhance colorectal cancer screening compliance. J Am Med Inform Assoc 2006;13(5):476-484. 16799126ArticlePubMedPMC
- 18. Colorectal (colon) cancer: screen for life print materials. Centers for Disease Control and Prevention (CDC). cited 2011 Feb 17. Available from: http://www.cdc.gov/cancer/colorectal/sfl/print_materials.htm#factsheets
- 19. Andersen MR, Hager M, Su C, Urban N. Analysis of the cost-effectiveness of mammography promotion by volunteers in rural communities. Health Educ Behav 2002;29(6):755-770. 12456132ArticlePubMed
- 20. Drummond MF, Sculpher MJ, Torrance GW, O'brien BJ, Stoddart GL. Methods for the economic evaluation of health care programmes. 2005. New York: Oxford University Press
- 21. Briggs AH, Wonderling DE, Mooney CZ. Pulling cost-effectiveness analysis up by its bootstraps: a non-parametric approach to confidence interval estimation. Health Econ 1997;6(4):327-340. 9285227ArticlePubMed
- 22. Briggs A, Clark T, Wolstenholme J, Clarke P. Missing... presumed at random: cost-analysis of incomplete data. Health Econ 2003;12(5):377-392. 12720255ArticlePubMed
- 23. Albada A, Ausems MG, Bensing JM, van Dulmen S. Tailored information about cancer risk and screening: a systematic review. Patient Educ Couns 2009;77(2):155-171. 19376676ArticlePubMed
- 24. Myers RE, Sifri R, Hyslop T, Rosenthal M, Vernon SW, Cocroft J, et al. A randomized controlled trial of the impact of targeted and tailored interventions on colorectal cancer screening. Cancer 2007;110(9):2083-2091. 17893869ArticlePubMed
- 25. Ling BS, Schoen RE, Trauth JM, Wahed AS, Eury T, Simak DM, et al. Physicians encouraging colorectal screening: a randomized controlled trial of enhanced office and patient management on compliance with colorectal cancer screening. Arch Intern Med 2009;169(1):47-55. 19139323ArticlePubMed
- 26. Sequist TD, Franz C, Ayanian JZ. Cost-effectiveness of patient mailings to promote colorectal cancer screening. Med Care 2010;48(6):553-557. 20473196ArticlePubMedPMC
- 27. Godin G, Sheeran P, Conner M, Germain M. Asking questions changes behavior: mere measurement effects on frequency of blood donation. Health Psychol 2008;27(2):179-184. 18377136ArticlePubMed
- 28. Sarfaty M, Wender R. How to increase colorectal cancer screening rates in practice. CA Cancer J Clin 2007;57(6):354-366. 17989130ArticlePubMed
- 29. McQueen A, Bartholomew LK, Greisinger AJ, Medina GG, Hawley ST, Haidet P, et al. Behind closed doors: physician-patient discussions about colorectal cancer screening. J Gen Intern Med 2009;24(11):1228-1235. 19763699ArticlePubMedPMC
- 30. Briggs AH, O'Brien BJ. The death of cost-minimization analysis? Health Econ 2001;10(2):179-184. 11252048ArticlePubMed
REFERENCES
- Supplementary material
- Sensitivity analysis by varying inclusion of surveys
- Sensitivity analysis by varying inclusion of follow-up survey and overhead rate
- Sensitivity analysis by varying the percentage of HIC personnel cost
Appendix
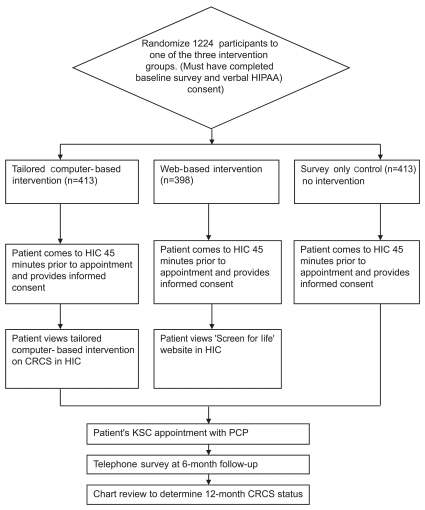
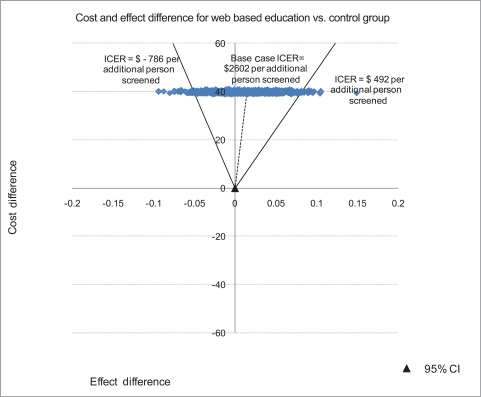

Figure & Data
References
Citations
- Extending analytic methods for economic evaluation in implementation science
Meghan C. O’Leary, Kristen Hassmiller Lich, Leah Frerichs, Jennifer Leeman, Daniel S. Reuland, Stephanie B. Wheeler
Implementation Science.2022;[Epub] CrossRef - Interventions for increasing colorectal cancer screening uptake among African-American men: A systematic review and meta-analysis
Charles R. Rogers, Phung Matthews, Lei Xu, Kenneth Boucher, Colin Riley, Matthew Huntington, Nathan Le Duc, Kola S. Okuyemi, Margaret J. Foster, Joseph Telfair
PLOS ONE.2020; 15(9): e0238354. CrossRef - Economic Evaluation of Tailored Web versus Tailored Telephone-Based Interventions to Increase Colorectal Cancer Screening among Women
David R. Lairson, Tong Han Chung, Danmeng Huang, Timothy E. Stump, Patrick O. Monahan, Shannon M. Christy, Susan M. Rawl, Victoria L. Champion
Cancer Prevention Research.2020; 13(3): 309. CrossRef - Economics of Multicomponent Interventions to Increase Breast, Cervical, and Colorectal Cancer Screening: A Community Guide Systematic Review
Giridhar Mohan, Sajal K. Chattopadhyay, Donatus U. Ekwueme, Susan A. Sabatino, Devon L. Okasako-Schmucker, Yinan Peng, Shawna L. Mercer, Anilkrishna B. Thota
American Journal of Preventive Medicine.2019; 57(4): 557. CrossRef - Colorectal cancer screening interventions in 2 health care systems serving disadvantaged populations: Screening uptake and cost‐effectiveness
Christen L. Lara, Kelly L. Means, Krystal D. Morwood, Westley R. Lighthall, Sonja Hoover, Florence K.L. Tangka, Cynthia French, Krystal D. Gayle, Amy DeGroff, Sujha Subramanian
Cancer.2018; 124(21): 4130. CrossRef - The cost of implementing two small media interventions to promote HPV vaccination
Siddharth S. Karanth, David R. Lairson, Danmeng Huang, Lara S. Savas, Sally W. Vernon, María E. Fernández
Preventive Medicine.2017; 99: 277. CrossRef - An Economic Evaluation of Colorectal Cancer Screening in Primary Care Practice
Richard T. Meenan, Melissa L. Anderson, Jessica Chubak, Sally W. Vernon, Sharon Fuller, Ching-Yun Wang, Beverly B. Green
American Journal of Preventive Medicine.2015; 48(6): 714. CrossRef - Optimising colorectal cancer screening acceptance: a review
Carlo Senore, John Inadomi, Nereo Segnan, Cristina Bellisario, Cesare Hassan
Gut.2015; 64(7): 1158. CrossRef - Get Screened: A Randomized Trial of the Incremental Benefits of Reminders, Recall, and Outreach on Cancer Screening
Robert J. Fortuna, Amna Idris, Paul Winters, Sharon G. Humiston, Steven Scofield, Samantha Hendren, Patricia Ford, Shirley X. L. Li, Kevin Fiscella
Journal of General Internal Medicine.2014; 29(1): 90. CrossRef - Public Awareness of Colorectal Cancer Screening: Knowledge, Attitudes, and Interventions for Increasing Screening Uptake
Antonio Z. Gimeno Garcia, Noemi Hernandez Alvarez Buylla, David Nicolas-Perez, Enrique Quintero
ISRN Oncology.2014; 2014: 1. CrossRef - Cost‐effectiveness of a standard intervention versus a navigated intervention on colorectal cancer screening use in primary care
David R. Lairson, Melissa DiCarlo, Ashish A. Deshmuk, Heather B. Fagan, Randa Sifri, Nora Katurakes, James Cocroft, Jocelyn Sendecki, Heidi Swan, Sally W. Vernon, Ronald E. Myers
Cancer.2014; 120(7): 1042. CrossRef - Communication preference moderates the effect of a tailored intervention to increase colorectal cancer screening among African Americans
Ken Resnicow, Yan Zhou, Sarah Hawley, Masahito Jimbo, Mack T. Ruffin, Rachel E. Davis, Deirdre Shires, Jennifer Elston Lafata
Patient Education and Counseling.2014; 97(3): 370. CrossRef - A lesson in business: cost-effectiveness analysis of a novel financial incentive intervention for increasing physical activity in the workplace
Mary Anne T Dallat, Ruth F Hunter, Mark A Tully, Karen J Cairns, Frank Kee
BMC Public Health.2013;[Epub] CrossRef - Personalised risk communication for informed decision making about taking screening tests
Adrian GK Edwards, Gurudutt Naik, Harry Ahmed, Glyn J Elwyn, Timothy Pickles, Kerry Hood, Rebecca Playle
Cochrane Database of Systematic Reviews.2013;[Epub] CrossRef - Colorectal Cancer in the Kingdom of Saudi Arabia: Need for Screening
Mahmoud H. Mosli, Mahmoud S. Al-Ahwal
Asian Pacific Journal of Cancer Prevention.2012; 13(8): 3809. CrossRef
 PubReader
 ePub Link
 Cite
Cite