Articles
- Page Path
- HOME > J Prev Med Public Health > Volume 45(3); 2012 > Article
-
Original Article
Association Between Serum Uric Acid Level and Metabolic Syndrome - Ju-Mi Lee1, Hyeon Chang Kim1,2,3, Hye Min Cho1, Sun Min Oh1, Dong Phil Choi1, Il Suh1
-
Journal of Preventive Medicine and Public Health 2012;45(3):181-187.
DOI: https://doi.org/10.3961/jpmph.2012.45.3.181
Published online: May 31, 2012
1Department of Preventive Medicine, Yonsei University College of Medicine, Seoul, Korea.
2Severance Institute for Vascular and Metabolic Research, Yonsei University College of Medicine, Seoul, Korea.
3Department of Preventive Medicine, Northwestern University Feinberg School of Medicine, Chicago, IL, USA.
- Corresponding author: Hyeon Chang Kim, MD, PhD. 50 Yonsei-ro, Seodaemun-gu, Seoul 120-752, Korea. Tel: +82-2-2228-1873, Fax: +82-2-392-8133, hckim@yuhs.ac
Copyright © 2012 The Korean Society for Preventive Medicine
This is an Open Access article distributed under the terms of the Creative Commons Attribution Non-Commercial License (http://creativecommons.org/licenses/by-nc/3.0/) which permits unrestricted non-commercial use, distribution, and reproduction in any medium, provided the original work is properly cited.
ABSTRACT
-
Objectives
- Serum uric acid levels have been reported to be associated with a variety of cardiovascular conditions. However, the direct association between uric acid levels and metabolic syndrome remains controversial. Thus, we evaluated the association of serum uric acid levels and metabolic syndrome in a community-based cohort study in Korea.
-
Methods
- We performed cross-sectional analysis of baseline data of 889 males and 1491 females (aged 38 to 87) who participated in baseline examinations of the Korean Genome and Epidemiology Study: Kanghwa study. Blood samples were collected after at least an 8 hour fast. Uric acid quartiles were defined as follows: <4.8, 4.8-<5.6, 5.6-<6.5, ≥6.5 mg/dL in males; and <3.8, 3.8-<4.3, 4.3-<5.1, ≥5.1 mg/dL in females. Metabolic syndrome was defined by the National Cholesterol Education Program Adult Treatment Panel III Criteria with adjusted waist circumference cutoffs (90 cm for males; 80 cm for females). The association between serum uric acid quartiles and metabolic syndrome was assessed using multivariate logistic regression.
-
Results
- The odds ratio for having metabolic syndrome in the highest versus lowest quartiles of serum uric acid levels was 2.67 (95% confidence interval [CI], 1.60 to 4.46) in males and 2.14 (95% CI, 1.50 to 3.05) in females after adjusting for age, smoking, alcohol intake, body mass index, total cholesterol, HbA1c, albumin, γ-glutamyltransferase, blood urea nitrogen, and log C-reactive protein. The number of metabolic abnormalities also increased gradually with increasing serum uric acid levels (adjusted p for trend < 0.001 in both sexes).
-
Conclusions
- Higher serum uric acid levels are positively associated with the presence of metabolic syndrome in Korean males and females.
- The relationship between serum uric acid levels and a variety of cardiovascular conditions have been reported since the early 1960s [1]. Metabolic syndrome is defined by a clustering of risk factors for cardiovascular disease [2,3]. An increasing prevalence of metabolic syndrome has been reported in Korea [4,5]. The higher serum uric acid level of hyperuricemia has been associated with metabolic syndrome in studies of health screenees [3,6-9] and in nationwide surveys [10,11]. However, the direct association between uric acid levels and metabolic syndrome remains controversial, and most clinical guidelines do not recommend treating asymptomatic hyperuricemia [12]. Moreover, serum uric acid levels within a normal to high range have not been fully evaluated in association with metabolic syndrome. Therefore, we evaluated the association of serum uric acid levels with metabolic syndrome in a rural population in Korea.
INTRODUCTION
- I. Participants
- This study is a cross-sectional analysis of baseline data of a community-based prospective cohort, which started in 2006 on Kanghwa Island, South Korea. This analysis enrolled participants who attended a health examination in 2008 or 2009 because serum uric acid testing has been available since 2008. Among the initial total of 2396 participants, we excluded 8 participants because their uric acid levels were not measured. An additional 8 participants were excluded for the following reasons: absence of systolic blood pressure (SBP) or <60 mmHg, absence of diastolic blood pressure (DBP) or <40 mmHg, absence of pulse rates or >700 beats/min or <30 beats/min, and triglycerides >1500 mg/dL. A final total of 2380 participants (male 889, female 1491) were enrolled in this study. All participants signed written informed consent forms, and the Institutional Review Board approved the study protocol.
- II. Definition of Metabolic Syndrome
- Metabolic syndrome was determined according to the criteria of the National Cholesterol Education Program Adult Treatment Panel III, except for waist circumference, where the Asian cutoffs were used. Thus, metabolic syndrome was defined as the presence of three or more of the following five criteria: 1) waist circumference ≥ 90 cm in males and ≥80 cm in females, 2) triglycerides ≥150 mg/dL or under treatment for elevated triglycerides, 3) high-density lipoprotein (HDL)-cholesterol < 40 mg/dL in males and < 50 mg/dL in females or under treatment for reduced HDL, 4) SBP ≥130 mmHg or DBP ≥85 mmHg or under treatment for hypertension, and 5) fasting glucose ≥100 mg/dL or under treatment for elevated glucose [13].
- III. Measuring Study Variables
- Detailed methods for the measurements used in the Korean Genome and Epidemiology Study: Kanghwa study were previously reported elsewhere [14-16]. Trained personnel measured the anthropometric variables according to the written protocol. Waist circumference was measured on a horizontal plane midway between the inferior margin of the ribs and the superior border of the iliac crest using a tape measure (SECA-200; SECA, Hamburg, Germany). Resting blood pressure was measured twice with at least 5 minute intervals using an automatic sphygmomanometer (Dinamap 1846 SX/P; GE Healthcare, Waukesha, WI, USA). If the difference between the first and second measurement was more than 10 mmHg, then repeated measurements were performed. The average of the last two measurements was used for the analysis. Blood samples were collected from the antecubital vein after at least an 8 hour fast. Enzymatic methods were applied to measure fasting plasma glucose, serum uric acid, triglycerides, total cholesterol, and HDL cholesterol (ADVIA 1650; Siemens Healthcare Diagnostics Inc., Deerfield, IL, USA). Serum uric acid levels were divided into separate quartiles for males and females. Sex-specific serum uric acid quartiles were used as follows: <4.8, 4.8-<5.6, 5.6-<6.5, ≥6.5 mg/dL in males; and <3.8, 3.8-<4.3, 4.3-<5.1, ≥5.1 mg/dL in females.
- IV. Statistical Analysis
- Prior to performing statistical analysis, the levels of triglycerides, fasting glucose, and C-reactive protein were log-transformed because of the skewed distribution. The differences between the investigated variables' means according to sex-specific serum uric acid quartiles were tested using the chi-squared test and analysis of variance. The relationships between serum uric acid levels and other variables were assessed using the Pearson's correlation coefficients. The trend test was performed to determine the trends with the number of metabolic abnormalities and prevalence of metabolic syndrome according to the serum uric acid quartile. The association between the sex-specific serum uric acid quartile and metabolic syndrome were tested using multivariate logistic regression analysis. We calculated the unadjusted and adjusted odds ratios (ORs) using the lowest quartile as the reference. In the adjusted model, we controlled age, smoking status (current smoker vs. others), alcohol intake (current drinker vs. others), body mass index (BMI), total cholesterol, HbA1c, albumin, blood urea nitrogen (BUN), γ-glutamyltransferase, and log C-reactive protein. Controlled variables were selected based on the following criteria. Age, smoking status, alcohol intake, and BMI were first selected after the literature had been reviewed, whereas sex was stratified. The variables that did not exceed 0.3 of the correlation p-value were then contained, after which the stepwise method was used. BUN was then additionally adjusted as a marker of kidney function. All statistical analyses were performed using SAS version 9.2.0 (SAS Inc., Cary, NC, USA). We used a two-tailed test, and a value of p<0.05 was considered to be statistically significant.
METHODS
- The characteristics of the study participants are summarized in Table 1 according to the sex-specific quartile of the serum uric acid levels. The age distribution was different for males and females. The higher quartiles of serum uric acid levels tended to be associated with younger ages in males, but older ages in females.
- I. Relationship Between Serum Uric Acid Level and Investigated Variables
- Serum uric acid levels had positive correlations with waist circumference, BMI, SBP, total protein, albumin, aspartate aminotransferase, alanine aminotransferase, γ-glutamyltransferase, BUN, creatinine, log triglycerides, fasting insulin, and log C-reactive protein and an inverse correlation with HDL-cholesterol level in both sexes (Table 2). Age was negatively correlated with serum uric acid in males, but positively correlated in females. The pulse rate was positively correlated with serum uric acid in males (coefficient 0.087, p-value 0.010). However, total cholesterol, fasting glucose, and HbA1c were positively correlated with serum uric acid in females.
- II. Association Between Serum Uric Acid Quartiles and Metabolic Syndrome
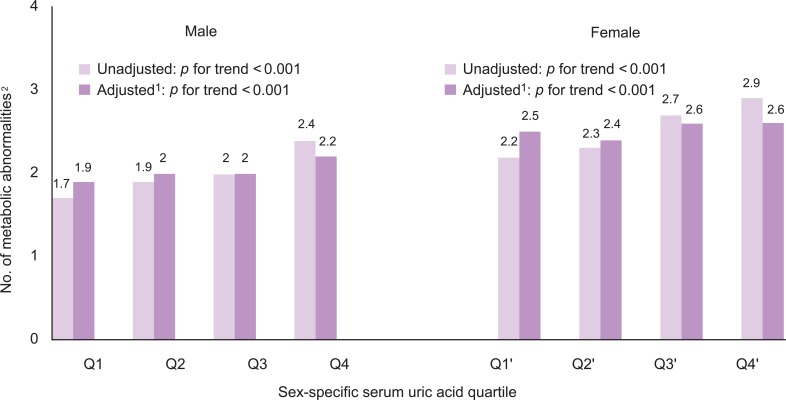
- The number of metabolic abnormalities according to the serum uric acid quartile is shown in Figure 1. The number of metabolic syndrome components increased gradually with increasing serum uric acid quartile before (p for trend <0.001 in both sexes) and after adjustment (p for trend <0.001 in both sexes). The prevalence of metabolic syndrome also increased gradually with an increasing serum uric acid quartile before (p for trend <0.001 in both sexes) and after adjustment (p for trend <0.001 in both sexes) in Figure 2.
- The highest quartile had a higher OR for metabolic syndrome than the lowest quartile after adjusting for age, smoking, alcohol intake, BMI, total cholesterol, HbA1c, albumin, BUN, γ-glutamyltransferase, and log C-reactive protein in both sexes (Table 3). Presence of metabolic syndrome significantly increased in the second, third, and fourth quartiles of serum uric acid levels in males, but at the third and fourth quartiles of serum uric acid levels in females.
RESULTS
- We evaluated the associations of serum uric acid levels with metabolic syndrome in a rural population in Korea. We found that higher serum uric acid levels, even within the normal ranges, were associated with an increased prevalence of metabolic syndrome in both sexes even after adjusting for confounding factors.
- Uric acid is the final product of purine metabolism and is excreted via the urine in higher primates [17,18]. Particularly in humans, over half of the antioxidant capacity of blood plasma comes from uric acid [18]. Reports have shown that serum uric acid levels have been increasing since 1960s in the US population, and this is possibly associated with the cardiovascular disease epidemic that has occurred over the last 100 years [19]. There is increasing evidence that uric acid plays a role in the development of metabolic syndrome. Animal studies have shown that decreasing uric acid levels may prevent or reverse the course of metabolic syndrome. One of the possible biological mechanisms is related to insulin-stimulated endothelial nitric oxide synthesis. Insulin-stimulated endothelial nitric oxide synthase (eNOS) regulates blood flow, influencing glucose uptake in skeletal muscle [1]. Animal studies have also shown that hyperuricemia caused by eNOS, and impaired eNOS, are associated with metabolic syndrome [1,20,21]. Another study showed that treatment for hyperuricemia patients improved endothelial dysfunction [1,22]. Therefore, we suggest that hyperuricemia could induce endothelial cell dysfunction and contribute to the development of metabolic syndrome. Another possible mechanism is related to inflammation and oxidative stress. Uric acid in adipocytes of obese mice induced inflammatory oxidative changes: hence the resulting development of metabolic syndrome [23-25].
- Our findings are, in general, consistent with previous reports [3,6-11], but can be distinguished from them. First, our study population consisted of community-dwellers rather than institutionalized patients or health screenees, thereby potentially reducing selection bias.
- Second, our study showed that higher serum uric acid levels, even within the normal ranges, were associated with metabolic syndrome. Serum uric acid levels ranged from 0.6 to 10.8 mg/dL in our participants. Most previous studies have investigated the association between frank hyperuricemia (defined as more than 6 mg/dL in females and more than 7 mg/dL in males) [1,9,10,26-28] with metabolic syndrome. Third, we investigated the association between serum uric acid level and metabolic syndrome in males and females separately, and the strength of association differed between sexes (Table 3). Fasting glucose and HbA1c were positively correlated with serum uric acid only in females, but not in males (Table 2). We cannot clearly explain these differences by sex; however, one of the possible explanations for the differences might be a nonlinear relationship between uric acid level and glucose metabolism. Serum uric acid levels have different distributions in males and females. The range of the second quartile in males (4.8-<5.6 mg/dL) is similar to that of the third quartile in females (4.3-<5.1 mg/dL). Moreover, there might be different distributions of serum uric acid levels for men and women with diabetes, prediabetes, and using anti-diabetic medication. If serum uric acid levels have non-linear relationships with diabetes or metabolic syndrome, then the direction and strength of association could be different for males and females. A previous study reported an inverse U-shaped association between fasting glucose and uric acid levels; fasting glucose levels lower than 8.0 mmol/L were positively associated with uric acid, but glucose levels higher than 8.0 mmol/L were inversely associated [29].
- Because this study is limited due to its cross-sectional nature, we could not assess temporal relationships. It is also possible that residual or unmeasured confounding variables may exist. Some information was unavailable from the data used in this study, such as history of gout or kidney diseases, which might have influenced the serum uric acid levels. Therefore, we adjusted for BUN as an alternative marker of kidney function. However, further prospective investigations are required to fully understand the causal relationship between serum uric acid levels and the development of metabolic syndrome.
- Our results suggest that individuals with high normal uric acid levels or asymptomatic hyperuricemia are at risk of metabolic syndrome. Intensive lifestyle modifications may be required for such individuals. Currently, most health screening examinations include a serum uric acid test, but physicians do not pay attention to uric acid levels unless the screenees have symptoms of gout. Physicians should explain the risks of metabolic syndrome or cardiovascular disease to individuals with high uric acid levels and recommend lifestyle modifications or consider preventive medical intervention.
- In conclusion, higher serum uric acid levels are positively associated with the presence of metabolic syndrome in Korean males and females.
DISCUSSION
ACKNOWLEDGEMENTS
-
The authors have no conflicts of interest with the material presented in this paper.
-
This article is available at http://jpmph.org/.
Notes
- 1. Feig DI, Kang DH, Johnson RJ. Uric acid and cardiovascular risk. N Engl J Med 2008;359(17):1811-1821. 18946066ArticlePubMedPMC
- 2. Kim HC, Kang DR, Choi KS, Nam CM, Thomas GN, Suh I. Spousal concordance of metabolic syndrome in 3141 Korean couples: a nationwide survey. Ann Epidemiol 2006;16(4):292-298. 16230025ArticlePubMed
- 3. Oh HJ, Moon SH, Lee JW, Hyun HY, Lee DC, Lee HR. Relationship between serum uric acid and metabolic syndrome. J Korean Acad Fam Med 2006;27(9):699-705. (Korean)
- 4. Lim S, Park KS, Lee HK, Cho SI. Korean National Health and Nutrition Examination Surveys. Changes in the characteristics of metabolic syndrome in Korea over the period 1998-2001 as determined by Korean National Health and Nutrition Examination Surveys. Diabetes Care 2005;28(7):1810-1812. 15983345ArticlePubMed
- 5. Lim S, Shin H, Song JH, Kwak SH, Kang SM, Won Yoon J, et al. Increasing prevalence of metabolic syndrome in Korea: the Korean National Health and Nutrition Examination Survey for 1998-2007. Diabetes Care 2011;34(6):1323-1328. 21505206ArticlePubMedPMC
- 6. Ishizaka N, Ishizaka Y, Toda E, Nagai R, Yamakado M. Association between serum uric acid, metabolic syndrome, and carotid atherosclerosis in Japanese individuals. Arterioscler Thromb Vasc Biol 2005;25(5):1038-1044. 15746438ArticlePubMed
- 7. Lim JH, Kim YK, Kim YS, Na SH, Rhee MY, Lee MM. Relationship between serum uric acid levels, metabolic syndrome, and arterial stiffness in Korean. Korean Circ J 2010;40(7):314-320. 20664739ArticlePubMedPMC
- 8. Lin SD, Tsai DH, Hsu SR. Association between serum uric acid level and components of the metabolic syndrome. J Chin Med Assoc 2006;69(11):512-516. 17116612ArticlePubMed
- 9. Kim SK, Park HA, Nam OY, Beck SH, Whang DH, Hwang UK, et al. Risk of the metabolic syndrome according to the level of the uric acid. J Korean Acad Fam Med 2007;28(6):428-435. (Korean)
- 10. Choi HK, Ford ES. Prevalence of the metabolic syndrome in individuals with hyperuricemia. Am J Med 2007;120(5):442-447. 17466656ArticlePubMed
- 11. Onat A, Uyarel H, Hergenc G, Karabulut A, Albayrak S, Sari I, et al. Serum uric acid is a determinant of metabolic syndrome in a population-based study. Am J Hypertens 2006;19(10):1055-1062. 17027827ArticlePubMed
- 12. Longo DL, Kasper DL, Braunwald E, Fauci AS, Harrison TR, Hauser SL, et al. Harrison's principles of internal medicine. 2008. 17th ed. New York: McGraw-Hill Medical; p. 2447
- 13. Grundy SM, Cleeman JI, Daniels SR, Donato KA, Eckel RH, Franklin BA, et al. Diagnosis and management of the metabolic syndrome: an American Heart Association/National Heart, Lung, and Blood Institute Scientific Statement. Circulation 2005;112(17):2735-2752. 16157765ArticlePubMed
- 14. Lee JY, Ahn SV, Choi DP, Suh M, Kim HC, Kim YS, et al. Association between hypertension and pulmonary function in rural adults in Korea. J Prev Med Public Health 2009;42(1):21-28. (Korean). 19229121ArticlePubMedPDF
- 15. Oh SM, Kim HC, Ahn SV, Chi HJ, Suh I. Association between meat consumption and carotid intima-media thickness in Korean adults with metabolic syndrome. J Prev Med Public Health 2010;43(6):486-495. 21139409ArticlePubMedPDF
- 16. Suh M, Lee JY, Ahn SV, Kim HC, Suh I. C-reactive protein and carotid intima-media thickness in a population of middle-aged Koreans. J Prev Med Public Health 2009;42(1):29-34. (Korean). 19229122ArticlePubMedPDF
- 17. Kang DH. Potential role of uric Acid as a risk factor for cardiovascular disease. Korean J Intern Med 2010;25(1):18-20. 20195398ArticlePubMedPMC
- 18. Uric acid. Wikipedia. cited 2011 Mar 4. Available from: http://en.wikipedia.org/wiki/Uric_acidArticle
- 19. Glynn RJ, Campion EW, Silbert JE. Trends in serum uric acid levels 1961-1980. Arthritis Rheum 1983;26(1):87-93. 6824508ArticlePubMed
- 20. Khosla UM, Zharikov S, Finch JL, Nakagawa T, Roncal C, Mu W, et al. Hyperuricemia induces endothelial dysfunction. Kidney Int 2005;67(5):1739-1742. 15840020ArticlePubMed
- 21. Cook S, Hugli O, Egli M, Vollenweider P, Burcelin R, Nicod P, et al. Clustering of cardiovascular risk factors mimicking the human metabolic syndrome X in eNOS null mice. Swiss Med Wkly 2003;133(25-26):360-363. 12947532ArticlePubMed
- 22. Mercuro G, Vitale C, Cerquetani E, Zoncu S, Deidda M, Fini M, et al. Effect of hyperuricemia upon endothelial function in patients at increased cardiovascular risk. Am J Cardiol 2004;94(7):932-935. 15464681ArticlePubMed
- 23. Sautin YY, Nakagawa T, Zharikov S, Johnson RJ. Adverse effects of the classic antioxidant uric acid in adipocytes: NADPH oxidase-mediated oxidative/nitrosative stress. Am J Physiol Cell Physiol 2007;293(2):C584-C596. 17428837ArticlePubMed
- 24. Furukawa S, Fujita T, Shimabukuro M, Iwaki M, Yamada Y, Nakajima Y, et al. Increased oxidative stress in obesity and its impact on metabolic syndrome. J Clin Invest 2004;114(12):1752-1761. 15599400ArticlePubMedPMC
- 25. Cheung KJ, Tzameli I, Pissios P, Rovira I, Gavrilova O, Ohtsubo T, et al. Xanthine oxidoreductase is a regulator of adipogenesis and PPARgamma activity. Cell Metab 2007;5(2):115-128. 17276354ArticlePubMed
- 26. Feig DI, Johnson RJ. Hyperuricemia in childhood primary hypertension. Hypertension 2003;42(3):247-252. 12900431ArticlePubMedPMC
- 27. Niskanen LK, Laaksonen DE, Nyyssonen K, Alfthan G, Lakka HM, Lakka TA, et al. Uric acid level as a risk factor for cardiovascular and all-cause mortality in middle-aged men: a prospective cohort study. Arch Intern Med 2004;164(14):1546-1551. 15277287ArticlePubMed
- 28. Nakagawa T, Tuttle KR, Short RA, Johnson RJ. Hypothesis: fructose-induced hyperuricemia as a causal mechanism for the epidemic of the metabolic syndrome. Nat Clin Pract Nephrol 2005;1(2):80-86. 16932373ArticlePubMed
- 29. Cook DG, Shaper AG, Thelle DS, Whitehead TP. Serum uric acid, serum glucose and diabetes: relationships in a population study. Postgrad Med J 1986;62(733):1001-1006. 3628142ArticlePubMedPMC
REFERENCES


| Variables |
Serum uric acid quartile (mg/dL) |
p - value | |||
|---|---|---|---|---|---|
| < 4.8 (n = 197) | 4.8 - < 5.6 (n = 225) | 5.6 - < 6.5 (n = 230) | ≥ 6.5 (n = 237) | ||
| Male (n=889) | |||||
| Age (y) | 61.1±7.9 | 59.3±8.3 | 58.8±7.5 | 58.4 ±8.5 | 0.003 |
| Body mass index (kg/m2) | 23.8±3.0 | 24.0±2.7 | 24.7±2.7 | 25.3±2.9 | <0.001 |
| Waist circumference (cm) | 85.6±7.8 | 86.2±7.4 | 87.5±6.8 | 89.1±7.2 | <0.001 |
| SBP (mmHg) | 120.7±16.6 | 122.6±15.3 | 121.3±16.1 | 123.3±17.0 | 0.32 |
| DBP (mmHg) | 75.1±9.3 | 77.0±9.4 | 77.8±9.7 | 78.6±9.1 | 0.001 |
| Total protein (g/dL) | 7.4±0.4 | 7.4±0.4 | 7.5±0.4 | 7.6±0.4 | <0.001 |
| Albumin (g/dL) | 4.4±0.3 | 4.5±0.2 | 4.5±0.2 | 4.5±0.3 | 0.008 |
| Aspartate aminotransferase (IU/L) | 25.9±11.1 | 27.0±15.4 | 26.5±8.6 | 29.5±14.4 | 0.02 |
| Alanine transaminase (IU/L) | 25.3±14.6 | 27.0±23.6 | 27.3±13.2 | 30.1±17.3 | 0.04 |
| γ-glutamyltransferase (IU/L) | 44.0±65.6 | 42.1±85.2 | 41.5±42.7 | 60.3±86.9 | 0.01 |
| Total bilirubin (mg/dL) | 0.94±0.33 | 0.97±0.35 | 0.96±0.38 | 0.97±0.39 | 0.89 |
| Blood urea nitrogen (mg/dL) | 16.3±4.0 | 16.4±4.7 | 16.6±4.3 | 17.2±5.0 | 0.13 |
| Creatinine (mg/dL) | 0.99±0.12 | 1.02±0.12 | 1.05±0.13 | 1.11±0.24 | <0.001 |
| HDL cholesterol (mg/dL) | 43.1±10.8 | 42.9±9.8 | 42.4±9.8 | 40.4±9.2 | 0.003 |
| Total cholesterol (mg/dL) | 189.0±32.8 | 190.1±31.9 | 194.6±34.2 | 189.5±33.8 | 0.25 |
| Triglycerides (mg/dL) | 140.2±110.9 | 157.0±119.5 | 159.0±90.1 | 198.7±139.5 | <0.001 |
| Fasting glucose (mg/dL) | 101.8±27.1 | 98.2±20.5 | 96.7±18.4 | 99.1±19.1 | 0.12 |
| HbA1c (%) | 5.8±1.1 | 5.7±0.8 | 5.6±0.8 | 5.7±0.8 | 0.10 |
| Insulin (uIU/mL) | 7.6±3.1 | 8.0±3.5 | 8.1±3.3 | 8.6±3.2 | 0.02 |
| C-reactive protein (mg/dL) | 1.9±5.1 | 1.6±5.0 | 1.6±3.6 | 1.6±2.9 | 0.91 |
| Smoking status | |||||
| Non-smoker | 144 (73.10) | 163 (72.44) | 166 (72.17) | 180 (75.95) | 0.781 |
| Current smoker | 53 (26.90) | 62 (27.56) | 64 (27.83) | 57 (24.05) | |
| Drinking status | |||||
| Non-drinker | 105 (53.30) | 87 (38.67) | 89 (38.70) | 72 (30.38) | 0.0011 |
| Current drinker | 92 (46.70) | 138 (61.33) | 141 (61.30) | 165 (69.62) | |
|
|
|||||
| Variables |
Serum uric acid quartile (mg/dL) |
p - value | |||
| < 3.8 (n = 368) | 3.8 - < 4.3 (n = 327) | 4.3 - < 5.1 (n = 414) | ≥ 5.1 (n = 382) | ||
|
|
|||||
| Female (n=1491) | |||||
| Age (y) | 56.3±8.1 | 56.1±8.1 | 57.2±8.0 | 59.0±8.0 | <0.001 |
| Body mass index (kg/m2) | 23.9±3.0 | 24.5±2.9 | 24.9±3.3 | 25.9±3.5 | <0.001 |
| Waist circumference (cm) | 85.4±8.9 | 87.0±8.0 | 87.9±7.9 | 90.1±8.7 | <0.001 |
| SBP (mmHg) | 118.4±17.7 | 118.1±16.7 | 119.8±16.7 | 123.1±18.6 | <0.001 |
| DBP (mmHg) | 70.2±10.1 | 71.3±9.2 | 72.1±9.8 | 73.0±9.6 | 0.001 |
| Total protein (g/dL) | 7.4±0.4 | 7.4±0.4 | 7.5±0.4 | 7.5±0.4 | <0.001 |
| Albumin (g/dL) | 4.5±0.2 | 4.5±0.2 | 4.5±0.2 | 4.5±0.2 | 0.01 |
| Aspartate aminotransferase (IU/L) | 22.8±7.7 | 22.3±5.9 | 23.5±6.4 | 24.4±8.2 | 0.001 |
| Alanine transaminase (IU/L) | 20.3±11.9 | 19.5±8.2 | 21.2±9.5 | 23.2±12.2 | <0.001 |
| γ-glutamyltransferase (IU/L) | 18.6±22.2 | 17.5±13.5 | 20.7±36.6 | 27.2±58.6 | 0.002 |
| Total bilirubin (mg/dL) | 0.84±0.30 | 0.83±0.30 | 0.83±0.43 | 0.80±0.28 | 0.30 |
| Blood urea nitrogen (mg/dL) | 14.5±3.9 | 15.2±3.9 | 15.2±4.2 | 16.3±4.4 | <0.001 |
| Creatinine (mg/dL) | 0.82±0.10 | 0.83±0.09 | 0.85±0.09 | 0.92±0.16 | <0.001 |
| HDL cholesterol (mg/dL) | 47.2±10.7 | 46.0±10.4 | 44.1±9.9 | 43.1±9.9 | <0.001 |
| Total cholesterol (mg/dL) | 199.6±37.2 | 197.8±32.7 | 202.0±34.2 | 206.8±39.1 | 0.006 |
| Triglycerides (mg/dL) | 121.8±72.0 | 121.1±59.3 | 145.2±82.8 | 166.0±89.7 | <0.001 |
| Fasting glucose (mg/dL) | 94.0±24.3 | 94.7±18.2 | 95.9±16.8 | 97.7±27.9 | 0.11 |
| HbA1c (%) | 5.6±0.8 | 5.6±0.9 | 5.7±0.7 | 5.9±1.0 | <0.001 |
| Insulin (uIU/mL) | 8.2±3.0 | 8.4±3.4 | 8.8±3.5 | 9.6±3.9 | <0.001 |
| C-reactive protein (mg/dL) | 1.3±3.8 | 1.2±4.2 | 1.4±2.4 | 1.8±2.4 | 0.10 |
| Smoking status | |||||
| Non-smoker | 363 (98.64) | 324 (99.08) | 408 (98.55) | 368 (96.34) | 0.031 |
| Current smoker | 5 (1.36) | 3 (0.92) | 6 (1.45) | 14 (3.66) | |
| Drinking status | |||||
| Non-drinker | 274 (74.46) | 253 (77.37) | 310 (74.88) | 281 (73.56) | 0.691 |
| Current drinker | 94 (25.54) | 74 (22.63) | 104 (25.12) | 101 (26.44) | |
| Serum uric acid quartile (mg/dL) |
Odds ratio (95% confidence interval) for metabolic syndrome |
|
|---|---|---|
| Unadjusted | Adjusted1 | |
| Male | ||
| 1st (<4.8) | 1.00 | 1.00 |
| 2nd (4.8-<5.6) | 1.38 (0.91, 2.09) | 1.72 (1.03, 2.88) |
| 3rd (5.6-<6.5) | 1.70 (1.13, 2.56) | 1.94 (1.17, 3.22) |
| 4th (≥6.5) | 2.67 (1.78, 4.00) | 2.67 (1.60, 4.46) |
| Female | ||
| 1st (<3.8) | 1.00 | 1.00 |
| 2nd (3.8-<4.3) | 0.99 (0.73, 1.34) | 0.86 (0.61, 1.23) |
| 3rd (4.3-<5.1) | 2.00 (1.50, 2.66) | 1.62 (1.16, 2.25) |
| 4th (≥5.1) | 3.32 (2.46, 4.48) | 2.14 (1.50, 3.05) |
Figure & Data
References
Citations
- Associations of triglyceride-glucose index with hyperuricemia among Royal Thai Army personnel
Sethapong Lertsakulbunlue, Tanatip Sangkool, Varathpavee Bhuriveth, Mathirut Mungthin, Ram Rangsin, Anupong Kantiwong, Boonsub Sakboonyarat
BMC Endocrine Disorders.2024;[Epub] CrossRef - Association of hyperuricemia with metabolic syndrome and its components in an adult population of Faisalabad, Pakistan
Rameen Shahid, Misbah Hussain, Muhammad Umer Ghori, Ahmed Bilal, Fazli Rabbi Awan
Nutrition, Metabolism and Cardiovascular Diseases.2024; 34(6): 1554. CrossRef - Serum uric acid significantly improves the accuracy of cardiovascular risk score models
Yonatan Moshkovits, Shmuel Tiosano, Alon Kaplan, Maia Kalstein, Gabriella Bayshtok, Shaye Kivity, Shlomo Segev, Ehud Grossman, Amit Segev, Elad Maor, Alexander Fardman
European Journal of Preventive Cardiology.2023; 30(7): 524. CrossRef - Association between Neck Circumference and Serum Uric Acid Level in Korean Adults over 40 Years Old: Based on the 2019 Korea National Health and Nutrition Examination Survey
Myeong Jin Lee, Hye Rim Hwang, Youn Mi Kim, Ki Woo Kim
Korean Journal of Family Practice.2023; 13(1): 8. CrossRef - Correlation of Salivary Uric Acid and Cardiac Autonomic Modulation in Metabolic Syndrome Population
Bhagyashree N, Ganesh M, Ramaswamy C
Research Journal of Pharmacy and Technology.2023; : 1347. CrossRef - Dietary polyglycosylated anthocyanins, the smart option? A comprehensive review on their health benefits and technological applications
Jingren He, Shuxin Ye, Patrícia Correia, Iva Fernandes, Rui Zhang, Muci Wu, Victor Freitas, Nuno Mateus, Hélder Oliveira
Comprehensive Reviews in Food Science and Food Safety.2022;[Epub] CrossRef - Pharmacokinetics, Mass Balance, and Metabolism of the Novel Urate Transporter 1 Inhibitor [14C]HR011303 in Humans: Metabolism Is Mediated Predominantly by UDP-Glucuronosyltransferase
Yuandong Zheng, Hua Zhang, Mengling Liu, Guangze Li, Sheng Ma, Zhe Zhang, Hongda Lin, Yan Zhan, Zhendong Chen, Dafang Zhong, Liyan Miao, Xingxing Diao
Drug Metabolism and Disposition.2022; 50(6): 798. CrossRef - Seaweed sulfated polysaccharides and their medicinal properties
Oxana Olegovna Zaitseva, Marta Igorevna Sergushkina, Andrey Nikolaevich Khudyakov, Tatyana Vitalyevna Polezhaeva, Olga Nurzadinovna Solomina
Algal Research.2022; 68: 102885. CrossRef - Design, synthesis, and biological studies of dual URAT1 inhibitor and FXR agonist based on benzbromarone
Wanqiu Huang, Shixuan Jiao, Siliang Chen, Ya Chen, Zhongcheng Yang, Wenxin Wang, Zhijun Cao, Zheng Li, Luyong Zhang
Bioorganic & Medicinal Chemistry.2022; 75: 117073. CrossRef - Extract of Aster glehni ameliorates potassium oxonate-induced hyperuricemia by modulating renal urate transporters and renal inflammation by suppressing TLR4/MyD88 signaling
Jeongho Jeong, Mi Kyung Lim, Eun Hye Han, Sang-Ho Lee, Seongman Kang, Soyeon Lee
Food Science and Biotechnology.2022; 31(13): 1729. CrossRef - High Prevalence of Prediabetes and Associated Risk Factors in Urban Areas of Pontianak, Indonesia: A Cross-Sectional Study
Indah Budiastutik, Martha I. Kartasurya, Hertanto W. Subagio, Bagoes Widjanarko, Mayank Choubey
Journal of Obesity.2022; 2022: 1. CrossRef - The association of serum uric acid with metabolic syndrome and its components—From a single‐clinical centre in China
Jian Xu, Chengcheng Liu, Li Fu, Li Li, Tingting Wang
International Journal of Clinical Practice.2021;[Epub] CrossRef - Can biomarkers be used to improve diagnosis and prediction of metabolic syndrome in childhood cancer survivors? A systematic review
Vincent G. Pluimakers, Selveta S. van Santen, Marta Fiocco, Marie‐Christine E. Bakker, Aart J. van der Lelij, Marry M. van den Heuvel‐Eibrink, Sebastian J. C. M. M. Neggers
Obesity Reviews.2021;[Epub] CrossRef - Identification of biomarkers of brown adipose tissue aging highlights the role of dysfunctional energy and nucleotide metabolism pathways
Carola Mancini, Sabrina Gohlke, Francisco Garcia-Carrizo, Vyacheslav Zagoriy, Heike Stephanowitz, Tim J. Schulz
Scientific Reports.2021;[Epub] CrossRef - Peculiarities of Metabolic Factors of Cardiovascular Risk in Essential Hypertension Patients depending on Body Weight and Gender
N. S. Bek, O. M. Radchenko, L. V. Olenych
Ukraïnsʹkij žurnal medicini, bìologìï ta sportu.2020; 5(1): 96. CrossRef - Associations of Serum Uric Acid with Endogenous Cholesterol Synthesis Indices in Men with High Cardiometabolic Risk
Marek Vecka, Aleš Žák, Eva Tvrzická, Magdalena Dušejovská, Barbora Staňková, Miroslav Zeman
Metabolic Syndrome and Related Disorders.2020; 18(4): 212. CrossRef - Association of Serum Uric Acid with cardio-metabolic risk factors and metabolic syndrome in seafarers working on tankers
Fereshteh Baygi, Kimmo Herttua, Ali Sheidaei, Alireza Ahmadvand, Olaf Chresten Jensen
BMC Public Health.2020;[Epub] CrossRef - The association between serum uric acid level and the risk of cognitive impairment after ischemic stroke
Jing Sun, Xinhuang Lv, Xinxin Gao, Zewei Chen, Dianhui Wei, Yi Ling, Junmei Zhang, Qilu Gu, Jiaming Liu, Weian Chen, Suzhi Liu
Neuroscience Letters.2020; 734: 135098. CrossRef - The Association Between Metabolic Syndrome and Serum Concentrations of Micronutrients, Inflammation, and Oxidative Stress Outside of the Clinical Reference Ranges: A Cross-Sectional Study
Thirumagal Kanagasabai, Khloud Alkhalaqi, James R. Churilla, Chris I. Ardern
Metabolic Syndrome and Related Disorders.2019; 17(1): 29. CrossRef - Chicory (Cichorium intybus L.) inhibits renal reabsorption by regulating expression of urate transporters in fructose-induced hyperuricemia
Yu Wang, Zhijian Lin, Bing Zhang, Xiao Wang, Mengzhen Chu
Journal of Traditional Chinese Medical Sciences.2019; 6(1): 84. CrossRef - Uric Acid Levels Correlate with Sensory Nerve Function in Healthy Subjects
Alon Abraham, Hans D. Katzberg, Leif E. Lovblom, Bruce A. Perkins, Vera Bril
Canadian Journal of Neurological Sciences / Journal Canadien des Sciences Neurologiques.2019; 46(3): 337. CrossRef - Novel urate transporter 1 (URAT1) inhibitors: a review of recent patent literature (2016–2019)
Yue Dong, Tong Zhao, Wei Ai, Waleed A. Zalloum, Dongwei Kang, Ting Wu, Xinyong Liu, Peng Zhan
Expert Opinion on Therapeutic Patents.2019; 29(11): 871. CrossRef - An association of smoking with serum urate and gout: A health paradox
Niamh Fanning, Tony R. Merriman, Nicola Dalbeth, Lisa K. Stamp
Seminars in Arthritis and Rheumatism.2018; 47(6): 825. CrossRef - Baseline and changes in serum uric acid independently predict 11-year incidence of metabolic syndrome among community-dwelling women
R. Kawamoto, D. Ninomiya, Y. Kasai, K. Senzaki, T. Kusunoki, N. Ohtsuka, T. Kumagi
Journal of Endocrinological Investigation.2018; 41(8): 959. CrossRef - Production Inhibition and Excretion Promotion of Urate by Fucoidan from Laminaria japonica in Adenine-Induced Hyperuricemic Mice
Dayan Zhang, Huazhong Liu, Ping Luo, Yanqun Li
Marine Drugs.2018; 16(12): 472. CrossRef - Association between Mean Corpuscular Hemoglobin Concentration and Future Depressive Symptoms in Women
Ju-Mi Lee, Sarah B. Nadimpalli, Jin-Ha Yoon, Se Yeon Mun, Il Suh, Hyeon Chang Kim
The Tohoku Journal of Experimental Medicine.2017; 241(3): 209. CrossRef - Screening of effective xanthine oxidase inhibitors in dietary anthocyanins from purple sweet potato (Ipomoea batatas L. Cultivar Eshu No.8) and deciphering of the underlying mechanisms in vitro
Zi-Cheng Zhang, Hong-Bin Wang, Qing Zhou, Ben Hu, Jia-Hao Wen, Jiu-Liang Zhang
Journal of Functional Foods.2017; 36: 102. CrossRef - Association of Education, Health Behaviors, Concerns, and Knowledge with Metabolic Syndrome among Urban Elderly in One Medical Center in Taiwan
Meng-Ting Tsou
International Journal of Gerontology.2017; 11(3): 138. CrossRef - Serum uric acid: a new therapeutic target for nonalcoholic fatty liver disease
Dan-Qin Sun, Sheng-Jie Wu, Wen-Yue Liu, Qian-Di Lu, Gui-Qi Zhu, Ke-Qing Shi, Martin Braddock, Dan Song, Ming-Hua Zheng
Expert Opinion on Therapeutic Targets.2016; 20(3): 375. CrossRef - Serum uric acid: A strong and independent predictor of metabolic syndrome after adjusting for body composition
Tae Yang Yu, Jae Hwan Jee, Ji Cheol Bae, Sang-Man Jin, Jong-Ha Baek, Moon-Kyu Lee, Jae Hyeon Kim
Metabolism.2016; 65(4): 432. CrossRef - Obésité, hyperuricémie et goutte
Gérard Chalès, Pascal Richette
Revue du Rhumatisme Monographies.2016; 83(1): 44. CrossRef - Serum uric acid concentration and metabolic syndrome among elderly Koreans: The Korean Urban Rural Elderly (KURE) study
Hansol Choi, Hyeon Chang Kim, Bo Mi Song, Ji Hye Park, Ju-Mi Lee, Da-Lim Yoon, Young Mi Yoon, Yumie Rhee, Yousik Youm, Chang Oh Kim
Archives of Gerontology and Geriatrics.2016; 64: 51. CrossRef - Biomarkers of Metabolic Syndrome: Biochemical Background and Clinical Significance
Harry Robberecht, Nina Hermans
Metabolic Syndrome and Related Disorders.2016; 14(2): 47. CrossRef - Overweight modifies the longitudinal association between uric acid and some components of the metabolic syndrome: The Tromsø Study
Jon V. Norvik, Hilde M. Storhaug, Kirsti Ytrehus, Trond G. Jenssen, Svetlana N. Zykova, Bjørn O. Eriksen, Marit D. Solbu
BMC Cardiovascular Disorders.2016;[Epub] CrossRef - Nonalcoholic fatty liver disease: A precursor of the metabolic syndrome
Amedeo Lonardo, Stefano Ballestri, Giulio Marchesini, Paul Angulo, Paola Loria
Digestive and Liver Disease.2015; 47(3): 181. CrossRef - Associations between serum uric acid concentrations and metabolic syndrome and its components in the PREDIMED study
N. Babio, M.A. Martínez-González, R. Estruch, J. Wärnberg, J. Recondo, M. Ortega-Calvo, L. Serra-Majem, D. Corella, M. Fitó, E. Ros, N. Becerra-Tomás, J. Basora, J. Salas-Salvadó
Nutrition, Metabolism and Cardiovascular Diseases.2015; 25(2): 173. CrossRef - Prevalence of metabolic syndrome and pre-metabolic syndrome in health professionals: LATINMETS Brazil study
Fernanda de Carvalho Vidigal, Andréia Queiroz Ribeiro, Nancy Babio, Jordi Salas-Salvadó, Josefina Bressan
Diabetology & Metabolic Syndrome.2015;[Epub] CrossRef - Cross-sectional and longitudinal associations between serum uric acid and metabolic syndrome: Results from Fangchenggang Area Male Health and Examination Survey in China
Dongni Chen, Haiying Zhang, Yong Gao, Zheng Lu, Ziting Yao, Yonghua Jiang, Xinggu Lin, Chunlei Wu, Xiaobo Yang, Aihua Tan, Zengnan Mo
Clinica Chimica Acta.2015; 446: 226. CrossRef - Antioxidative phytochemicals from Rhododendron oldhamii Maxim. leaf extracts reduce serum uric acid levels in potassium oxonate-induced hyperuricemic mice
Yu-Tang Tung, Lei-Chen Lin, Ya-Ling Liu, Shang-Tse Ho, Chi-Yang Lin, Hsiao-Li Chuang, Chien-Chao Chiu, Chi-Chang Huang, Jyh-Horng Wu
BMC Complementary and Alternative Medicine.2015;[Epub] CrossRef - Mangiferin Inhibits Renal Urate Reabsorption by Modulating Urate Transporters in Experimental Hyperuricemia
Hua Yang, Lihui Gao, Yanfen Niu, Yuanfang Zhou, Hua Lin, Jing Jiang, Xiangfu Kong, Xu Liu, Ling Li
Biological & Pharmaceutical Bulletin.2015; 38(10): 1591. CrossRef - Serum Uric Acid and Subsequent Cognitive Performance in Patients with Pre-Existing Cardiovascular Disease
Noa Molshatzki, Galit Weinstein, Jonathan Y. Streifler, Uri Goldbourt, David Tanne, Hemachandra Reddy
PLOS ONE.2015; 10(3): e0120862. CrossRef - Serum uric acid does not predict incident metabolic syndrome in a population with high prevalence of obesity
L.A. Ferrara, H. Wang, J.G. Umans, N. Franceschini, S. Jolly, E.T. Lee, J. Yeh, R.B. Devereux, B.V. Howard, G. de Simone
Nutrition, Metabolism and Cardiovascular Diseases.2014; 24(12): 1360. CrossRef - Comorbidities in Patients with Crystal Diseases and Hyperuricemia
Sebastian E. Sattui, Jasvinder A. Singh, Angelo L. Gaffo
Rheumatic Disease Clinics of North America.2014; 40(2): 251. CrossRef - Association between Serum 25-Hydroxyvitamin D Level and Insulin Resistance in a Rural Population
Bo Mi Song, Hyeon Chang Kim, Dong Phil Choi, Sun Min Oh, Il Suh
Yonsei Medical Journal.2014; 55(4): 1036. CrossRef - Relationship between serum uric acid levels and metabolic syndrome in Chinese postmenopausal women
P. J. Liu, F. Ma, H. P. Lou, Y. N. Zhu, Y. Chen
Climacteric.2014; 17(2): 148. CrossRef - A possible role of serum uric acid as a marker of metabolic syndrome
Y.‐J. Lee, S. Cho, S. R. Kim
Internal Medicine Journal.2014; 44(12a): 1210. CrossRef - The liver and the kidney: two critical organs influencing the atherothrombotic risk in metabolic syndrome
Federico Carbone, Fabrizio Montecucco, François Mach, Roberto Pontremoli, Francesca Viazzi
Thrombosis and Haemostasis.2013; 110(11): 940. CrossRef - Hyperuricaemia
Niki Katsiki, Asterios Karagiannis, Vasilios G. Athyros, Dimitri P. Mikhailidis
Journal of Cardiovascular Medicine.2013; 14(6): 397. CrossRef - Metabolic syndrome, diabetes, and hyperuricemia
Changgui Li, Ming-Chia Hsieh, Shun-Jen Chang
Current Opinion in Rheumatology.2013; 25(2): 210. CrossRef - Risk factors for incident hyperuricemia during mid-adulthood in African American and White men and women enrolled in the ARIC cohort study
Mara A McAdams-DeMarco, Andrew Law, Janet W Maynard, Josef Coresh, Alan N Baer
BMC Musculoskeletal Disorders.2013;[Epub] CrossRef - The Effects of Consumption L-Arabinose on Metabolic Syndrome in Humans
Ziming, Dianpeng Li, Haiying Jiang, Guiyun Qian, Weiguo Sui, Guimian Zou, Hourui Zhang
Journal of Pharmacy and Nutrition Sciences .2013; 3(2): 116. CrossRef - Effects of the Degree of Obesity on Achieving Target Blood Pressure and Metabolic Deterioration in Obese Individuals: A Population-Based Study
Serkan Ozturk, Davut Baltaci, Yasemin Turker, Ali Kutlucan, Erhan Yengil, Mehmet Harun Deler, Mucahit Gur, Handan Ankarali
Kidney and Blood Pressure Research.2013; 37(6): 531. CrossRef
 PubReader
 ePub Link
 Cite
Cite