
Articles
- Page Path
- HOME > J Prev Med Public Health > Volume 45(4); 2012 > Article
-
Original Article
Selecting the Best Prediction Model for Readmission - Eun Whan Lee
-
Journal of Preventive Medicine and Public Health 2012;45(4):259-266.
DOI: https://doi.org/10.3961/jpmph.2012.45.4.259
Published online: July 31, 2012
College of Pharmacy, Gachon University, Incheon, Korea.
- Corresponding author: Eun Whan Lee, MPH. 191 Hambangmoe-ro, Yeonsu-gu, Incheon 406-799, Korea. Tel: +82-32-899-6431, Fax: +82-32-820-4829, ewlee@gachon.ac.kr
• Received: February 24, 2012 • Accepted: April 30, 2012
Copyright © 2012 The Korean Society for Preventive Medicine
This is an Open Access article distributed under the terms of the Creative Commons Attribution Non-Commercial License (http://creativecommons.org/licenses/by-nc/3.0/) which permits unrestricted non-commercial use, distribution, and reproduction in any medium, provided the original work is properly cited.
ABSTRACT
-
Objectives
- This study aims to determine the risk factors predicting rehospitalization by comparing three models and selecting the most successful model.
-
Methods
- In order to predict the risk of rehospitalization within 28 days after discharge, 11 951 inpatients were recruited into this study between January and December 2009. Predictive models were constructed with three methods, logistic regression analysis, a decision tree, and a neural network, and the models were compared and evaluated in light of their misclassification rate, root asymptotic standard error, lift chart, and receiver operating characteristic curve.
-
Results
- The decision tree was selected as the final model. The risk of rehospitalization was higher when the length of stay (LOS) was less than 2 days, route of admission was through the out-patient department (OPD), medical department was in internal medicine, 10th revision of the International Classification of Diseases code was neoplasm, LOS was relatively shorter, and the frequency of OPD visit was greater.
-
Conclusions
- When a patient is to be discharged within 2 days, the appropriateness of discharge should be considered, with special concern of undiscovered complications and co-morbidities. In particular, if the patient is admitted through the OPD, any suspected disease should be appropriately examined and prompt outcomes of tests should be secured. Moreover, for patients of internal medicine practitioners, co-morbidity and complications caused by chronic illness should be given greater attention.
- Readmission refers to being hospitalized again after being discharged and is significant for two reasons: quality and cost of health care [1]. In other words, readmission reflects relatively low quality [2] and also has negative social impacts [3-5]. Readmission is being considered as an indicator for evaluating the overall health care environment [6,7]. Australian Council on Healthcare Standards and National Health Service of the UK use readmission within 28 days after discharge as an indicator of the quality of health care [8,9]. The readmission rate is also one of the indicators of the Hospital Services Evaluation Program in Korea [10]. In addition, the rate of readmission was chosen as one of the grounds for measuring the quality of health care in the National Quality Forum of 2008 and the US Centers for Medicare and Medicaid, pointed out readmission as a reason for the excessive medical expenses [11].
- The US Medicare Payment Advisory Commission stated that $12 billion per year is spent on preventable readmissions [4], and a study estimated the cost of readmission of Medicare patients to be $17.4 billion per year [5]. When the medical costs of admitted patients are analyzed, high cost patients, who comprise 15% of all admitted patients, account for 55.3% of total medical costs, while the readmitted patients accounted for the highest portion, 42.0% [12].
- The frequency of readmission varies depending on the number of days after discharge. Research on Medicare patients in the US shows that the rate of readmission within 7 days was 6.2%, 15 days 11.3%, and 30 days 17.6% [13]. In another study, patients readmitted within 30 days accounted for 19.6% of the total number of patients, which was about a fifth of the total number of patients [5].
- As described above, readmission not only degrades the quality of health care but also increases medical expenses. Consequently, it is important to identify and predict the causes of readmission in order to prevent it. In this study, models to predict the risk of readmission were constructed, compared, and evaluated in order to determine an optimum model. In addition, the final model was applied to the research data in order to identify patients at risk of readmission in order to help prevent readmission.
INTRODUCTION
- Materials and Subjects
- The database of patients admitted to a teaching hospital in Seoul from January 1 to December 31, 2009, was used. The subject of analysis was individual patients, and when a patient had been admitted several times, all cases were evaluated individually and included in the analysis. Excluding the diseases that occupied less than 5% of the sample size among the 22 disease categories of the 10th revision of the International Classification of Diseases (ICD-10) code, 11 951 hospitalized patients among a total of 16 347 admitted under the following 8 categories of diseases were the final subjects of analysis: "neoplasms," "endocrine, nutritional and metabolic," "circulatory system," "respiratory system," "digestive system," "musculoskeletal system and connective tissues," "genitourinary system," and "symptoms, signs and abnormal clinical and laboratory findings, not elsewhere classified."
- Variables
- Readmission is a dependent variable for which the period between discharge and readmission varies according to the researcher. However, governmental agencies in Canada, Australia, the UK, and New Zealand, as well as most recent studies use 1 month (28-30 days) as the standard [8,9,14-18]. In this study, readmission within 28 days after discharge was used as the dependent variable.
- The risk factors of readmission revealed in previous studies are composed mainly of "demographic," "treatment and clinical," and "health care utilization" factors. Demographic factors were sex [17], age [17,19-21], income [22], and level of education [16]. As for age, opinions about its significance differ among researchers [20,23-25]. Treatment and clinical factors identified in previous research include department of treatment [17,20], number of comorbidities [22,23], surgery [26,27], clinical test results [28], change in the amount of drug dose within 48 hours of discharge [20], experience of depression [21], and state of mental health [28]. Health care utilization factors previously identified were the length of hospitalization [20], frequency of hospitalization and use of the emergency room (ER) within 6 months prior to the index hospitalization [28], frequency of hospitalization within 1 year from the index hospitalization [19], type of insurance [18], and type of ward [27].
- For this study, risk factors used in the demographic category were sex, age, and region of residence; for the treatment and clinical category, the risk factors were department of treatment, premium medical treatment (selecting a specific doctor), number of comorbidities, number of accompanying treatments, and whether the patient had surgery; the categories of main diagnosis of ICD-10 were included as independent variables; for the health care utilization category, type of insurance, type of patient room, admission route, length of stay (LOS), number of out-patient department visits and hospitalization, and use of ER within one year of the index hospitalization were taken into consideration as independent variables.
- Construction and Validation of the Model
- Each of the three models in this study was constructed using a different method. The first model was constructed using logistic regression, which is widely used when the dependent variable is binomial, and the second was built with a decision tree, which decides the most significant independent variable in each stage of predicting dependent variables. The third model was constructed using a neural network, which is useful for classifying and predicting from a large database [29,30].
- The complete analysis data were divided into 70% training data and 30% validation data, and in order to decide the model with the highest predictive power, the misclassification rate and root asymptotic standard error (ASE) were compared for each of the model's training data and validation data. A lift chart and receiver operating characteristic (ROC) curve were also used [29,30]. The model finally selected was then applied to the research data to identify patients with high readmission risk.
METHODS
Dependent variable
Independent variable
- Characteristics of Subjects
- The demographic characteristics of subjects were as follows: men account for 51.0%, as for age, 22.6% were in their 60s, 20.4% in their 50s, and 18.4% over 70, and more than half of the patients (56.3%) were residents of the city of Seoul (Table 1).
- Treatment and clinical characteristics were as follows: 64.1% of the patients were treated in the Department of Internal Medicine and 93.0% chose premium medical treatment. Among the principal diagnoses, diseases of the digestive system comprised 20.6% of patients and neoplasms 18.2% (Table 2).
- Health care utilization characteristics were as follows: patients with National Health Insurance accounted for 93.9%, and most of the patients (87.6%) stayed in rooms with 2 or more beds. Hospitalization via outpatient visits comprised 70.0%, and the average LOS was 8.5±11.2 days. The number of outpatient visits within one year before the index hospitalization was 14.7±20.0 visits, the number of hospitalizations within one year prior to the index admission was 2.5±3.4 times, and the use of the ER within one year of index hospitalization was nil for 89.5% of patients (Table 3).
- Construction and Validation of Models
- From a comparison of the misclassification rate and root ASE to evaluate the predictive power of the three models (Table 4), the root ASE of the training data results was 0.385 for regression, 0.373 for the decision tree, and 0.384 for the neural network, while that of the validation data was 0.385 for the regression, 0.369 for the decision tree, and 0.383 for the neural network. Thus, the decision tree showed the highest predictive power for the root ASE. The misclassification rate with the model generation data was 0.214 for the regression, 0.180 for the decision tree, and 0.214 for the neural network while that obtained with the validation data was 0.217 for the regression analysis, 0.177 for the decision tree, and 0.211 for the neural network. Thus, the decision tree also showed the highest predictive power for the misclassification rate. The lift chart and ROC curve, which are widely used to evaluate a given model's predictive power, were also used, and from the results, both the lift chart (Figure 1) and ROC curve (Figure 2) found the decision tree to have stronger predictive power. From the model comparison, the decision tree was chosen in order to predict patients with readmission risk.
- Predicting Readmission Risk
- The results of the decision tree evaluated the main risk factors of readmission as LOS (standard of categorization: 2 days), route of admission, category of principal diagnosis (ICE-10), department, LOS (standard of categorization: 5 days), and the frequency of outpatient visits, in respective order (Figure 3).
- The most important factor in the first stage was the LOS; if the LOS was lower than 2 days, the risk of readmission was 64.9%. The important factor in the next stage was route of admission, where hospitalization via outpatient visit was the most risky. Risk was especially high (75.3%) for patients with a LOS of less than 2 days and who had been hospitalized via outpatient visit. For the third stage, the department of treatment was the important factor, where the risk of readmission increased for the Department of Internal Medicine. In particular, the risk of readmission was 80.6% if the patient was hospitalized via outpatient visit in the Department of Internal Medicine with less than 2 days of stay.
- For patients with a LOS of more than 2 days, the important risk factor in the next stage was the category of principal diagnosis (ICD-10), where the risk of readmission for patients with neoplasms with a LOS over 2 days was 51.2%. The important factor in the third stage was the LOS, with increased risk when the LOS was less than 5 days. If the category of principal diagnosis was neoplasms with a LOS over 2 days but less than 5 days, the risk of readmission was 69.2%. For categories other than neoplasms, the risk factor of readmission was the number of outpatient visits within a year of the index hospitalization, where the risk increased if the number exceeded 10 times.
RESULTS
- The most important variable in predicting the risk of readmission was the LOS, where the risk was high when the LOS was less than two days (64.9%). Discharge within 24 or 36 hours of hospitalization was a risk increasing factor for various ages and disease categories due to decreased opportunity to discover comorbidities or complications as well as difficulty in managing pain for patients discharged on the same day as ambulatory surgery [31-33].
- For patients with a LOS of less than 2 days, the variable to predict the risk of readmission was the route of admission, where the risk of readmission was high (75.3%) if the LOS was less than 2 days and they were admitted via an outpatient visit. The severity and urgency for patients who come to the ER are high, but the consultation time is short. The medical staff of the ER leave a variety of possibilities open and makes diagnoses in greater detail than is done for outpatients, resulting in a reduced possibility of misdiagnosis or undiscovered illnesses [34]. In addition, intensive treatment is carried out in a relatively short time based on rapid diagnosis. In particular, based on this study, the diagnosis and respective treatment of comorbidity are likely to have been made faster for emergency patients with a LOS less than 2 days than for those hospitalized via outpatient services. In other words, the risk of readmission for patients who were discharged early (within 2 days of hospitalization), for the same reason mentioned earlier, is speculated to be higher than for those hospitalized via an outpatient visit than via the ER.
- The department of treatment was the most important variable in predicting the risk of readmission for patients with a LOS of less than 2 days and hospitalization via an outpatient visit. The risk of readmission was 80.6% for patients from the Department of Internal Medicine and 39.1% from the Department of Surgery. This study supports previous studies that concluded that the risk of readmission for patients from the Internal Medicine Department is generally higher due to the relatively high proportion of patients with chronic disease and complications [14,17,20].
- Therefore, in order to prevent readmission, the appropriateness of discharge within 2 days of hospitalization should be considered with respect to undiscovered comorbidities and complications. It is especially important to provide appropriate examinations and rapid results for suspected disorders to patients admitted through an outpatient visit; moreover, close attention should be given to patients from the Department of Internal Medicine for potential comorbidities and complications caused by chronic diseases.
- The category of principal diagnosis (ICD-10) was the most important variable for patients with a LOS of over 2 days. In previous studies, the title of the diagnosed disease was proposed as a factor of readmission based on the finding that the risk factor of readmission varies according to the specific disease [35]. In a study of patients with pneumonia, congestive heart failure, and intracranial hemorrhage, analysis according to each type of disease correlated with the factors affecting readmission [14]. Hence, risk of readmission can be predicted more accurately by breaking down and analyzing the target of research according to more detailed types of diseases. The titles of diseases are classified as "neoplasm" and "others" in the results of this study; that is because the risk factor is likely due to regular readmission for chemotherapy, a post-treatment, which is unavoidable [5].
- LOS (standard: 5 days) was the key variable for predicting the risk of readmission for patients with LOS of more than 2 days and disease in the "neoplasms" category, where the shorter the LOS was, the higher the risk of readmission (69.2%). According to previous research, the risk of readmission within 1 year of index hospitalization increased with an increase in LOS, in a study of patients over 14 years of age in training hospitals [20] while an increased risk of readmission within 28 days of discharge was noted for a decrease in LOS for patients in academic hospitals [14]. In addition, LOS was not a significant factor in a study of patients over 65 years who were readmitted within 60 days of discharge [36]. This difference appears to be due to the difference in the subjects of study and the definition of the period from the day of discharge till readmission. For this study, the risk of readmission was higher when the LOS was relatively shorter with respect to the 5 day standard, which seems to be due to premature discharge without sufficient treatment. This phenomenon is caused by hospitals trying to reduce the LOS in order to increase bed turnover, which in turn increases profitability [37].
- For patients classified in the "others" disease category, the factor of risk prediction was the number of outpatient visits within a year prior to the index hospitalization. Previous research shows that the risk of readmission is higher for patients who use medical services frequently; the risk of readmission increased with an increase in the frequency of hospitalization and use of ER within 6 months of index hospitalization as well as higher utilization of outpatient services within a year of index hospitalization [14,19,28]. The present study supports the findings of the previous studies, as the risk of readmission evaluated by this study was 12.5% for patients who used outpatient services less than 10 times within one year of the index hospitalization, whereas it was 27.3% for those who used it more than 10 times.
- The first contribution of this study is that, unlike most prior studies that used a logistic regression, it used various methods to construct prediction models and then chose the model with the strongest predictive power. Second, it went beyond the simple task of identifying risk factors of readmission to finding the important predictive variables for each stage, thereby allowing a study of patterns and implications.
- Some limitations were, first, that the results of the study cannot be generalized, as the data used were of hospitalized patients from a single academic hospital. Second, the study could not include all the variables that reflect the state of the patients mentioned in prior research such as the severity of the disease, the title of accompanying diseases, and the process of providing healthcare services. Although the number of accompanying treatments and comorbidities were included as independent variables in order to make up for this limitation, it is difficult to directly identify the severity of the disease and the process of providing medical services. Third, the decision tree modeled the pattern of readmitted patients by categorizing only 6 times, which means that it could not categorize according to all of the risk factors suggested in previous studies. In conclusion, the study provided results that help clarify a certain pattern in the way variables affect the identification of patients with risk of readmission, but it could not assess all the variables that affect readmission. It is recommended that further studies include variables such as the severity of diseases and the process of provision of medical services. Also the risk factors should be studied with respect to detailed types of diseases.
DISCUSSION
- 1. Hasan M. Readmission of patients to hospital: still ill defined and poorly understood. Int J Qual Health Care 2001;13(3):177-179. 11476140ArticlePubMed
- 2. Clarke A. Readmission to hospital: a measure of quality or outcome? Qual Saf Health Care 2004;13(1):10-11. 14757792ArticlePubMedPMC
- 3. Friedman B, Basu J. The rate and cost of hospital readmissions for preventable conditions. Med Care Res Rev 2004;61(2):225-240. 15155053ArticlePubMed
- 4. Medicare Payment Advisory Commission. Medicare Payment Advisory Commission. A path to bundled payment around a rehospitalization. Report to the Congress: reforming the delivery system. 2008. Washington, DC: Medicare Payment Advisory Commission; p. 83-103
- 5. Jencks SF, Williams MV, Coleman EA. Rehospitalizations among patients in the Medicare fee-for-service program. N Engl J Med 2009;360(14):1418-1428. 19339721ArticlePubMed
- 6. Franklin PD, Noetscher CM, Murphy ME, Lagoe RJ. Using data to reduce hospital readmissions. J Nurs Care Qual 1999;14(1):67-85. 10616276Article
- 7. Cullen C, Johnson DS, Cook G. Re-admission rates within 28 days of total hip replacement. Ann R Coll Surg Engl 2006;88(5):475-478. 17002854ArticlePubMedPMC
- 8. Australian Council on Healthcare Standards. Clinical indicators users' manual: hospital wide clinical indicators. 2007. Ultimo: Australian Council on Healthcare Standards; p. 4-5
- 9. Lakhani A, Olearnik H, Eayres D. Compendium of clinical and health indicators: data definitions and user guide for computer files. 2009. London: NHS Information Centre for Health and Social Care; p. 97
- 10. Ministry of Health & Welfare. Guidelines for hospital evaluation programme 2009. 2009. Seoul: Ministry of Health & Welfare; p. 254 (Korean)
- 11. McBride S. Agency for Healthcare Research and Quality. Parameters for the appropriate definition of hospital readmissions. Workshop of Agency for Healthcare Research and Quality: using administrative data to answer state policy questions. 2008. Rockville: Agency for Healthcare Research and Quality; p. 4-11
- 12. Moon OR, Kang SH, Lee EP, Jwa YK, Lee HS. An analysis on the characteristics of high cost patients in the regional medical insurance program. Korean J Health Policy Adm 1993;3(1):53-83. (Korean)
- 13. Medicare Payment Advisory Commission. Report to the congress: promoting greater efficiency in medicare. 2007. Washington, DC: Medicare Payment Advisory Commission; p. 103-120
- 14. Lee E, Yu SH, Lee HJ, Kim S. Factors associated with unplanned hospital readmission. Korean J Hosp Manage 2010;15(4):125-142. (Korean)
- 15. Heggestad T, Lilleeng SE. Measuring readmissions: focus on the time factor. Int J Qual Health Care 2003;15(2):147-154. 12705708ArticlePubMed
- 16. Jasti H, Mortensen EM, Obrosky DS, Kapoor WN, Fine MJ. Causes and risk factors for rehospitalization of patients hospitalized with community-acquired pneumonia. Clin Infect Dis 2008;46(4):550-556. 18194099ArticlePubMed
- 17. Silverstein MD, Qin H, Mercer SQ, Fong J, Haydar Z. Risk factors for 30-day hospital readmission in patients ≥65 years of age. Proc (Bayl Univ Med Cent) 2008;21(4):363-372. 18982076ArticlePubMedPMC
- 18. Rumball-Smith J, Hider P, Graham P. The readmission rate as an indicator of the quality of elective surgical inpatient care for the elderly in New Zealand. N Z Med J 2009;122(1289):32-39. 19305447
- 19. Reed RL, Pearlman RA, Buchner DM. Risk factors for early unplanned hospital readmission in the elderly. J Gen Intern Med 1991;6(3):223-228. 2066826ArticlePubMed
- 20. Corrigan JM, Martin JB. Identification of factors associated with hospital readmission and development of a predictive model. Health Serv Res 1992;27(1):81-101. 1563955PubMedPMC
- 21. Marcantonio ER, McKean S, Goldfinger M, Kleefield S, Yurkofsky M, Brennan TA. Factors associated with unplanned hospital readmission among patients 65 years of age and older in a Medicare managed care plan. Am J Med 1999;107(1):13-17. 10403347ArticlePubMed
- 22. Chu LW, Pei CK. Risk factors for early emergency hospital readmission in elderly medical patients. Gerontology 1999;45(4):220-226. 10394080ArticlePubMed
- 23. Graham H, Livesley B. Can readmissions to a geriatric medical unit be prevented? Lancet 1983;1(8321):404-406. 6130389ArticlePubMed
- 24. Gooding J, Jette AM. Hospital readmissions among the elderly. J Am Geriatr Soc 1985;33(9):595-601. 4031337ArticlePubMed
- 25. Fethke CC, Smith IM, Johnson N. "Risk" factors affecting readmission of the elderly into the health care system. Med Care 1986;24(5):429-437. 3702502ArticlePubMed
- 26. Holloway JJ, Thomas JW, Shapiro L. Clinical and sociodemographic risk factors for readmission of Medicare beneficiaries. Health Care Financ Rev 1988;10(1):27-36. 10312819PubMedPMC
- 27. Oh HJ, Yu SH. A case-control study of unexpected readmission in a university hospital. Korean J Prev Med 1999;32(3):289-296. (Korean)
- 28. Smith DM, Giobbie-Hurder A, Weinberger M, Oddone EZ, Henderson WG, Asch DA, et al. Department of Veterans Affairs Cooperative Study Group on Primary Care and Readmissions. Predicting non-elective hospital readmissions: a multi-site study. J Clin Epidemiol 2000;53(11):1113-1118. 11106884ArticlePubMed
- 29. Steyerberg EW, Borsboom GJ, van Houwelingen HC, Eijkemans MJ, Habbema JD. Validation and updating of predictive logistic regression models: a study on sample size and shrinkage. Stat Med 2004;23(16):2567-2586. 15287085ArticlePubMed
- 30. Bellazzi R, Zupan B. Predictive data mining in clinical medicine: current issues and guidelines. Int J Med Inform 2008;77(2):81-97. 17188928ArticlePubMed
- 31. Shepperd S, Doll H, Broad J, Gladman J, Iliffe S, Langhorne P, et al. Early discharge hospital at home. Cochrane Database Syst Rev 2009;(1):CD000356. 19160179ArticlePubMed
- 32. Lermitte J, Chung F. Patient selection in ambulatory surgery. Curr Opin Anaesthesiol 2005;18(6):598-602. 16534298ArticlePubMed
- 33. Lock M, Ray JG. Higher neonatal morbidity after routine early hospital discharge: are we sending newborns home too early? CMAJ 1999;161(3):249-253. 10463045PubMedPMC
- 34. Terry NR. Physicians are talking about: the culture of defensive medicine. 2010. cited 2012 Jul 6. Available from: http://www.medscape.com/viewarticle/718665
- 35. Brown J, Grey CS. Stemming the tide of readmissions: patient, practice or practitioner? Rev Clin Gerontol 1998;8: 173-181Article
- 36. Burns R, Nichols LO. Factors predicting readmission of older general medicine patients. J Gen Intern Med 1991;6(5):389-393. 1744751ArticlePubMed
- 37. Lee KJ, Lee WI, Kim YM, Seong SS, Chu HS, Lee AS. Korean Society of Quality Assurance in Health Care. Increasing of revenue through reduction of length of stay. Proceedings of the 2005 Conference of Korean Society of Quality Assurance in Health Care. 2005. 2005 Nov 10-11; Daegu, Korea: Seongnam: Korean Society of Quality Assurance in Health Care; 361-362 (Korean)
REFERENCES
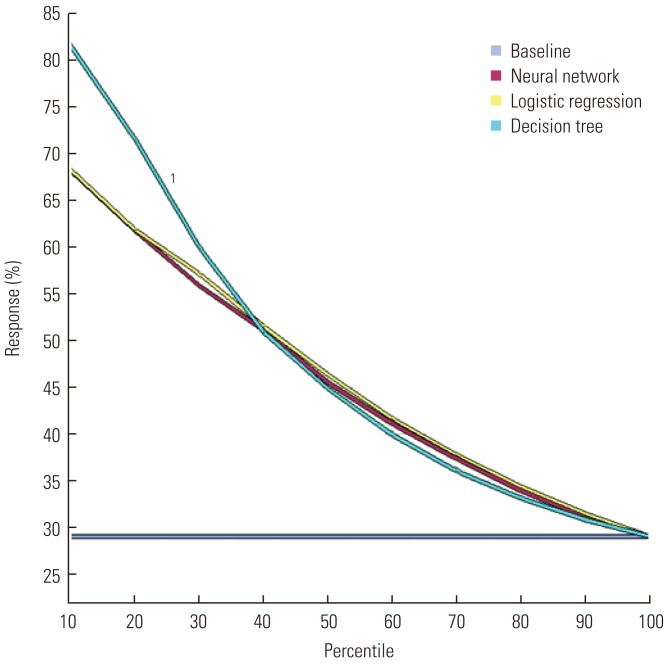
Figure 2Comparison of statistical prediction models by receiver operating characteristic curve. 1Decision tree.
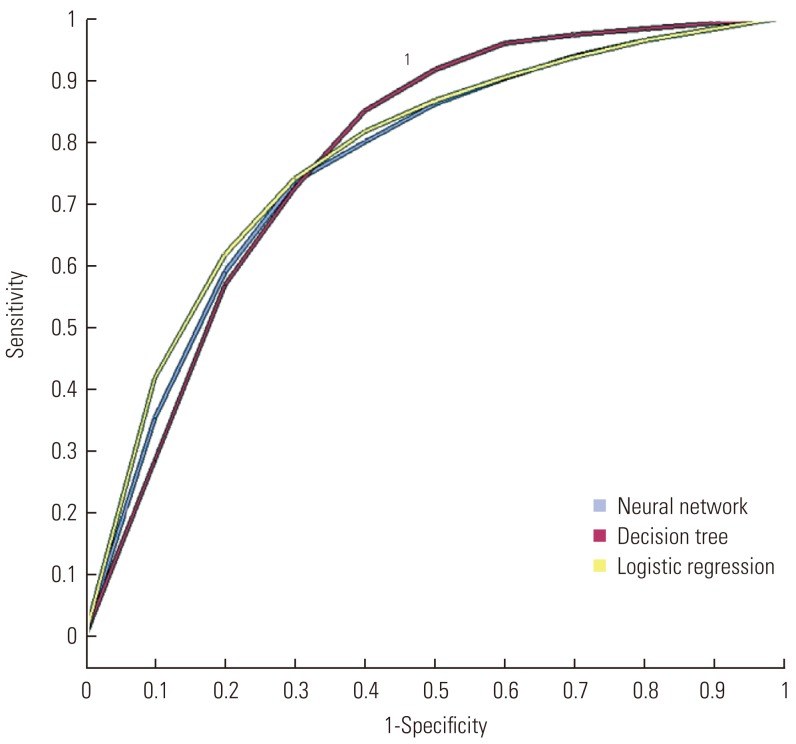
Figure 3Prediction models in rehospitalization. Values are presented as number (%). No, nonrehospitalization; Yes, rehospitalization; OPD, out-patient department; ER, emergency room; ICD-10, 10th revision of the International Classification of Diseases.
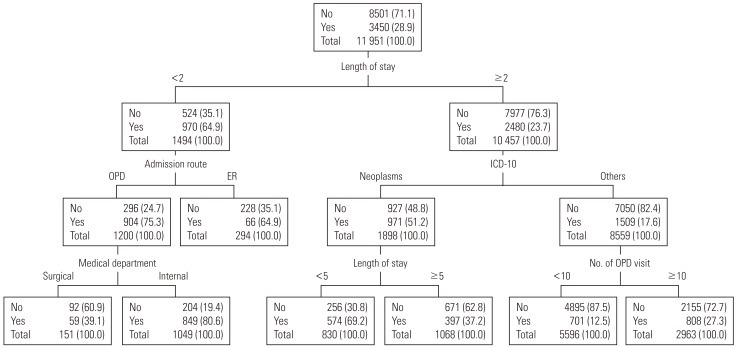
Table 1.Demographic characteristics of subjects
Table 2.Clinical characteristics of subjects
Table 3.Health care utilization characteristics of subjects
Table 4.Comparison of statistical prediction models by root ASE and misclassification rate
Figure & Data
References
Citations
Citations to this article as recorded by 
- Interpretable machine learning models for hospital readmission prediction: a two-step extracted regression tree approach
Xiaoquan Gao, Sabriya Alam, Pengyi Shi, Franklin Dexter, Nan Kong
BMC Medical Informatics and Decision Making.2023;[Epub] CrossRef - Burden and patient characteristics associated with repeat consultation for unscheduled care within 30 days in primary care: a retrospective case control study with implications for aging and public health
Valentin Richard, Leila Bouazzi, Clément Richard, Stéphane Sanchez
Frontiers in Public Health.2023;[Epub] CrossRef - Machine learning for predicting readmission risk among the frail: Explainable AI for healthcare
Somya D. Mohanty, Deborah Lekan, Thomas P. McCoy, Marjorie Jenkins, Prashanti Manda
Patterns.2022; 3(1): 100395. CrossRef - AI Models for Predicting Readmission of Pneumonia Patients within 30 Days after Discharge
Jiin-Chyr Hsu, Fu-Hsing Wu, Hsuan-Hung Lin, Dah-Jye Lee, Yung-Fu Chen, Chih-Sheng Lin
Electronics.2022; 11(5): 673. CrossRef - An AI-driven clinical care pathway to reduce 30-day readmission for chronic obstructive pulmonary disease (COPD) patients
Lin Wang, Guihua Li, Chika F. Ezeana, Richard Ogunti, Mamta Puppala, Tiancheng He, Xiaohui Yu, Solomon S. Y. Wong, Zheng Yin, Aaron W. Roberts, Aryan Nezamabadi, Pingyi Xu, Adaani Frost, Robert E. Jackson, Stephen T. C. Wong
Scientific Reports.2022;[Epub] CrossRef - Medicare cost reduction in the US: A case study of hospital readmissions and value-based purchasing
Mehmet C. Kocakulah, David Austill, Eric Henderson
International Journal of Healthcare Management.2021; 14(1): 203. CrossRef - Published models that predict hospital readmission: a critical appraisal
Lisa Grossman Liu, James R Rogers, Rollin Reeder, Colin G Walsh, Devan Kansagara, David K Vawdrey, Hojjat Salmasian
BMJ Open.2021; 11(8): e044964. CrossRef - Predictive modelling of hospital readmission: Evaluation of different preprocessing techniques on machine learning classifiers
Nor Hamizah Miswan, Chee Seng Chan, Chong Guan Ng
Intelligent Data Analysis.2021; 25(5): 1073. CrossRef - Designing a clinical decision support system to predict readmissions for patients admitted with all-cause conditions
Huey-Jen Lai, Tan-Hsu Tan, Chih-Sheng Lin, Yung-Fu Chen, Hsuan-Hung Lin
Journal of Ambient Intelligence and Humanized Computing.2020;[Epub] CrossRef - Implementation of Artificial Intelligence-Based Clinical Decision Support to Reduce Hospital Readmissions at a Regional Hospital
Santiago Romero-Brufau, Kirk D. Wyatt, Patricia Boyum, Mindy Mickelson, Matthew Moore, Cheristi Cognetta-Rieke
Applied Clinical Informatics.2020; 11(04): 570. CrossRef - Independent prospective validation of a medication‐based 15‐day readmission risk stratification algorithm in a tertiary acute care hospital
Denise Yeo, T. W. Chew, Y. F. Lai
JACCP: JOURNAL OF THE AMERICAN COLLEGE OF CLINICAL PHARMACY.2019; 2(1): 40. CrossRef - Risk Assessment of Acute, All-Cause 30-Day Readmission in Patients Aged 65+: a Nationwide, Register-Based Cohort Study
Mona K. Pedersen, Gunnar L. Nielsen, Lisbeth Uhrenfeldt, Søren Lundbye-Christensen
Journal of General Internal Medicine.2019; 34(2): 226. CrossRef - A machine learning model for predicting ICU readmissions and key risk factors: analysis from a longitudinal health records
Alvaro Ribeiro Botelho Junqueira, Farhaan Mirza, Mirza Mansoor Baig
Health and Technology.2019; 9(3): 297. CrossRef - Development of a predictive score for potentially avoidable hospital readmissions for general internal medicine patients
Anne-Laure Blanc, Thierry Fumeaux, Jérôme Stirnemann, Elise Dupuis Lozeron, Aimad Ourhamoune, Jules Desmeules, Pierre Chopard, Arnaud Perrier, Nicolas Schaad, Pascal Bonnabry, Enrico Mossello
PLOS ONE.2019; 14(7): e0219348. CrossRef - An integrated machine learning framework for hospital readmission prediction
Shancheng Jiang, Kwai-Sang Chin, Gang Qu, Kwok L. Tsui
Knowledge-Based Systems.2018; 146: 73. CrossRef - Development and prospective validation of a model estimating risk of readmission in cancer patients
Carl R. Schmidt, Jennifer Hefner, Ann S. McAlearney, Lisa Graham, Kristen Johnson, Susan Moffatt‐Bruce, Timothy Huerta, Timothy M. Pawlik, Susan White
Journal of Surgical Oncology.2018; 117(6): 1113. CrossRef - Characterization, Categorization, and 5-Year Mortality of Medicine High Utilizer Inpatients
Joyeeta G. Dastidar, Min Jiang
Journal of Palliative Care.2018; 33(3): 167. CrossRef - Predicting Hospital Readmission via Cost-Sensitive Deep Learning
Haishuai Wang, Zhicheng Cui, Yixin Chen, Michael Avidan, Arbi Ben Abdallah, Alexander Kronzer
IEEE/ACM Transactions on Computational Biology and Bioinformatics.2018; 15(6): 1968. CrossRef - Using decision trees to explore the association between the length of stay and potentially avoidable readmissions: A retrospective cohort study
Mohammad S. Alyahya, Heba H. Hijazi, Hussam A. Alshraideh, Amjad D. Al-Nasser
Informatics for Health and Social Care.2017; 42(4): 361. CrossRef - Identifying Potentially Avoidable Readmissions: A Medication‐Based 15‐Day Readmission Risk Stratification Algorithm
Sreemanee Raaj Dorajoo, Vincent See, Chen Teng Chan, Joyce Zhenyin Tan, Doreen Su Yin Tan, Siti Maryam Binte Abdul Razak, Ting Ting Ong, Narendran Koomanan, Chun Wei Yap, Alexandre Chan
Pharmacotherapy: The Journal of Human Pharmacology and Drug Therapy.2017; 37(3): 268. CrossRef - The association between number of doctors per bed and readmission of elderly patients with pneumonia in South Korea
Joo Eun Lee, Tae Hyun Kim, Kyoung Hee Cho, Kyu-Tae Han, Eun-Cheol Park
BMC Health Services Research.2017;[Epub] CrossRef - Preventing hospital readmissions: the importance of considering ‘impactibility,’ not just predicted risk
Adam Steventon, John Billings
BMJ Quality & Safety.2017; 26(10): 782. CrossRef - Assessing risk of hospital readmissions for improving medical practice
Parimal Kulkarni, L. Douglas Smith, Keith F. Woeltje
Health Care Management Science.2016; 19(3): 291. CrossRef - Comparison of Clinical Risk Factors Among Pediatric Patients With Single Admission, Multiple Admissions (Without Any 7-Day Readmissions), and 7-Day Readmission
Jeffrey C. Winer, Elena Aragona, Alan I. Fields, David C. Stockwell
Hospital Pediatrics.2016; 6(3): 119. CrossRef - An ontology-based system to predict hospital readmission within 30 days
Huda Al Ghamdi, Riyad Alshammari, Muhammad Imran Razzak
International Journal of Healthcare Management.2016; 9(4): 236. CrossRef - Impact of selected pre-processing techniques on prediction of risk of early readmission for diabetic patients in India
Reena Duggal, Suren Shukla, Sarika Chandra, Balvinder Shukla, Sunil Kumar Khatri
International Journal of Diabetes in Developing Countries.2016; 36(4): 469. CrossRef - Predicting Patients at Risk for 3-Day Postdischarge Readmissions, ED Visits, and Deaths
Deepak Agrawal, Cheng-Bang Chen, Ronald W. Dravenstott, Christopher T. B. Strömblad, John Andrew Schmid, Jonathan D. Darer, Priyantha Devapriya, Soundar Kumara
Medical Care.2016; 54(11): 1017. CrossRef - Utility of models to predict 28-day or 30-day unplanned hospital readmissions: an updated systematic review
Huaqiong Zhou, Phillip R Della, Pamela Roberts, Louise Goh, Satvinder S Dhaliwal
BMJ Open.2016; 6(6): e011060. CrossRef - Multimorbidity in risk stratification tools to predict negative outcomes in adult population
Edurne Alonso-Morán, Roberto Nuño-Solinis, Graziano Onder, Giuseppe Tonnara
European Journal of Internal Medicine.2015; 26(3): 182. CrossRef - Predicting 30-day Hospital Readmission with Publicly Available Administrative Database
K. Zhu, Z. Lou, J. Zhou, N. Ballester, N. Kong, P. Parikh
Methods of Information in Medicine.2015; 54(06): 560. CrossRef - Emergency Department Non-Urgent Visits and Hospital Readmissions Are Associated with Different Socio-Economic Variables in Italy
Pamela Barbadoro, Elena Di Tondo, Vincenzo Giannicola Menditto, Lucia Pennacchietti, Februa Regnicoli, Francesco Di Stanislao, Marcello Mario D’Errico, Emilia Prospero, Chiara Lazzeri
PLOS ONE.2015; 10(6): e0127823. CrossRef - Using Decision Trees to Manage Hospital Readmission Risk for Acute Myocardial Infarction, Heart Failure, and Pneumonia
John P. Hilbert, Scott Zasadil, Donna J. Keyser, Pamela B. Peele
Applied Health Economics and Health Policy.2014; 12(6): 573. CrossRef - A three-step approach for the derivation and validation of high-performing predictive models using an operational dataset: congestive heart failure readmission case study
Samir E AbdelRahman, Mingyuan Zhang, Bruce E Bray, Kensaku Kawamoto
BMC Medical Informatics and Decision Making.2014;[Epub] CrossRef - Nationwide prospective study on readmission after umbilical or epigastric hernia repair
F. Helgstrand, L. N. Jørgensen, J. Rosenberg, H. Kehlet, T. Bisgaard
Hernia.2013; 17(4): 487. CrossRef - Data Mining Application in Customer Relationship Management for Hospital Inpatients
Eun Whan Lee
Healthcare Informatics Research.2012; 18(3): 178. CrossRef
 PubReader
 ePub Link
 Cite
Cite


