
Articles
- Page Path
- HOME > J Prev Med Public Health > Volume 45(6); 2012 > Article
-
Special Article
Fate and Transport of Mercury in Environmental Media and Human Exposure - Moon-Kyung Kim, Kyung-Duk Zoh
-
Journal of Preventive Medicine and Public Health 2012;45(6):335-343.
DOI: https://doi.org/10.3961/jpmph.2012.45.6.335
Published online: November 29, 2012
Department of Environmental Health, Seoul National University School of Public Health, Seoul, Korea.
- Corresponding author: Kyung-Duk Zoh, PhD. 1 Gwanak-ro, Gwanak-gu, Seoul 151-742, Korea. Tel: +82-2-880-2737, Fax: +82-2-745-9104, zohkd@snu.ac.kr
Copyright © 2012 The Korean Society for Preventive Medicine
This is an Open Access article distributed under the terms of the Creative Commons Attribution Non-Commercial License (http://creativecommons.org/licenses/by-nc/3.0/) which permits unrestricted non-commercial use, distribution, and reproduction in any medium, provided the original work is properly cited.
ABSTRACT
- Mercury is emitted to the atmosphere from various natural and anthropogenic sources, and degrades with difficulty in the environment. Mercury exists as various species, mainly elemental (Hg0) and divalent (Hg2+) mercury depending on its oxidation states in air and water. Mercury emitted to the atmosphere can be deposited into aqueous environments by wet and dry depositions, and some can be re-emitted into the atmosphere. The deposited mercury species, mainly Hg2+, can react with various organic compounds in water and sediment by biotic reactions mediated by sulfur-reducing bacteria, and abiotic reactions mediated by sunlight photolysis, resulting in conversion into organic mercury such as methylmercury (MeHg). MeHg can be bioaccumulated through the food web in the ecosystem, finally exposing humans who consume fish. For a better understanding of how humans are exposed to mercury in the environment, this review paper summarizes the mechanisms of emission, fate and transport, speciation chemistry, bioaccumulation, levels of contamination in environmental media, and finally exposure assessment of humans.
- Mercury is released to the atmosphere from various natural and anthropogenic sources such as volcanos, coal-powered plants, and incineration plants. Once mercury is released to the environment, it can be transported to various environmental media. Mercury can exist as various species in air and water environments, mainly elemental (Hg0) and divalent gaseous (Hg2+) mercury depending on its oxidation states. The organic form of mercury, particularly methylmercury (MeHg), is known as a global contaminant and toxicant to humans and wildlife [1].
- MeHg can cross the placenta and readily pass through the blood-brain barrier, with even higher levels of MeHg reported in fetal than in maternal circulation [2]. Vulnerability of the developing fetus to MeHg exposure was exemplified in Minamata, Japan by pregnant women who consumed seafood highly contaminated with MeHg. This resulted in extreme fetal abnormalities and neurotoxicity (i.e., microcephaly, blindness, severe mental and physical developmental retardation) even among infants born from mothers with minimal symptoms [2].
- Korea is surrounded by the sea on three sides, and has many lakes, rivers, and tributaries, and Korean people are known to consume high quantities of seafood including fish. In fact, it was recently reported that the mercury intake is known to be 18.8 µg day-1 for adults in Korea, and more than 90% of mercury exposure came from food intake [3]. It was also reported that, surprisingly, blood mercury levels among adult Koreans are 5 to 8 times higher than that of other countries such as the US [4]. In addition, coal power plants are one of the main contributors to the total electric energy production in Korea. The number of incineration plants for treating wastes, especially hazardous wastes, produced in Korea continues to increase. All this indicates that a considerable increase in mercury sources is occurring in Korea.
- Since mercury can move over long distances through various environmental media, it is important to identify the contribution of emission sources, and the global movement of mercury. It is also necessary to understand the emission sources, fate, and transport mechanisms of mercury species in environmental media. This understanding is important for assessing the exposure of humans to mercury. In this review, we summarize the theoretical aspects of mercury emission sources, fate, and transport including the mechanism of mercury, the distribution of mercury species in environmental media, and recent measurement data in Korea and other countries. Finally, we summarize the health impact of mercury, particularly MeHg.
INTRODUCTION
- Mercury Species and Its Emission Sources
- Mercury can be found as inorganic and organic mercury species in the environment. Inorganic mercury can exist in two oxidation states; Hg0 (metallic, zero oxidation state) and Hg2+ (mercuric, oxidation state +2) in the environment [5]. Since various mercury species have their special physicochemical characteristics, it is important to understand the fate and transport of each mercury species in the environment.
- Among mercury species, elemental mercury (0 oxidation state), being the predominant species in ambient air, has residence time of 0.5 to 2 years due to its low solubility in water and chemical inertness [6]. Hg0 can be globally cycled by long-range transport [7]. Elemental mercury emitted from its sources can be thoroughly mixed vertically in the troposphere, and its typical concentration is reported to be 1 to 4 ng m-3 at background sites [6]. Elemental mercury is often called dissolved gaseous mercury (Hg0) as DGM in water.
- In contrast, Hg2+, mainly as reactive gaseous mercury (RGM) in the atmosphere is highly water soluble, reactive, and less volatile than Hg0 with a lifetime of days in the atmosphere. Therefore, the amount of RGM (Hg2+) in the atmosphere is typically less than 5% of the total mercury (TM) concentration, but RGM (Hg2+) is important in terms of mercury deposition into water environments. In fact, Han et al. [8] reported that gas-phase oxidized mercury (Hg2+) has a higher dry deposition rate in the air (1-4 cm s-1).
- Another species in the atmosphere is particulate mercury (Hg(p)), which is the mercury species adsorbed by particulate matter. Atmospheric deposition is the primary pathway for inputs of particulate mercury (Hg(p)) and RGM (Hg2+) to natural waters in many cases. Mercury species in the atmosphere comprises various species such as Hg2+, Hg(p), and Hg0, and each species has different physico-chemical characteristics and consequently different atmospheric lifetimes. Therefore, mercury speciation is important when assessing the atmospheric fate and transport of mercury.
- In natural water environments, mercury can exist as several chemical species, including DGM (Hg0), dissolved Hg2+ in water, and organic mercury mainly in the form of MeHg (CH3Hg+). Dissolved Hg2+ in water is often called dissolved reactive mercury (DRM, Hg2+). DRM (Hg2+) undergoes various oxidation and reduction reactions with strong a relationship with organic matter in water [9].
- Mercury Emission Sources
- Mercury is emitted from both natural and anthropogenic sources. Natural sources include volcanic activity, weathering of rock, oceans, soils, biomass burning, and vegetation, whereas anthropogenic sources include coal combustion, waste incineration, mercury mining, iron and steel production, non-ferrous smelters, cement production, chlor-alkali facilities, industrial uses, and re-emission of previously deposited anthropogenic mercury [1,5].
- Most mercury in the atmosphere is emitted by anthropogenic activities. Anthropogenic activities account for 2/3 of natural sources of mercury [10]. Among anthropogenic sources of mercury, the combustion of coal or fossil fuels, associated with energy or heat production in major power plants and waste incineration plants contributes approximately 70% of total atmosphere emissions [1]. Munthe et al. [11] also showed that the deposition rate of Hg has grown by three times during the past century because of increased anthropogenic emissions from industry and agriculture and from medical and domestic sources. Pacyna et al. [12] also reported that global mercury emissions in 2000 were from fossil fuel combustion (65%), gold production (11%), non-ferrous metal production (7%), and cement production (6%). In contrast, the estimation of mercury emissions from natural sources to the atmosphere is not accurately reported. Although the cause is quantitatively unknown for direct anthropogenic sources, there is no doubt that mercury is produced from human activities.
- Emissions-related mercury production dramatically increased after the Industrial Revolution (the late 18th century), and reached its peak during the 1970s (approximately 90 000 tons of mercury emissions). The emissions thereafter gradually decreased by approximately 6000 tons annually until the 1990s [1]. Recently, it has been reported that the mercury emissions from anthropogenic sources were reduced worldwide by an additional 2000 tons annually [12-15].
- This outcome implies that the current level of mercury has been achieved by gradually reduced emissions, resulting from strict regulations with increased awareness about the risks of mercury [13]. The development of mercury reduction techniques was also able to reduce the amount of mercury emissions. However, the reduction techniques have mainly been focused on the acidic air pollutants such as SOx, NOx, and particulate matter. The use of alternative energy instead of fossil fuel combustion can also help to reduce greenhouse gases as well as mercury in the atmosphere.
- Nevertheless, awareness about mercury is still steadily increasing throughout the world. At the same time, the proportion of emissions from fossil fuel combustion keeps increasing, especially in developing countries. In fact, Asia, especially China, has been regarded as the world's largest atmospheric mercury emission source [16,17]. It was estimated that Asian countries contributed 56% of total worldwide mercury emissions in 1995, compared with around 30% in 1990. The increase in emissions in Asia was clearly related to the growth of coal combustion in China. Korea also relies on 50% fossil fuel combustion for electricity production [18].
- Table 1 summarizes the global anthropogenic emissions of mercury as of 2005. According to Table 1, the combustion of fossil fuels (primarily coal) in stationary combustion facilities represents the most important anthropogenic source of mercury released to the global atmosphere, annually accounting for approximately 880 tons, with an important contribution from Asian countries (nearly 70% of the total) [19-23].
- Fate and Transport of Mercury
- Mercury can be thoroughly mixed vertically in the troposphere, and it can be transported over long distances on local, regional, and global scales [6,8,24]. In fact, previous studies have reported high concentrations of MeHg in fish in non-industrial areas, even the Arctic [25-27]. Seigneur et al. [28] estimated that 21% of TM from wet deposition in the United States originated from China. Weiss-Penzias et al. [29] also reported higher mercury concentration events at Mt. Bachelor Observatory, a remote location on the West Coast of the US, caused by long-range transport from East Asia, including China. These results imply that significant amounts of mercury are transported from China to Korea by long-range transport by the prevailing wind direction from the west.
- Mercury is mainly deposited from the air to water by dry and wet deposition as RGM (Hg2+) [30,31]. The deposited mercury has two fates: it is either adsorbed into sediments where it may be transformed to MeHg or it is reduced to DGM (Hg0) in water [32,33].
- Recent studies have shown that DGM can be produced in surface waters by the reduction of RGM (Hg2+) [34]. Many physical and chemical environmental parameters can accelerate the reduction of Hg2+ to DGM, including light intensity, water temperature, pH, and the concentration of dissolved organic matter [34-37].
- Mercury has the specific property of continuously cycling between air and water phases [6,7]. DGM can be re-emitted into the atmosphere by the volatilization of DGM. The volatilization of DGM is the only process that removes mercury from aquatic systems. Only this process can limit MeHg production and accumulation in fish [38,39].
- Among mercury species, mercury compounds combined with organic carbon are called organic mercury. Among organic mercury species, the best known species is MeHg, which exists as either dimethylmercury ((CH3)2Hg) or monomethylmercury (CH3Hg+). Most organic mercury species are formed by the chemical reaction of Hg2+ ions with organic carbon in water and sediment by microbiological processes or abiotic processes such as sunlight photolysis, resulting in bioaccumulation and biomagnification through the ecosystem.
- MeHg is the major species that is accumulated in fish. According to the US Environmental Protection Agency (EPA), mercury species in fish are mostly composed of MeHg. In seawater, mercury exists mainly as Hg0, and MeHg is mostly degraded deep in the ocean; thus, it mainly exists as dimethylmercury in seawater [5]. At the surface of seawater, MeHg does not exist because most MeHg can be volatilized, or demethylated by sunlight. In contrast, there are significantly greater amounts of MeHg in fresh bodies of water such as rivers and lakes compared to seawater. This is due to the low oxygen concentration and therefore the presence of sulfate reducing bacteria (SRB) in the bottom of fresh water lakes and rivers [40,41].
- MeHg is usually formed by specific bacteria such as SRB, or chemical reactions such as sunlight photolysis reactions, and these reactions are affected by various environmental parameters [40-45]. However, it was recently reported that biotic and abiotic demethylations of MeHg are considered to be important pathways of mercury in water environments. Biotic demethylation reactions usually occur in sediment and freshwater environments. It was reported that methyl- and phenylmercury can be deceased by algae in fresh water [40]. Demethylation of MeHg in water can also be abiotically mediated such as by sunlight photolysis or by reactive oxygen species such as hydroxyl radicals. These biotic and abiotic demethylation reactions are the most important mechanisms for reducing the bioaccumulation of mercury.
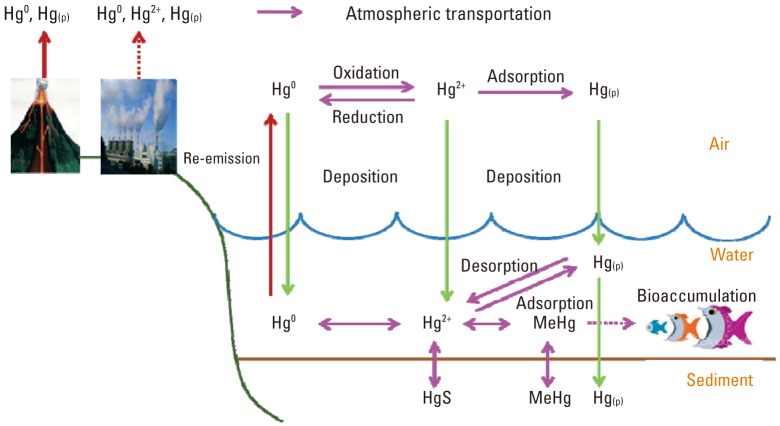
- The fate and transport of each mercury species in air, water, and sediment is summarized in Figure 1. According to Figure 1, mercury emitted from its sources can be transported into the atmosphere, and deposited into water environments, then into sediment. Mercury, mainly Hg2+, reacts with organic carbon by bacteria in the sediment, or abiotically, resulting in conversion into MeHg. This converted MeHg can be bioaccumulated into fish species through the food web.
- The Measurement Data of Mercury in the Environment
- Since the 1990s, the measurements of mercury in the environmental media including fish have been actively studied in the US and Canada. It was reported that there is a high correlation between the amounts of mercury emitted to the atmosphere and mercury levels in fish species [26]. This study first quantified the relationship between the emitted mercury and the levels of mercury in ecosystem. Also, since 2001, a comprehensive study called Mercury Experiment to Assess Atmospheric Loading in Canada and the United States has been conducted by the US and Canada in order to understand the effect of deposition of mercury on the levels of MeHg in fish. Recently, researches were conducted by intentionally depositing radioactive mercury species through wet deposition into lakes to track mercury species in the water, sediment, and fish [44-47].
- Multimedia models for describing the biogeochemical cycle of mercury to predict the fate of mercury in the environment have also been developed. The most recognized multimedia models are the Caltox, simpleBox, and total risk integrated methodology models [48]; these models are widely applied to predict mercury levels in the environment. The US EPA has been conducting a monitoring project since 1994. The US EPA chose mercury species as the validation compounds of the models, and various monitoring studies including the Lake Michigan Mass Balance Study have been conducted to validate these models [49]. Also, research on reducing the mercury levels in fish species by using these models have been actively carried out [50-56].
- The measurement of mercury levels in Korea has also been conducted recently. It was recently reported that the input of mercury by wet deposition from the atmosphere was measured in urban and rural areas in Korea. The annual amounts of mercury deposition in Chuncheon and Seoul cities were 9.4 µg m-2 yr-1, and 20.2 µg m-2 yr-1, respectively [18]. The higher levels of mercury deposition in Seoul compared to Chuncheon city might be due to the presence of the coal-powered plant located in the southwest part of the Seoul, and several incineration plants in Seoul. The levels of mercury wet deposition in Korea were also monitored, compared to other countries, and are summarized in Table 2 [57,58]. As shown in Table 2, the quantity of wet deposition in Korea is the highest in the world except for China. One possible reason might be due to mercury transport from China.
- DGM and TM concentrations were measured in the Juam Reservoir in Korea, which is known to be relatively clean because there is no possible mercury source nearby. The result showed that the average DGM concentration in summer was 109±15 pg L-1, almost three times higher than the average DGM levels measured in other lakes around the world. Also, the TM concentration in this lake was 2.2±0.4 ng L-1, and this level is also higher than in other lakes [9] (Table 3).
- The measurement of MeHg in Korea was conducted in the Shiwha artificial seawater-based lake surrounded by the Ansan-Shiwha industrial complex. The sediments in Shiwha lake were sampled, and TM and MeHg were measured. The ranges of TM and MeHg were 0.02-0.28 µg g-1, and <0.026-0.67 µg g-1, respectively. The levels of mercury in this lake were higher nearby the industrial complex [59].
- The levels of mercury in the air, water, and sediment in Korea are similar or relatively higher than in other countries. The higher levels of mercury might result from the input from China. Locally, the level of mercury was higher nearby industrial regions such as near incineration plants [60].
- Bioaccumulation of Mercury and Human Exposure to Mercury
- Mercury can be biomagnified rapidly, leading to high concentrations in top predators in aquatic ecosystems. Most mercury species can be bioaccumulated, but the bioaccumulation of MeHg is higher compared to other mercury species [49]. The many environmental parameters in water and sediment can affect the levels of MeHg in fish [42].
- MeHg in fish can be combined with the sulfhydryl group in the protein within the cells. Due to this covalent bonding, the bioaccumulation intensity of MeHg compared to other inorganic mercury increases at higher levels of a food web [42]. Therefore, the level of mercury can be highest in the top predator fish in a food web. Even in the same fish species, the older individual fish have higher mercury levels than younger ones [42,61].
- MeHg is a neurotoxic chemical to humans worldwide, with frequent fish consumers, pregnant women, and young children being particularly vulnerable. This mercury species is mainly ingested by consuming fish and other seafood. This implies that the major exposure route of mercury is from food intake [5].
- Table 4 summarized the sources of mercury, routes of exposure and elimination, and main effects of exposure to mercury [62]. Studies have shown that MeHg in pregnant women's diets can have adverse effects on children's development and on the cardiovascular system [5]. Thus, parents, pregnant women, and women who might become pregnant should be particularly aware of the potential harm of MeHg. Moderate consumption of fish (with low mercury levels) is not likely to result in exposures of concern. However, indigenous populations and others who consume higher amounts of contaminated fish or marine mammals, as well as workers who are exposed to mercury, such as in small scale gold and silver mining, may be highly exposed to mercury and are therefore at risk [5].
FATE AND TRANSPORT AND EXPOSURE OF MERCURY
Long range transport of mercury
Deposition of mercury
Fate of organic mercury
- Due to the long-range transport characteristics of mercury, international discussion by the United Nations Environmental Program (UNEP) to reduce the global usage of mercury, and emission control are currently being developed. To keep up with this global movement, Korea is taking part in the UNEP partnership program for reducing the emission of mercury from coal-powered plants, and is willing to have as many global partnerships as possible to prepare for an international agreement on mercury reduction. In order to keep up with these national and international trends on mercury, in this review paper, we provided the general backgrounds on emission sources of mercury, fate and transport mechanisms of mercury including MeHg, the distribution of mercury in environmental media, and the exposure routes of mercury to humans. This review can help the readers to understand the theoretical background of mercury's fate and transport and exposure to humans for risk assessment.
CONCLUSION
- 1. United Nations Environment Programme. The global atmospheric mercury assessment: sources, emissions and transport. 2008. Geneva: United Nations Environment Programme; p. 13-62
- 2. Cranmer M, Gilbert S, Cranmer J. Neurotoxicity of mercury--indicators and effects of low-level exposure: overview. Neurotoxicology 1996;17(1):9-14. 8784814PubMed
- 3. Ministry of Environment. Development of management of the products containing mercury. 2005. Gwacheon: Ministry of Environment; p. 26-31 (Korean)
- 4. Ministry of Environment. Basic study of heavy metal levels among Korean adult in 2005. 2006. Gwacheon: Ministry of Environment; p. 69-86 (Korean)
- 5. United Nations Environment Programme. Global mercury assessment. 2002. Geneva: United Nations Environment Programme; p. 13-42
- 6. Schroeder WH, Munthe J. Atmospheric mercury: an overview. Atmos Environ 1998;32(5):809-822Article
- 7. Mason RP, Fitzgerald WF, Morel MM. The biogeochemical cycling of elemental mercury: anthropogenic influences. Geochim Cosmochim Acta 1994;58(15):3191-3198Article
- 8. Han YJ, Holsen TM, Lai SO, Hopke PK, Yi SM, Liu W, et al. Atmospheric gaseous mercury concentration in New York State: relationships with meterological data and other pollutants. Atmos Environ 2004;38(37):6431-6446Article
- 9. Park JS, Oh S, Shin MY, Kim MK, Yi SM, Zoh KD. Seasonal variation in dissolved gaseous mercury and total mercury concentrations in Juam Reservoir, Korea. Environ Pollut 2008;154(1):12-20. 18243450ArticlePubMed
- 10. Selin NE, Jacob DJ, Park RJ, Yantosca RM, Strode S, Jaegle L, et al. Chemical cycling and deposition of atmospheric mercury: global constraints from observations. J Geophys Res 2007;112: D02308Article
- 11. Munthe J, Wangberg I, Iverfeldt A, Lindqvist O, Stromberg D, Sommar J, et al. Distribution of atmospheric mercury species in Northern Europe: final results from the MOE project. Atmos Environ 2003;37(Suppl 1):S9-S20Article
- 12. Pacyna EG, Pacyna JM, Steenhuisen F, Wilson S. Global anthropogenic mercury emission inventory for 2000. Atmos Environ 2006;40(22):4048-4063Article
- 13. Hylander LD, Meili M. 500 years of mercury production: global annual inventory by region until 2000 and associated emissions. Sci Total Environ 2003;304(1-3):13-27. 12663168ArticlePubMed
- 14. Wilson SJ, Steenhuisen F, Pacyna JM, Pacyna EG. Mapping the spatial distribution of global anthropogenic mercury atmospheric emission inventories. Atmos Environ 2006;40(24):4621-4632Article
- 15. Nelson PF. Atmospheric emissions of mercury from Australian point sources. Atmos Environ 2007;41(8):1717-1724Article
- 16. Jiang GB, Shi JB, Feng XB. Mercury pollution in China. An overview of the past and current sources of the toxic metal. Environ Sci Technol 2006;40(12):3673-3678. 16830526PubMed
- 17. Pacyna EG, Pacyna JM. Global emission of mercury from anthropogenic sources in 1995. Water Air Soil Pollut 2002;137(1-4):149-165Article
- 18. Gan SY, Yi SM, Han YJ. Characteristics of atmospheric speciated gaseous mercury in Chuncheon, Korea. J Korean Soc Environ Eng 2009;31(5):382-391. (Korean)
- 19. Wu Y, Wang S, Streets DG, Hao J, Chan M, Jiang J. Trends in anthropogenic mercury emissions in China from 1995 to 2003. Environ Sci Technol 2006;40(17):5312-5318. 16999104ArticlePubMed
- 20. Wang SX, Zhang L, Li GH, Wu Y, Hao JM, Pirrone N, et al. Mercury emission and speciation of coal-fired power plants in China. Atmos Chem Phys 2010;10: 1183-1192Article
- 21. Feng X, Streets D, Hao J, Wu Y, Li G. In: Pirrone N, Mason RP, editors. Mercury emissions from industrial sources in China. Mercury fate and transport in the global atmosphere. 2009. New York: Springer; p. 67-79Article
- 22. Streets DG, Hao J, Wang S, Wu Y. In: Pirrone N, Mason RP, editors. Mercury emissions from coal combustion in China. Mercury fate and transport in the global atmosphere. 2009. New York: Springer; p. 51-65Article
- 23. Pirrone N, Cinnirella S, Feng X, Finkelman RB, Friedli HR, Leaner J, et al. Global mercury emissions to the atmosphere from anthropogenic and natural sources. Atmos Chem Phys Discuss 2010;10: 4719-4752Article
- 24. Schuster PF, Krabbenhoft DP, Naftz DL, Cecil LD, Olson ML, Dewild JF, et al. Atmospherc mercury deposition during the last 270 years: a glacial ice core record of natural and anthropogenic sources. Environ Sci Technol 2002;36(11):2303-2310. 12075781ArticlePubMed
- 25. Wagemann R, Innes S, Richard PR. Overview and regional and temporal differences of heavy metals in Arctic whales and ringed seals in the Canadian Arctic. Sci Total Environ 1996;186(1-2):41-66. 8685709ArticlePubMed
- 26. Evers DC, Kapaln JD, Reaman PS, Meyer MW, Braselton WE, Major A, et al. Geographic trend in mercury measured in comon loon feathers and blood. Environ Toxicol Chem 1998;17(2):173-183Article
- 27. Muir D, Fisk A, Kwan M. In: Kalhok S, editor. Temporal trends of persistent organic pollutants and metals in ringed seals from the Canadian Arctic. Synopsis of research conducted under the 2000-2001 Northern Contaminants Program. 2001. Ottawa: Indian and Northern Affairs; p. 208-214
- 28. Seigneur C, Vijayaraghavan K, Lohman K, Karamchandani P, Scott C. Global source attribution for mercury deposition in the United States. Environ Sci Technol 2004;38(2):555-569. 14750733ArticlePubMed
- 29. Weiss-Penzias P, Jaffe DA, Swartzendruber P, Dennison JB, Chand D, Hafner W, et al. Observations of Asian air pollution in the free troposphere at Mount Bachelor Observatory during the spring of 2004. J Geophys Res 2006;111: D10304Article
- 30. Fitzgerald WF, Mason RP, Vandal GM. Atmospheric cycling and air-water exchange of mercury over mid-continental regions. Water Air Soil Pollut 1991;56(1):745-767Article
- 31. Keeler GJ, Hoyer ME, Lamborg CH. In: Watras CJ, Huckabee JW, editors. Measurements of atmospheric mercury in the Great Lakes basin. Mercury pollution: integration and synthesis. 1994. Boca Raton: Lewis Publishers; p. 231-241
- 32. Slemr F, Schuster G, Seiler W. Distribution, speciation, and budget of atmospheric mercury. J Atmos Chem 1985;3(4):407-434Article
- 33. Tokos J, Hall B, Calhoun J, Prestbo EM. Homogeneous gasphase reaction of Hg0 with H2O2, O3, CH3I, and(CH3)2S: implications for atmospheric Hg cycling. Atmos Environ 1998;32(5):823-827Article
- 34. Amyot M, Mierle G, Lean D, McQueen DJ. Effects of solar radiation on the formation of dissolved gaseous mercury in temperature lakes. Geochim Cosmochim Acta 1997;61(5):975-987Article
- 35. Waite DT, Snihura AD, Liu Y, Huang GH. Uptake of atmospheric mercury by deionized water and aqueous solutions of inorganic salts at acidic, neutral and alkaline pH. Chemosphere 2002;49(3):341-351. 12363314ArticlePubMed
- 36. Ravichandran M. Interactions between mercury and dissolved organic matter: a review. Chemosphere 2004;55(3):319-331. 14987930ArticlePubMed
- 37. Zhang H, Lindberg SE. Sunlight and iron(III)-induced photochemical production of dissolved gaseous mercury in freshwater. Environ Sci Technol 2001;35(5):928-935. 11351537ArticlePubMed
- 38. Xiao ZF, Munthe J, Schroeder WH, Lindqvist O. Vertical fluxes of volatile mercury over forest soil and lake surfaces in Sweden. Tellus B 1991;43(3):267-279Article
- 39. Lindberg SE, Meyers TP, Munthe J. Evasion of mercury vapor from the surface of a recently limed acid forest lake in Sweden. Water Air Soil Pollut 1995;85(2):725-730Article
- 40. Ullrich SM, Tanton TW, Abdrashitova SA. Mercury in the aquatic environment: a review of factors affecting methylation. Crit Rev Environ Sci Technol 2001;31(3):241-293Article
- 41. Selvendiran P, Driscoll CT, Bushey JT, Montesdeoca MR. Wetland influence on mercury fate and transport in a temperate forested watershed. Environ Pollut 2008;154(1):46-55. 18215448ArticlePubMed
- 42. Mason RP, Reinfelder JR, Morel FM. Bioaccumulation of mercury and methylmercury. Water Air Soil Pollut 1995;80(1-4):915-921Article
- 43. Clerckner LB, Gilmour CC, Hurley JP, Krabbenhoft DP. Mercury methylation in periphyton of the Florida everglades. Limnol Oceanogr 1999;44(7):1815-1825Article
- 44. Sellers P, Kelly CA, Rudd JW. Fluxes of methylmercury to the water column of a drainage lake: the relative importance of internal and external sources. Limnol Oceanogr 2001;46(3):623-631Article
- 45. Hintelmann H, Harris R, Heyes A, Hurley JP, Kelly CA, Krabbenhoft DP, et al. Reactivity and mobility of new and old mercury deposition in a boreal forest ecosystem during the first year of the METAALICUS study. Mercury experiment to assess atmospheric loading in Canada and the US. Environ Sci Technol 2002;36(23):5034-5040. 12523417ArticlePubMed
- 46. Celo V, Lean DR, Scott SL. Abiotic methylation of mercury in the aquatic environment. Sci Total Environ 2006;368(1):126-137. 16226793ArticlePubMed
- 47. Eckley CS, Hintelmann H. Determination of mercury methylation potentials in the water column of lakes across Canada. Sci Total Environ 2006;368(1):111-125. 16216310ArticlePubMed
- 48. US Environmental Protection Agency. The mercury study report to congress. 1997. cited 2012 Nov 1. Available from: http://www.epa.gov/mercury/report.htm
- 49. US Environmental Protection Agency. Lake Michigan Mass Balance. cited 2012 Nov 1. Available from: http://www.epa.gov/glnpo/lmmb
- 50. Mason RP, Lawson NM, Sheu GR. Annual and seasonal trends in mercury deposition in Maryland. Atmos Environ 2000;34(11):1691-1701Article
- 51. Sakata M, Marumoto K. Wet and dry deposition fluxes of mercury in Japan. Atmos Environ 2005;39(17):3139-3146Article
- 52. Keeler GJ, Landis MS, Norris GA, Christianson EM, Dvonch JT. Sources of mercury wet deposition in Eastern Ohio, USA. Environ Sci Technol 2006;40(19):5874-5881. 17051773ArticlePubMed
- 53. Lai S, Holsen TM, Hopke PK, Liu P. Wet deposition of mercury at a New York state rural site: concentrations, fluxes, and source areas. Atmos Environ 2007;41(21):4337-4348Article
- 54. Guo Y, Feng X, Li Z, He T, Yan H, Meng B, et al. Distribution and wet deposition fluxes of total and methyl mercury in Wujiang River Basin, Guizhou, China. Atmos Environ 2008;42(30):7096-7103Article
- 55. Selin NE, Jacob DJ. Seasonal and spatial patterns of mercury wet deposition in the Unites States: constraints on the contribution from North American anthropogenic sources. Atmos Environ 2008;42(21):5193-5204Article
- 56. Prestbo EM, Gay DA. Wet deposition of mercury in the U.S. and Canada, 1996-2005: results and analysis of the NADP mercury deposition network (MDN). Atmos Environ 2009;43(27):4223-4233Article
- 57. Seo YS, Han YJ, Choi HD, Holsen TM, Yi SM. Characteristics of total mercury (TM) wet deposition: scavenging of atmospheric mercury species. Atmos Environ 2012;49: 69-76Article
- 58. Ahn MC, Yi SM, Holsen TM, Han YJ. Mercury wet deposition in rural Korea: concentrations and fluxes. J Environ Monit 2011;13: 2748-2754. 21863180ArticlePubMed
- 59. Oh S, Kim MK, Yi SM, Zoh KD. Distributions of total mercury and methylmercury in surface sediments and fishes in Lake Shihwa, Korea. Sci Total Environ 2010;408(5):1059-1068. 19945147ArticlePubMed
- 60. Choi EM, Kim SH, Holsen TM, Yi SM. Total gaseous concentrations in mercury in Seoul, Korea: local sources compared to long-range transport from China and Japan. Environ Pollut 2009;157(3):816-822. 19110355ArticlePubMed
- 61. Hertz-Picciotto I, Green PG, Delwiche L, Hansen R, Walker C, Pessah IN. Blood mercury concentrations in CHARGE Study children with and without autism. Environ Health Perspect 2010;118(1):161-166. 20056569ArticlePubMedPMC
- 62. World Health Organization. Mercury: children's health and the environment. 2008. cited 2012 Nov 1. Available from: http://www.who.int/ceh/capacity/Mercury.pdf
REFERENCES
| Region1 | Africa | Asia (excluding Russia) | Europe (excluding Russia) | North America | Oceania | Russia | South America | Total |
|---|---|---|---|---|---|---|---|---|
| Stationary combustion | 37.3 | 622 | 76.6 | 71.2 | 19.0 | 46.0 | 8.0 | 880 |
| Non-ferrous metal production | 2.1 | 90.0 | 18.7 | 5.7 | 6.1 | 5.2 | 13.6 | 141 |
| Pig iron and steel production | 1.6 | 24.1 | 18.7 | 14.4 | 0.8 | 2.6 | 1.8 | 45.4 |
| Cement production | 10.9 | 138 | 18.8 | 10.9 | 0.4 | 3.9 | 6.4 | 189 |
| Gold production | 8.9 | 58.9 | 0.0 | 12.9 | 10.1 | 4.3 | 16.2 | 111 |
| Mercury production (primary sources) | 0.0 | 8.8 | 0.0 | 0.0 | 0.0 | 0.0 | 0.0 | 8.8 |
| Waste incineration2 | 0.6 | 5.7 | 10.1 | 15.1 | 0.0 | 3.5 | 0.0 | 35.0 |
| Caustic soda production | 0.1 | 28.7 | 6.3 | 6.5 | 0.2 | 2.8 | 2.2 | 46.8 |
| Other sources | 0.0 | 0.6 | 14.7 | 7.2 | 0.0 | 1.5 | 1.5 | 25.5 |
| Total | 61.6 | 977 | 145 | 144 | 36.6 | 69.8 | 49.6 | 1480 |
From United Nations Environment Programme. The global atmospheric mercury assessment: sources, emissions and transport. Geneva: United Nations Environment Programme; 2008 [1].
1 Africa: Burkina Faso and South Africa; Asia: Cambodia, Japan, Philippines, and Republic of Korea; Europe: All countries; North America: USA and Canada; Oceania: Australia; Russia: Russia; South America: Chile and Peru.
2 Waste incineration estimates are derived from national statistics and official reporting which are judged to be incomplete for regions other than Europe and the United States. Estimates of mercury emissions from waste incineration and handling were also made based on regional consumption of mercury in products and combined data were used in the overall assessment of total emissions and geographical distribution.
| Site (country) | Sampling period | Precipitation depth (mm) | Concentration (ng L-1) | Annual flux (μgm-2 yr-1) | Site characteristics |
|---|---|---|---|---|---|
| Kentucky (USA)1 | Jan-Dec 2006 | 1286 | 8.8 | 10.2 | Rural |
| Virginia (USA)1 | Jan-Dec 2006 | 1446 | 7.7 | 7.6 | Rural |
| Eagle Harbor, Michigan (USA)1 | Jan-Dec 2003 | 645 | 8.3 | 5.2 | Rural |
| Pellston, Michigan (USA)1 | Jan-Dec 2003 | 787 | 9.4 | 7.4 | Rural |
| Dexter, Michigan (USA)1 | Jan-Dec 2003 | 896 | 11.9 | 10.7 | Rural |
| Potsdam, New York (USA)1 | Jan-Dec 2004 | 1100 | 5.5 | 5.9 | Rural |
| Steubenville, Ohio (USA)1 | Jan-Dec 2003 | 948 | 14.0 | 13.5 | Urban |
| Hokkaido (Japan)1 | Dec 2002-Nov 2003 | 882 | 8.0 | 7.1 | Rural |
| Aichi (Japan)1 | Dec 2002-Nov 2003 | 1679 | 7.8 | 13.1 | Urban |
| Hyogo (Japan)1 | Dec 2002-Nov 2003 | 1481 | 9.5 | 14.0 | Urban |
| Tokyo (Japan)1 | Dec 2002-Nov 2003 | 1912 | 8.7 | 16.7 | Urban |
| Wujiang River, Guizhou (China)1 | Jan-Dec 2006 | 963 | 36.0 | 34.7 | Rural |
| Seoul (Korea)1 | Jan-Dec 2007 | 1235 | 16.3 | 20.2 | Urban |
| Chuncheon (Korea)2 | Aug 2006-Jul 2008 | 1062 | 8.8 | 9.4 | Rural |
From Park JS, et al. Environ Pollut 2008;154(1):12-20 [9] and references cited therein.
DGM, dissolved gaseous mercury.
From World Health Organization. Mercury: children’s health and the environment; 2008 (Internet) [62].
Figure & Data
References
Citations
- A renewable and functionalized chitosan gel bead for statically and dynamically capturing aquatic Hg(II) with a prominent capacity
Zhiheng Zhang, Zixuan Chen, Haiying Lin, Qingge Feng, Bin Xue, Mingen Li, Mingzhi Li, Yu Duan, Junqi Wei
Separation and Purification Technology.2024; 328: 124941. CrossRef - HgCl2 Calibration Gas Generated by a Solid Oxidant
Yuxing Zhou, Haiyang Li, Haitao Hu, Yufeng Duan
Energy & Fuels.2024; 38(5): 4526. CrossRef - Sulfur functionalized biocarbon sorbents for low-concentration mercury isolation
Douglas Austin, Kousar Jahan, Xu Feng, Jared Carney, Dale K. Hensley, Jihua Chen, Brianna E. Altidor, Zhiyong Guo, Elizabeth Michaelis, Mariana K. Kebaso, Yanfeng Yue
Dalton Transactions.2024; 53(5): 2098. CrossRef - Genomic and transcriptomic characterization of methylmercury detoxification in a deep ocean Alteromonas mediterranea ISS312
Carla Pereira-Garcia, Isabel Sanz-Sáez, Pablo Sánchez, Felipe H. Coutinho, Andrea G. Bravo, Olga Sánchez, Silvia G. Acinas
Environmental Pollution.2024; 347: 123725. CrossRef - Field method for preservation of total mercury in waters, including those associated with artisanal scale gold mining
David C. P. King, Michael J. Watts, Elliott M. Hamilton, Robert J. G. Mortimer, Mike Coffey, Odipo Osano, Maureene Auma Ondayo, Marcello Di Bonito
Analytical Methods.2024; 16(17): 2669. CrossRef - Assessment of Mercury Contamination in Water and Soil from Informal Artisanal Gold Mining: Implications for Environmental and Human Health in Darmali Area, Sudan
Ahmed Elwaleed, Huiho Jeong, Ali H. Abdelbagi, Nguyen Thi Quynh, Willy Cahya Nugraha, Tetsuro Agusa, Yasuhiro Ishibashi, Koji Arizono
Sustainability.2024; 16(10): 3931. CrossRef - The effect of arsenic, cadmium, mercury, and lead on the genotoxic activity of Boletaceae family mushrooms present in Serbia
Marija Dimitrijević, M. Stanković, J. Nikolić, V. Mitić, V. Stankov Jovanović, G. Stojanović, D. Miladinović
Journal of Toxicology and Environmental Health, Part A.2023; 86(1): 23. CrossRef - The role and mechanism of unfolded protein response signaling pathway in methylmercury‐induced apoptosis of mouse spermatocytes germ cell‐2 cells
Xiayu Zhang, Huifang Hao, Kai Ma, Huan Pang, Xinyue Li, Tiantian Tian, Shanshan Hou, Xiaofan Ning, Hao Wu, Qiaohong Hou, Meng Li, Yunxiang Sun, Xiuling Song, Minghua Jin
Environmental Toxicology.2023; 38(2): 472. CrossRef - Gaseous elemental mercury (GEM) exchange flux from soil-vegetation to atmosphere at a meadow steppe
Zhili Feng, Tingting Xiao, Qing Xu, Gang Zhang, Deli Wang
Biogeochemistry.2023; 162(2): 267. CrossRef - The present and potential future of aqueous mercury preservation: a review
David C. P. King, Michael J. Watts, Elliott M. Hamilton, Robert Mortimer, David P. A. Kilgour, Marcello Di Bonito
Environmental Science: Processes & Impacts.2023; 25(3): 351. CrossRef - Chitosan-Based Polymer Nanocomposites for Environmental Remediation of Mercury Pollution
Mvula Confidence Goci, Anny Leudjo Taka, Lynwill Martin, Michael John Klink
Polymers.2023; 15(3): 482. CrossRef - Mercury content in commercial fishes of the Barents Sea (based on long-term data)
M. A. Novikov, E. A. Gorbacheva, M. N. Kharlamova
Trudy VNIRO.2023; 191: 112. CrossRef - HgCl2 addition to pore water samples from cold seeps can affect the geochemistry of dissolved inorganic carbon ([DIC], δ13CDIC)
Claudio Argentino, Dimitri Kalenitchenko, Matteus Lindgren, Giuliana Panieri
Marine Chemistry.2023; 251: 104236. CrossRef - Assessment of mercury bioavailability in garden soils around a former nonferrous metal mining area using DGT, accumulation in vegetables, and implications for health risk
Marin Senila, Erika Andrea Levei, Tiberiu Frentiu, Cristina Mihali, Simion Bogdan Angyus
Environmental Monitoring and Assessment.2023;[Epub] CrossRef - Bioaccumulation of Some Metals and Metalloids in Laughing Gulls (Leucophaeus atricilla): Increases in Mercury and Decreases in Selenium from 2019 to 2022/2023
Joanna Burger, Stephanie Feigin, Alinde Fojtik, Amanda Dey, Kelly Ng
Toxics.2023; 11(12): 1007. CrossRef - Heavy metal ion detection using green precursor derived carbon dots
Simei Darinel Torres Landa, Naveen Kumar Reddy Bogireddy, Inderbir Kaur, Vandana Batra, Vivechana Agarwal
iScience.2022; 25(2): 103816. CrossRef - Numerical simulation of sorbent injection into flue gas for mercury removal in Coal-Fired power Plant. Part 1. Model establishment and validation
Ao Shen, Yuqing Wang, Runlin Wang, Yufeng Duan, Jun Tao, Xiaobing Gu, Peng Wang, Zhong Xu
Fuel.2022; 326: 124931. CrossRef - Trace Metals Contamination in Riverine Captured Fish and Prawn of Bangladesh and Associated Health Risk
Md. Khalid Hasan, Abrar Shahriar, Nazmul Hossain, Ibrahim Khulilullah Shovon, Anwar Hossain, Yeasmin Nahar Jolly, Bilkis Ara Begum
Exposure and Health.2021; 13(2): 237. CrossRef - Accumulation of Trace Metals in Indigenous Fish Species from the Old Brahmaputra River in Bangladesh and Human Health Risk Implications
Sabikunnahar Shorna, Saika Shawkat, Anwar Hossain, Shamshad B. Quraishi, A. K. M. Atique Ullah, Mohammad Mozammal Hosen, Md. Kamal Hossain, Badhan Saha, Bijoya Paul, Md. Habibullah-Al-Mamun
Biological Trace Element Research.2021; 199(9): 3478. CrossRef - Tetraphenylethene-based fluorescent probe with aggregation-induced emission behavior for Hg2+ detection and its application
Muthusamy Selvaraj, Kanagaraj Rajalakshmi, Dae-Hwan Ahn, Su-Jin Yoon, Yun-Sik Nam, Yeonhee Lee, Yuanguo Xu, Jong-Won Song, Kang-Bong Lee
Analytica Chimica Acta.2021; 1148: 238178. CrossRef - Variation in Methylmercury Metabolism and Elimination in Humans: Physiological Pharmacokinetic Modeling Highlights the Role of Gut Biotransformation, Skeletal Muscle, and Hair
Quintin Pope, Matthew D Rand
Toxicological Sciences.2021; 180(1): 26. CrossRef - Assessment of heavy metal(loid)s in selected small indigenous species of industrial area origin freshwater fish and potential human health risk implications in Bangladesh
Maesha Musarrat, A.K.M. Atique Ullah, Naznin Shultana Moushumi, Shamima Akon, Quamrun Nahar, Syeda Saliha Saliheen Sultana, Shamshad B. Quraishi
LWT.2021; 150: 112041. CrossRef - Ecotoxicological effects of microplastics on aquatic organisms: a review
Huu Cong Vo, Minh Hen Pham
Environmental Science and Pollution Research.2021; 28(33): 44716. CrossRef - Metal(loid) speciation and transformation by aerobic methanotrophs
Obulisamy Parthiba Karthikeyan, Thomas J. Smith, Shamsudeen Umar Dandare, Kamaludeen Sara Parwin, Heetasmin Singh, Hui Xin Loh, Mark R Cunningham, Paul Nicholas Williams, Tim Nichol, Avudainayagam Subramanian, Kumarasamy Ramasamy, Deepak Kumaresan
Microbiome.2021;[Epub] CrossRef - Gaseous Elemental Mercury Exchange Fluxes over Air-Soil Interfaces in the Degraded Grasslands of Northeastern China
Gang Zhang, Xuhang Zhou, Xu Li, Lei Wang, Xiangyun Li, Zheng Luo, Yangjie Zhang, Zhiyun Yang, Rongfang Hu, Zhanhui Tang, Deli Wang, Zhaojun Wang
Biology.2021; 10(9): 917. CrossRef - Ecological risk assessment of trace metals in sediment from the Old Brahmaputra River in Bangladesh
Sabikunnahar Shorna, Shamshad B. Quraishi, Mohammad Mozammal Hosen, Md Kamal Hossain, Badhan Saha, Anwar Hossain, Md. Habibullah-Al-Mamun
Chemistry and Ecology.2021; 37(9-10): 809. CrossRef - High Mercury Levels in the Indigenous Population of the Yaigojé Apaporis National Natural Park, Colombian Amazon
Juan Valdelamar-Villegas, Jesus Olivero-Verbel
Biological Trace Element Research.2020; 194(1): 3. CrossRef - The effects of selenium biofortification on mercury bioavailability and toxicity in the lettuce-slug food chain
Anja Kavčič, Bojan Budič, Katarina Vogel-Mikuš
Food and Chemical Toxicology.2020; 135: 110939. CrossRef - Diffuse emission and transport of gaseous elemental mercury (GEM) in the Mapamyum geothermal system, Western Tibet (China)
Yutao Sun, Zhengfu Guo, Jianguo Du, Wenbin Zhao
Journal of Volcanology and Geothermal Research.2020; 397: 106825. CrossRef - Computational Chemistry-Based Evaluation of Metal Salts and Metal Oxides for Application in Mercury-Capture Technologies
Sean A. Tacey, Tibor Szilvási, James J. Schauer, Manos Mavrikakis
Industrial & Engineering Chemistry Research.2020; 59(19): 9015. CrossRef - The association between mercury concentrations and lipid profiles in the Korean National Environmental Health Survey (KoNEHS) cycle 3
Soo Ho Sohn, Han Cheol Heo, Seongmin Jo, Chulyong Park, Joon Sakong
Annals of Occupational and Environmental Medicine.2020;[Epub] CrossRef - The dietary intake of mercury from rice and human health risk in artisanal small-scale gold mining area, Indonesia
Randy Novirsa, Quang Phan Dinh, Huiho Jeong, Sylvester Addai-Arhin, Willy Cahya Nugraha, Nana Hirota, Bambang Wispriyono, Yasuhiro Ishibashi, Koji Arizono
Fundamental Toxicological Sciences.2020; 7(5): 215. CrossRef - Tissue-specific Nrf2 signaling protects against methylmercury toxicity in Drosophila neuromuscular development
Jakob T. Gunderson, Ashley E. Peppriell, Daria Vorojeikina, Matthew D. Rand
Archives of Toxicology.2020; 94(12): 4007. CrossRef - Characteristics and Performances of a Nanostructured Material for Passive Samplers of Gaseous Hg
Joshua Avossa, Fabrizio De Cesare, Paolo Papa, Emiliano Zampetti, Andrea Bearzotti, Marcello Marelli, Nicola Pirrone, Antonella Macagnano
Sensors.2020; 20(21): 6021. CrossRef - Mercury Involvement in Neuronal Damage and in Neurodegenerative Diseases
Veronica Lanza Cariccio, Annalisa Samà, Placido Bramanti, Emanuela Mazzon
Biological Trace Element Research.2019; 187(2): 341. CrossRef - Mercury health risk assessment among petrochemical workers in Rayong Province, Thailand
Wantanee Phanprasit, Maytiya Muadchim, Jeongim Park, Mark Gregory Robson, Dusit Sujirarat, Suphaphat Kwonpongsagoon, Sara Arphorn
Human and Ecological Risk Assessment: An International Journal.2019; 25(6): 1448. CrossRef - Diurnal fluxes of gaseous elemental mercury from the water-air interface in coastal environments of the northern Adriatic Sea
Federico Floreani, Alessandro Acquavita, Elisa Petranich, Stefano Covelli
Science of The Total Environment.2019; 668: 925. CrossRef - Distribution of mercury and methylmercury in surface water and surface sediment of river, irrigation canal, reservoir, and wetland in Taiwan
Ying-Lin Wang, Meng-Der Fang, Ling-Chu Chien, Chu-Ching Lin, Hsing-Cheng Hsi
Environmental Science and Pollution Research.2019; 26(17): 17762. CrossRef - Testicular Cancer: Genes, Environment, Hormones
Luca De Toni, Iva Šabovic, Ilaria Cosci, Marco Ghezzi, Carlo Foresta, Andrea Garolla
Frontiers in Endocrinology.2019;[Epub] CrossRef - The Putative Role of Environmental Mercury in the Pathogenesis and Pathophysiology of Autism Spectrum Disorders and Subtypes
G. Morris, B. K. Puri, R. E. Frye, M. Maes
Molecular Neurobiology.2018; 55(6): 4834. CrossRef - Prenatal mercury exposure, fish intake and neurocognitive development during first three years of life: Prospective cohort mothers and Children's environmental health (MOCEH) study
Yeni Kim, Eun-Hee Ha, Hyesook Park, Mina Ha, Yangho Kim, Yun-Chul Hong, Eun Jung Lee, Hyesook Kim, Namsoo Chang, Bung-Nyun Kim
Science of The Total Environment.2018; 615: 1192. CrossRef - Blood mercury concentration, fish consumption and anthropometry in Chinese children: A national study
Zhen-Yan Gao, Min-Ming Li, Ju Wang, Jin Yan, Can-Can Zhou, Chong-Huai Yan
Environment International.2018; 110: 14. CrossRef - Effects of phosphorus on uptake and translocation of methylmercury in rice
Axiang Gao, Xinbin Zhou, Chengming Zhang, Xinhua He
Toxicological & Environmental Chemistry.2018; 100(1): 68. CrossRef - Passive Sampling of Gaseous Elemental Mercury Based on a Composite TiO2NP/AuNP Layer
Antonella Macagnano, Paolo Papa, Joshua Avossa, Viviana Perri, Marcello Marelli, Francesca Sprovieri, Emiliano Zampetti, Fabrizio De Cesare, Andrea Bearzotti, Nicola Pirrone
Nanomaterials.2018; 8(10): 798. CrossRef - The new Israeli feed safety law: challenges in relation to animal and public health
Shimon Barel, Dani Elad, Olga Cuneah, Jakob A Shimshoni
Journal of the Science of Food and Agriculture.2017; 97(4): 1073. CrossRef - Regional and temporal trends in blood mercury concentrations and fish consumption in women of child bearing Age in the united states using NHANES data from 1999–2010
Leanne K. Cusack, Ellen Smit, Molly L. Kile, Anna K. Harding
Environmental Health.2017;[Epub] CrossRef - Prediction of child language development: A review of literature in early childhood communication disorders
Faizah Saleh AlHammadi
Lingua.2017; 199: 27. CrossRef - Wetland management using microbial indicators
Hidetoshi Urakawa, Anne E. Bernhard
Ecological Engineering.2017; 108: 456. CrossRef - Mortality and transcriptional effects of inorganic mercury in the marine copepod Calanus finmarchicus
Knut Erik Tollefsen, You Song, Tore Høgåsen, Ida Beathe Øverjordet, Dag Altin, Bjørn Henrik Hansen
Journal of Toxicology and Environmental Health, Part A.2017; 80(16-18): 845. CrossRef - Antioxidant and mercury chelating activity of Psidium guajava var. pomifera L. leaves hydroalcoholic extract
Antonio Ivanildo Pinho, Cláudia Sirlene Oliveira, Fabricio Luís Lovato, Emily Pansera Waczuk, Bruna Candia Piccoli, Aline Augusti Boligon, Nadghia Figueredo Leite, Henrique Douglas Melo Coutinho, Thais Posser, João Batista Teixeira Da Rocha, Jeferson Luis
Journal of Toxicology and Environmental Health, Part A.2017; 80(23-24): 1301. CrossRef - Recent trends in common chemical feed and food contaminants in Israel
J. A. Shimshoni, S. Barel
Journal of Environmental Science and Health, Part C.2017; 35(4): 189. CrossRef - Case study of occupational mercury exposure during decontamination of turnaround in refinery plant
Maytiya Muadchim, Wantanee Phanprasit, Mark Gregory Robson, Dusit Sujirarat, Rawee Detchaipitak
International Journal of Occupational and Environmental Health.2017; 23(1): 81. CrossRef - Methylmercury Increases and Eicosapentaenoic Acid Decreases the Relative Amounts of Arachidonic Acid‐Containing Phospholipids in Mouse Brain
Ying‐Xu Zeng, Zhen‐Yu Du, Svein Are Mjøs, Bjørn Grung, Lisa K. Midtbø
Lipids.2016; 51(1): 61. CrossRef - Country-specific estimates of the incidence of intellectual disability associated with prenatal exposure to methylmercury
David C. Bellinger, Keri O’Leary, Holly Rainis, Herman J. Gibb
Environmental Research.2016; 147: 159. CrossRef - Alterations in biochemical markers due to mercury (Hg) exposure and its influence on infant's neurodevelopment
Iman Al-Saleh, Rola Elkhatib, Reem Al-Rouqi, Mai Abduljabbar, Chafica Eltabache, Tahreer Al-Rajudi, Michael Nester
International Journal of Hygiene and Environmental Health.2016; 219(8): 898. CrossRef - Mercury accumulation and its effects on molecular, physiological, and histopathological responses in the peacock blenny Salaria pavo
Azza Naïja, Justine Marchand, Patrick Kestemont, Zohra Haouas, Ronny Blust, Benoit Chénais, Ahmed Noureddine Helal
Environmental Science and Pollution Research.2016; 23(21): 22099. CrossRef - Atg5-dependent autophagy plays a protective role against methylmercury-induced cytotoxicity
Yasukazu Takanezawa, Ryosuke Nakamura, Yuka Sone, Shimpei Uraguchi, Masako Kiyono
Toxicology Letters.2016; 262: 135. CrossRef - Evaluation of Various Inorganic and Biological Extraction Techniques Suitability for Soil Mercury Phytoavailable Fraction Assessment
Michal Hlodák, Peter Matúš, Martin Urík, Lucia Kořenková, Petra Mikušová, Marin Senila, Pavel Diviš
Water, Air, & Soil Pollution.2015;[Epub] CrossRef - Prenatal chemical exposures and child language development
Kelsey L.C. Dzwilewski, Susan L. Schantz
Journal of Communication Disorders.2015; 57: 41. CrossRef - Metallic Profile of Whole Blood and Plasma in a Series of 99 Healthy Children
Jean-Pierre Goullé, Pascal Le Roux, Mireille Castanet, Loïc Mahieu, Stéphanie Guyet-Job, Michel Guerbet
Journal of Analytical Toxicology.2015; 39(9): 707. CrossRef - Evaluation of the use of metallothionein as a biomarker for detecting physiological responses to mercury exposure in the bonnethead, Sphyrna tiburo
Christina J. Walker, James Gelsleichter, Douglas H. Adams, Charles A. Manire
Fish Physiology and Biochemistry.2014; 40(5): 1361. CrossRef - Trends in blood mercury concentrations and fish consumption among U.S. women of reproductive age, NHANES, 1999–2010
Rebecca Jeffries Birch, Jeff Bigler, John W. Rogers, Yan Zhuang, Robert P. Clickner
Environmental Research.2014; 133: 431. CrossRef - Methylmercury impairs motor function in early development and induces oxidative stress in cerebellar granule cells
Eshan Patel, Mindy Reynolds
Toxicology Letters.2013; 222(3): 265. CrossRef
 PubReader
 ePub Link
 Cite
Cite

