
Articles
- Page Path
- HOME > J Prev Med Public Health > Volume 46(1); 2013 > Article
-
Original Article
The Relationship Between the Social Network of Community-living Elders and Their Health-related Quality of Life in Korean Province - Jun Tae Lim1, Jong-Heon Park2, Jin-Seok Lee1,2, Juhwan Oh2, Yoon Kim1,2
-
Journal of Preventive Medicine and Public Health 2013;46(1):28-38.
DOI: https://doi.org/10.3961/jpmph.2013.46.1.28
Published online: January 31, 2013
1Department of Health Policy and Management, Seoul National University College of Medicine, Seoul, Korea.
2Institute of Health Policy and Management, Medical Research Center, Seoul National University, Seoul, Korea.
- Corresponding author: Yoon Kim, MD, PhD. 103 Daehak-ro, Jongno-gu, Seoul 110-799, Korea. Tel: +82-2-2072-3124, Fax: +82-2-2072-3124, yoonkim@snu.ac.kr
- *Current affiliation: Center for Global Medicine, Seoul National University College of Medicine, Seoul, Korea
• Received: July 19, 2012 • Accepted: December 6, 2012
Copyright © 2013 The Korean Society for Preventive Medicine
This is an Open Access article distributed under the terms of the Creative Commons Attribution Non-Commercial License (http://creativecommons.org/licenses/by-nc/3.0/) which permits unrestricted non-commercial use, distribution, and reproduction in any medium, provided the original work is properly cited.
ABSTRACT
-
Objectives
- This study aimed to collect information that will help enhance the social networks and improve the quality of life among elderly people by observing the relationship between their social network and health-related quality of life (HRQoL) and by analyzing social network factors affecting HRQoL.
-
Methods
- This study was based on the 2008 Community Health Survey in Yeoncheon County. Three hundred elders were included in the study population. We compared the revised Lubben Social Network Scale (LSNS-R) score and Euro quality of life-5 dimensions health status index by demographic characteristics and chronic disease prevalence. We analyzed the data using multiple regression and tobit regression by setting the HRQoL as the dependent variable and social network and other characteristics as the independent variables. We analyzed social network factors by using factor analysis.
-
Results
- The LSNS-R score differed significantly according to age and existence of a spouse. According to the results from the hierarchical multiple regression analysis, the LSNS-R explained 0.10 of the variance and LSNS-R friends factor explained 0.10 of the variance. The tobit regression indicated that the contribution of the LSNS-R family size factor to the regression coefficient of the independent variable that affected the HRQoL was BT=2.96, that of the LSNS-R family frequency factor was BT=3.60, and that of LSNS-R friends factor was BT=5.41.
-
Conclusions
- Social networks among elderly people had a significant effect on HRQoL and their networks of friends had a relatively higher effect than those of family members.
- The elderly population in Korea is rapidly increasing and so is the importance of their health problems. The proportion of the population of those who are 65 or older increased from 7.2% in 2000 to 11.0% in 2010. It is expected to increase to 24.3% by 2031 [1]. Along with the increase in the elderly population, the average life span is also expected to continue to rise. With such a trend, there is a growing interest in how to live a healthy life, rather than merely sustaining life. Particularly, as the nation is taking on the status of an aging society, how to maintain quality of life by remaining healthy in the later years of one's life is gaining more attention.
- Among different types of quality of life, one that is related to health in the context of health care in particular is referred to as health-related quality of life (HRQoL) [2]. HRQoL signifies the subjective quality of life that influences one's health status or one's perception of physical and mental health [3]. HRQoL indicates the overall level of health, not limited to specific diseases. Among the instruments that measure health-related quality of life, the SF-36 (QualityMetric), WHOQOL-1000 (World Health Organization), and Euro quality of life-5 dimensions (EQ-5D) indicate one's general health status. The HRQoL as measured by these instruments has been known to be associated with socioeconomic status or chronic diseases such as hypertension, heart disease, and arthritis [4,5]. Moreover, in general, the HRQoL tends to decrease in the elderly [6].
- Meanwhile, a social network signifies the network of social connections surrounding an individual and the characteristics of such interpersonal relationships [7-10]. One's social network or social support influences one's health condition. Domestic and international research has shown that stronger social ties are associated with lower age-adjusted mortality rates, higher postmyocardial infarction survival rates, and increased host resistance to rhinoviruses [11-13]. Particularly in the elderly population, it has been reported that one's social network affects type of psychological diseases, degree of healthcare facility use, overall mental health, development of and recovery from depressive symptoms, psychological pressure, and both overall mortality rates and mortality rates from cardiovascular diseases [14].
- One's social network is not only associated with diseases but also with the HRQoL. A study conducted on patients with cancer, chronic heart failure, or AIDS reported that social support through social networks was associated with HRQoL, and in a survey conducted on older adults in the state of Missouri in the USA, an increased level of social support was associated with high HRQoL [15-18]. However, in Korea, little research has been conducted on the correlation between the social networks of elderly people and their HRQoL. In this paper, we will examine the degree of correlation between community-living elders' social network and HRQoL in one county in Korea, and identify factors with a high degree of association with HRQoL among various social network factors.
INTRODUCTION
- Study Subjects
- The study was conducted for three months from September 2008 to November 2008 with people 65 years old or older, among the respondents of a community health survey in Yeoncheon County. The community health survey was administered by trained interviewers who visited a randomly selected sample of households to conduct the interviews. The interviewers gathered data on 360 items in four areas: health behavior patterns; health and immunization; disease morbidity and use of healthcare services; and injury and accidental poisoning. The primary subjects of this study were 318 respondents who were 65 or older, out of 941 in 484 households in Yeoncheon County. The final number of study subjects was 300, after excluding 18 who did not respond to social network items.
- Research Instruments
- The Lubben Social Network Scale (LSNS) is a classic instrument for assessing social networks and was developed by Lubben in 1988 for the elderly population aged 65 or older [19]. At the time of development it was composed of ten questions. Because the questionnaire can be completed in a short time and its scoring system is simple, the tool has been widely used in numerous studies and papers. In 2002, the LSNS-revised (LSNS-R), a revised version with 12 items, which distinguished between the social network of family and that of friends was developed. The LSNS-R is composed of six questions regarding family (relatives) and the same six questions regarding friends. Each item can be graded from 0 to 5 points, and the degree of support of the social network can be graded from 0 to 60 points. Higher LSNS-R scores signify a greater level of support from the social network. However, since there was no official Korean version of the LSNS-R at the time of the survey, the authors translated the English version of the LSNS-R questionnaire and used it (Appendix 1). Before being analyzed, the construct validity of the questionnaire was examined and internal reliability was estimated. A factor analysis, which was intended to examine the construct validity, showed that the items in the domain of family and that of friends were separated. The Cronbach's α estimated for the internal reliability of the tool was 0.919.
- The EQ-5D is one of the measures of HRQoL. It is composed of the five dimensions of mobility (M), self-care (SC), usual activities (UA), pain/discomfort (PD), and anxiety/depression (AD), and enables respondents to rate their health states on a 3-stage scale: no problems, moderate problems, and extreme problems [20]. The EQ-5D index applies weights to a total of 243 health states answered in the EQ-5D, and presents the HRQoL comprehensively in a single index score. In this study, we applied weights used in the current community health survey and the Korean National Health and Nutrition Examination Survey (KNHANES) to the health states [21]. Cases that reported 'no problems' for all of the five items of the EQ-5D were calculated as one point, regardless of the weights. In other cases, we applied the following weight computing formula: EQ-5D index=1-(0.0081+0.1140×M2+0.6274×M3+0.0572×SC2+0.2073×SC3+0.0615×UA2+0.2812×UA3+0.0581×PD2+0.2353×PD3+0.0675×AD2+0.2351×AD3) [22].
- Variables
- The independent variables of this study were the subjects' socio-demographic characteristics, chronic disease morbidity, and social network. The dependent variable was HRQoL. Socio-demographic characteristics were represented by gender, age, average monthly income, social status, education level, employment status, and existence of a spouse. Because the income level of the study subjects surveyed was low in general, the average monthly income was categorized as: ≤300 000, 310 000-500 000, 500 000-1 000 000, and ≥1 000 000 Korean won, as approximate quartiles (100 000 Korean won is about 100 US dollar). Education level was categorized as no education, finished elementary school, or finished middle school or more. With regard to employment status, those who answered "yes" to the question, "During the past seven days, have you worked for more than one hour to earn income, or worked for more than 18 hours as a non-paid family employee?" were classified as employed. Those who were classified as having a spouse were those who were both married currently living with their spouse. Those who were not married, or were widowed, divorced, or separated were classified as without a spouse. With regard to chronic disease morbidity, those who answered 'yes' to the question, "Have you been diagnosed with hypertension, diabetes, hyperlipidemia, or osteoarthritis?" were classified as having chronic disease. The social network was measured using the LSNR-R. The HRQoL was measured using the EQ-5D index (Table 1).
- Analysis Method
- For statistical analysis, we used SPSS version 20.0 (SPSS Inc., Chicago, IL, USA). To compare the difference between the HRQoL and social network according to socio-demographic characteristics and chronic disease morbidity, we conducted an independent samples t-test and one-way ANOVA. Also, we conducted a multiple regression analysis by forming a hierarchical regression analysis model that has socio-demographic characteristics, chronic disease morbidity, and social network as independent variables and HRQoL as a dependent variable. However, as we encountered the problem that the EQ-5D index was censored at 1.0, we also conducted a tobit regression and compared its result with that of the multiple linear regression analysis.
- To determine the components of the social network, we conducted a factor analysis. In the analysis, the number of factors was determined by considering eigenvalues greater than 1 and the final factors were determined through the factor loadings which were subjected to Varimax rotation. In order to show the relevance between each component of the social network and HRQoL, we conducted a multiple regression analysis, with components of the social network (friend factor, family size factor, and family frequency factor) as independent variables and HRQoL as a dependent variable. Lastly, we conducted a tobit regression analysis and compared its result with that of the multiple linear regression analysis.
METHODS
Lubben Social Network Scale-revised
Euro quality of life-5 dimensions
- General Characteristics of the Study Subjects
- Among the study subjects, 138 were men (46.0%) and 162 were women (54.0%). By age, the number of people who were 65 to 69 years old was 109 (36.3%), 70 to 74 years old was 104 (34.7%), and 75 or older was 87 (29.0%). With regard to the average monthly household income, 75 (25%) earned 300 000 Korean won or less, 59 (19.7%) earned 310 000 to 500 000 Korean won, 67 (22.3%) earned 510 000 to 1 000 000 Korean won, and 66 (22%) made 1 010 000 Korean won or more. By education level, 134 (44.7%) subjects had no formal education, 107 (35.7%) had finished elementary school, and 59 (19.7%) had finished middle school or more. By employment status, 93 (31.0%) were employed and 207 (69.0%) were not employed. With regard to existence of a spouse, 185 (61.7%) had a spouse, while 115 (38.3%) were without one. By chronic disease morbidity, the number of subjects with hypertension was 139 (46.3%), diabetes 44 (14.7%), hyperlipidemia 22 (7.3%), and osteoarthritis 53 (17.7%) (Table 2).
- Social Network and Health-related Quality of Life According to the Characteristics of the Study Subjects
- The characteristics of the social network differed significantly according to the age and existence of the spouse. The LSNS-R scores of those who were older and without a spouse were significantly lower. The HRQoL demonstrated a statistically significant difference according to age, employment status, existence of a spouse, and morbidity of diabetes. The EQ-5D index was significantly lower in those who were older, unemployed, without a spouse, and had diabetes (Table 2).
- Results of Regression Analysis of the Social Network and Health-related Quality of Life
- We conducted a hierarchical multiple regression analysis, with independent variables of socio-demographic characteristics, chronic disease morbidity, and social network and a dependent variable of HRQoL. In Model I, age and employment status among the socio-demographic characteristics were demonstrated to be statistically significant. With advanced age, the EQ-5D index was significantly lower, and the employed group showed a significantly higher EQ-5D index compared to the unemployed group. The explanatory power of Model I was 0.10. In Model II, we conducted another regression analysis, adding chronic disease morbidity to the socio-demographic variables. Among the chronic diseases, there were none that influenced HRQoL with statistical significance. In Model III, we conducted a regression analysis on Model II, to which the social network variable was added. With the social network variable a, higher EQ-5D index was related to a higher LSNS-R score, and these results were statistically significant. The explanatory power of Model III was 0.20, which was increased by 0.10 from that of the Model II (Table 3).
- To prevent problems that can be caused by heteroskedasticity of error terms and non-normal distribution, we conducted a regression analysis using a tobit model. The result of the tobit regression analysis showed that age and employment status were significant in Model I and morbidity of diabetes was significant in Model II. Finally, in Model III, with social network added, higher LSNS-R scores showed a higher EQ-5D index with statistical significance (BT =5.37) (Table 4).
- Social Network Components
- To identify social network components, we conducted a factor analysis on the 12 items of the LSNS-R. Through the factor analysis, three factors were determined. Six items (Questions 7 to 12) were classified as Factor 1, three items (Question 1, Question 3, and Question 4) as Factor 2, and three items (Question 2, Question 5, and Question 6) as Factor 3. The eigenvalue of Factor 1 was 6.54, that of Factor 2 was 2.05, and that of Factor 3 was 1.04. The explanatory power of the factor analysis was 0.80. The items of Factor 1 were all composed of friend-related questions (LSNS-R friend factor) of the LSNS-R, and Factor 2 consisted of the items asking the number of people and the size of the network (LSNS-R family size) among the family-related questions of the LSNS-R. Factor 3 was composed of questions asking about the frequency of contacts through the network (LSNS-R family frequency), among the family-related questions.
- Results of Regression Analysis on Social Network Components and Health-related Quality of Life
- We conducted a multiple regression analysis, with social network components as independent variables and HRQoL as a dependent variable. We conducted a multiple regression analysis on Model III-1, on the LSNS-R family size, among the social network components. Among the social network components, The LSNS-R family size had a significant influence on the HRQoL. The overall explanatory power of Model III-1 was 0.14, up by 0.04 after LSNS-R family size was added. For Model III-2, we conducted a multiple regression analysis on the LSNS-R family frequency, among the social network components. The LSNS-R family frequency had a statistically significant influence on the HRQoL among social network components. The explanatory power of Model III-2 was 0.15, up by 0.05 after LSNS-R family frequency was added. For Model III-3, we conducted a multiple regression analysis on the LSNS-R friends, among the social network components. Also among the components of social network, the LSNS-R friends had a statistically significant influence on the HRQoL. The explanatory power of Model III-3 was 0.20, up by 0.10 after LSNS-R friends was added (Table 5).
- To prevent problems that can be caused by heteroskedasticity of error terms and non-normal distribution, we also conducted a tobit regression analysis. The result of the analysis showed that, among the socio-demographic variables, age and employment status had a significant influence. The morbidity of diabetes demonstrated a tendency toward changing according to the analysis, but in general it had significant influence. The social network components had a significant influence in all of the models. The size of the regression coefficient was demonstrated to be in increasing order from LSNS-R friends (BT =5.41) to LSNS-R family frequency (BT =3.60) to LSNS-R family size (BT =2.96), representing the increase in the explanatory power of the multiple regression analysis (Table 6).
RESULTS
- The HRQoL of the elderly has been reported to be associated with general traits such as gender, existence of a spouse [23], education level, and age, as well as health behavior [24], ability to perform activities of daily life, subjective health perception and depression [25,26], and a number of chronic diseases [27]. In this paper, we focused on the social network as a factor that influences HRQoL besides the aforementioned factors. In order to analyze this, we measured social network, using measures of social network specialized for older adults and conducted a multiple regression analysis using the findings. The results of the multiple regression analysis and tobit regression analysis showed that the social network was an independent variable which influenced HRQoL with statistical significance.
- The result of the social network factor analysis demonstrated the pattern that the factors of social network of the older adults in Yeoncheon County were divided into friend network, the size of the family network, and the number of contacts with the family network. This is a characteristic of the social network of the elderly found in this study, which signifies that in the friend network, a bigger size means more contacts, while in family network, the size of the network and the number of contacts were separated as different factors. In the factor analysis conducted on 201 elderly living in California, USA. in 1993 by Lubben, developer of the LSNS-R, the social network of the elderly was divided into the size of the family network and friend network, and the number of contacts with the friend network [28]. In other words, in the USA, in the family network, the bigger the size of the network, the more frequent the number of contacts, and in the friend network, the size and the contact frequency were separated as different factors, unlike the findings of this study. However, it is difficult to conclude that such a difference necessarily arose from the difference between the countries because the subjects in this study were the elderly living in a county, while those in the USA study were the ones living in a state, California. Still, further research and analysis are necessary to explain the reason why the results of identical factor analyses conducted on a similar number of senior citizens residing in two different communities turned out to be different.
- The results of the multiple regression analysis and tobit regression analysis on the components of the social network and HRQoL demonstrated that the friend network had a relatively higher correlation with HRQoL. When taking this into account along with the result of the factor analysis, it can be concluded that in the friend network of the elderly in Yeoncheon County, Korea, the larger the size of the network, the more frequent the contacts are, and the network has higher correlation with HRQoL than the family network does. This is one of the most critical research findings that this study uncovered, in relation to the association between social network and HRQoL. Based on this finding, effective intervention methods that strengthen the social networks of the elderly can be suggested in order to raise their HRQoL. These include providing a phone counseling program where the elderly can frankly talk periodically in an effort to strengthen the friend network among various social networks, and organizing gatherings to enable the older adults to meet each other in person. Such methods of artificially increasing the size of the friend network and number of contacts are likely to exert more influence on HRQoL than strengthening their family network. Nonetheless, being a cross-sectional study, this study had the limitation of not explaining specific mechanisms as to how social network influences HRQoL. Further research and analysis about the social network and how it affects HRQoL are necessary in order to provide concrete policy alternatives and make them effective in the future.
- Examination of the relationship between the socio-demographic characteristics and HRQoL revealed that age and employment status had a significant influence on HRQoL. This is consistent with the findings of previous studies. The KNHANES in 2008 demonstrated that the EQ-5D index decreased with advanced age, lower income level, and living in a rural area (specifically, living in a town [eup] and township [myeon] rural government administrative district rather than a typically more urban neighborhood [dong] district). By comparison, this study, which involved residents of Yeoncheon County, did not show differences in the HRQoL according to their income level. This is thought to be due to the fact that the income level of the elderly population living in counties is generally low. In 2008, the minimum monthly cost of living in Korea was approximately 460 000 Korean won (1000 Korean won is approximately 1.00 US dollar) for a single family household and 780 000 Korean won for a two-person household. Comparatively, in this study, about 44% of the geriatric population had a household income level of 500 000 Korean won or less. As this study reflected household income in the analysis because the survey questionnaire did not inquire about personal income, the per capita income could have been inflated and the overall income level of the study subjects is possibly even lower. Regarding the relationship between chronic disease morbidity and HRQoL, the group with chronic disease showed a lower EQ-5D index. The 2008 KNHANES obtained the EQ-5D index using the same weights and also demonstrated that a group with chronic diseases such as hypertension, diabetes, hypercholesterolemia, and osteoarthritis had a lower EQ-5D index. However, in this study, only the morbidity of diabetes showed a statistically significant difference according to the EQ-5D index score and the pattern was the same in the regression analysis result. Such findings are rather different from previous study findings that demonstrated significant differences in subjects with hypertension, osteoarthritis, and hyperlipidemia [29]. This is considered to be due to the characteristics of the community health survey, which is based on the interview. Such interviews could possibly yield lower morbidity rates of chronic disease compared to the findings of studies based on actual measurements. In fact, in the KNHANES, conducted in 2008, the hypertension prevalence rate in the adults aged 65 or older was 55.7%, the diabetes prevalence rate was 19.7%, the cholesterol prevalence rate was 16.9%, and the osteoarthritis prevalence rate was 29.5%, which were generally higher than the findings of the present study.
- In this study, we used both multiple regression analysis and tobit analysis to analyze the influence of the variables on the HRQoL. In the previous studies of HRQoL, regression analysis has been used in various ways due to the characteristics of the EQ-5D index. While usually a multiple regression analysis [30-32] or logistic regression analysis [33] has been used, tobit analysis or Powell's censored least absolute deviation model has been being utilized recently [34-37] in cases where majority of the respondents of the EQ-5D questionnaire have responses of "1". In this study, 51.3% answered 'no problem' to the items of the EQ-5D, and in order to prevent heteroskedasticity of error terms and problems caused by non-normal distribution, we also conducted a tobit regression analysis and compared its result to that of the multiple regression analysis.
- Nonetheless, being a cross-sectional study, this study has the limitation of being unable to examine the actual influence of the social network and its specific mechanism. Further research, such as cohort studies, is necessary in order to examine this matter. Another limitation of the study is that it was conducted on the elderly population in one county, and thus was unable to represent the population of the whole geographical region. With regard to a limitation of the explanatory power of the models, the variance inflation factor values among variables were less than 3. Although multicollinearity was excluded, the explanatory power of the model with the highest power was 0.20, revealing the limitation that other factors which could explain HRQoL were not examined. Finally, there was a limitation of the study instrument. Because there was no survey form of the LSNS-R officially translated into Korean at the time of this research, the original English version was translated by the researchers and was examined for its construct validity and internal reliability.
- Nevertheless, even with such limitations, this study is significant in that it conducted analysis using a social network measure specialized for the elderly, and that the subjects were the elderly living in a community randomly selected though a national survey with public confidence. This study demonstrated that the social network and HRQoL were relatively closely associated factors for the elderly living in a community in Korea. Moreover, among different social networks, the friend network was shown to be the main factor that influences the HRQoL of the older adults who participated.
DISCUSSION
- 1. Statistics Korea. Future population estimation 2010-2060. 2011. cited 2012 Nov 1. Available from: http://www2.korea.kr/expdoc/viewDocument.req?id=30319(Korean)
- 2. Ware JE Jr. Standards for validating health measures: definition and content. J Chronic Dis 1987;40(6):473-480. 3298292ArticlePubMed
- 3. Zack MM, Moriarty DG, Stroup DF, Ford ES, Mokdad AH. Worsening trends in adult health-related quality of life and self-rated health-United States, 1993-2001. Public Health Rep 2004;119(5):493-505. 15313113ArticlePubMedPMC
- 4. Burstrom B, Fredlund P. Self rated health: Is it as good a predictor of subsequent mortality among adults in lower as well as in higher social classes? J Epidemiol Community Health 2001;55(11):836-840. 11604441ArticlePubMedPMC
- 5. Burstrom K, Johannesson M, Diderichsen F. Swedish population health-related quality of life results using the EQ-5D. Qual Life Res 2001;10(7):621-635. 11822795ArticlePubMed
- 6. Korea Centers for Disease Control and Prevention. 2010 Korea national health and nutrition examination statistics. 2011. Seoul: Ministry of Health & Welfare; p. 563 (Korean)
- 7. Mitchell JC. In: Mitchell JC, editor. The concept and use of social networks. Social networks in urban situations: analyses of personal relationships in Central African town. 1969. New York: Manchester University Press; p. 1-50
- 8. Berkman LF, Thomas G. In: Berkman LF, Kawachi I, editors. Shin YJ, translator. Social integration, social network, social support and health. Social epidemiology. 2003. Seoul: Hanwool; p. 183-226 (Korean)
- 9. Scott J. In: Scott J, editor. Networks and relations. Social network aanlysis: a handbook. 2000. London: SAGE Publications; p. 1-6
- 10. Fisher CS. To dwell among friends: personal networks in town and city. 1982. Chicago: University of Chicago Press; p. 79-124
- 11. House JS, Landis KR, Umberson D. Social relationships and health. Science 1988;241(4865):540-545. 3399889ArticlePubMed
- 12. Berkman LF. The role of social relations in health promotion. Psychosom Med 1995;57(3):245-254. 7652125ArticlePubMed
- 13. Cohen S, Doyle WJ, Skoner DP, Rabin BS, Gwaltney JM Jr. Social ties and susceptibility to the common cold. JAMA 1997;277(24):1940-1944. 9200634ArticlePubMed
- 14. Broadhead WE, Kaplan BH, James SA, Wagner EH, Schoenbach VJ, Grimson R, et al. The epidemiologic evidence for a relationship between social support and health. Am J Epidemiol 1983;117(5):521-537. 6342368ArticlePubMed
- 15. Michael YL, Berkman LF, Colditz GA, Holmes MD, Kawachi I. Social networks and health-related quality of life in breast cancer survivors: a prospective study. J Psychosom Res 2002;52(5):285-293. 12023125ArticlePubMed
- 16. Centers for Disease Control and Prevention. Social support and health-related quality of life among older adults: Missouri, 2000. MMWR Morb Mortal Wkly Rep 2005;54(17):433-437. 15889012PubMed
- 17. Henoch I, Bergman B, Gustafsson M, Gaston-Johansson F, Danielson E. The impact of symptoms, coping capacity, and social support on quality of life experience over time in patients with lung cancer. J Pain Symptom Manage 2007;34(4):370-379. 17616335ArticlePubMed
- 18. Jo H, Kim B, Lee H, Lee B. Perceived social support as influencing factors on quality of life among cancer patients. J Korean Soc Health Educ Promot 2010;27(4):51-59
- 19. Lubben JE. Assessing social networks among elderly populations. J Health Promot Maint 1988;11(3):42-52Article
- 20. The EuroQol Group. EuroQol: a new facility for the measurement of health-related quality of life. Health Policy 1990;16(3):199-208. 10109801ArticlePubMed
- 21. Korea Centers for Disease Control and Prevention. EQ-5D Korean valuation study using time trade off method. 2011. Cheongwon: Korea Centers for Disease Control and Prevention; p. 563 (Korean)
- 22. Lee YK, Nam HS, Chuang LH, Kim KY, Yang HK, Kwon IS, et al. South Korean time trade-off values for EQ-5D health states: modeling with observed values for 101 health states. Value Health 2009;12(8):1187-1193. 19659703ArticlePubMed
- 23. Park YR, Kwon HJ, Kim KH, Choi MH, Han SE. A study on relations between self-esteem, self efficacy and quality of life of the elderly. J Welf Aged 2005;29(1):237-258. (Korean)
- 24. Kim HR, Oh K, Oh KO, Lee SO, Lee SJ, Kim JA, et al. Quality of life in low income Korean aged. J Korean Acad Nurs 2008;38(5):694-703. (Korean). 19114758ArticlePubMed
- 25. Lim ES, Lee KJ. Effect of physical ability, depression and social support on quality of life in low income elders living at home. J Korean Gerontol Nurs 2003;5(1):38-49. (Korean)
- 26. Moon MJ. A study on the instrumental activities of daily living and quality of life of elderly home residents. Korean J Rehabil Nurs 2001;4(1):46-57. (Korean)
- 27. Lee EJ, Han CW. The relationship between the health-related quality of life and home care service needs in the elderly. J Welf Aged 2005;30(1):171-190. (Korean)
- 28. Lubben JE, Melanie Gl. In: Phillipson C, Allan G, Morgan D, editors. Measuring social networks and assessing their benefit. Social networks and social exclusion: sociological and policy perspectives. 2004. Burlington: Ashgate Publishing; p. 20-34
- 29. Han MA, Ryu SY, Park J, Kang MG, Park JK, Kim KS. Health-related quality of life assessment by the EuroQol-5D in some rural adults. J Prev Med Public Health 2008;41(3):173-180. (Korean). 18515994ArticlePubMedPDF
- 30. Korea Centers for Disese Control and Prevention. In-depth analyses of the third National Health and Nurition Examination Survey: the health interview and health behavior survey part. 2007. Cheongwon: Korea Centers for Disease Control and Prevention; p. 65-95 (Korean)
- 31. Bae SY, Ko DS, Noh JS, Lee BH, Park HS, Park J. Relation of physical activity and health-related quality of life in Korea elderly. J Korea Contents Assoc 2010;10(10):255-266. (Korean)Article
- 32. Kim MS. The association between health risk behaviors and health-related qulality of life by socioeconomic status [dissertation]. 2009. Seoul: Yonsei University; (Korean)
- 33. Ha HG. Quality of life in relations to the characteristics of the stroke: national health and nutrition examination [dissertation]. 2005. Seoul: Yonsei University; (Korean)
- 34. Clarke P, Gray A, Holman R. Estimating utility values for health states of type 2 diabetic patients using the EQ-5D (UKPDS 62). Med Decis Making 2002;22(4):340-349. 12150599ArticlePubMed
- 35. Choi CH. Regression model on health-related quality of life using EQ-5D: by the 4th 2nd year Korea national health and nutrition examination survey 2008 data [dissertation]. 2010. Seoul: Yonsei University; (Korean)
- 36. Sung SK. Study on relationships between depression and the quality of life (EQ-5D) [dissertation]. 2009. Seoul: Yonsei University; (Korean)
- 37. Park WS. The effect of community welfare resource on the quality of life for the poor [dissertation]. 2010. Seoul: Yonsei University; (Korean)
REFERENCES
Appendix
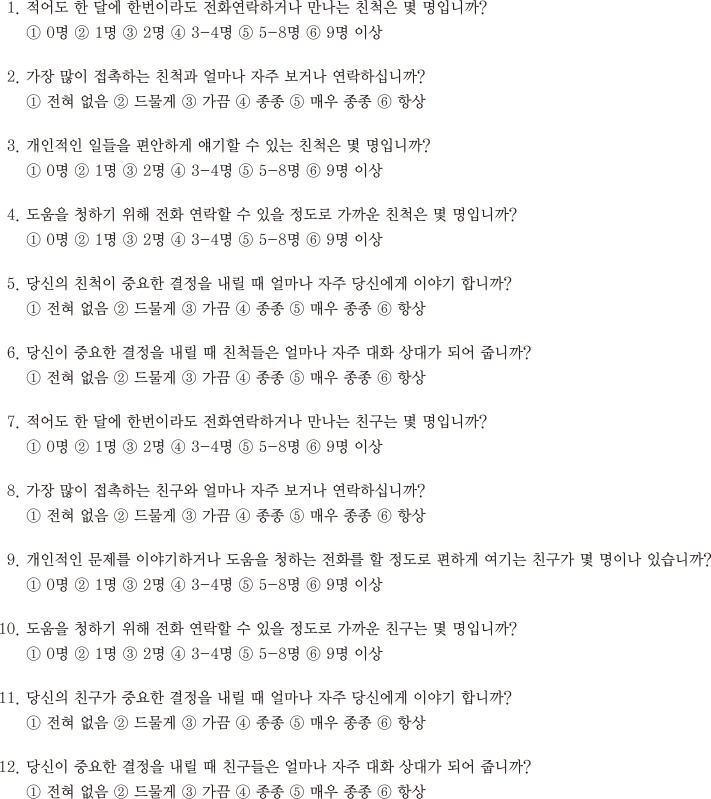
Table 1.Variables used in this study
Table 2.LSNS-R score and EQ-5D index according to demographic characteristics and prevalence of chronic disease
Table 3.Multiple regression analysis on the Euro quality of life-5 dimensions index
Table 4.Tobit regression analysis on Euro quality of life-5 dimensions index
Table 5.Multiple regression analysis on Euro quality of life-5 dimensions index by social network factors
Table 6.Tobit regression analysis on Euro quality of life-5 dimensions index by social network factors
Figure & Data
References
Citations
Citations to this article as recorded by 
- COVID-19: social isolation, social support, and depression among rural older adults
Jung Sim Jun, Kyoung Hag Lee, Joyce Baptist, Arely Yanez, April Zimmermann
Social Work in Mental Health.2024; 22(3): 356. CrossRef - Quality of Life and Multilevel Contact Network Structures Among Healthy Adults in Taiwan: Online Participatory Cohort Study
Tso-Jung Yen, Ta-Chien Chan, Yang-Chih Fu, Jing-Shiang Hwang
Journal of Medical Internet Research.2022; 24(1): e23762. CrossRef - The Effectiveness of Predicting Suicidal Ideation through Depressive Symptoms and Social Isolation Using Machine Learning Techniques
Sunhae Kim, Kounseok Lee
Journal of Personalized Medicine.2022; 12(4): 516. CrossRef - Validity and reliability of the Lubben Social Network Scale-Revised (LSNS-R) on older adults in Turkey
Nilgün Kuru Alici, Bilge Kalanlar
Current Psychology.2021; 40(1): 21. CrossRef - Information and Communication Technology Use, Social Support, and Life Satisfaction among Korean Immigrant Elders
Jung Sim Jun, Colleen Galambos, Kyoung Hag Lee
Journal of Social Service Research.2021; 47(4): 537. CrossRef - Structural Social Support and Changes in Depression During the Retirement Transition: “I Get by With a Little Help from My Friends”
Ben Lennox Kail, Dawn C Carr, Deborah Carr
The Journals of Gerontology: Series B.2020; 75(9): 2040. CrossRef - Association of Formal and Informal Social Support With Health-Related Quality of Life Among Chinese Rural Elders
Shan Lu, Yupan Wu, Zongfu Mao, Xiaohui Liang
International Journal of Environmental Research and Public Health.2020; 17(4): 1351. CrossRef - Health-related quality of life and associated factors in functionally independent older people
Mónica Machón, Isabel Larrañaga, Miren Dorronsoro, Kalliopi Vrotsou, Itziar Vergara
BMC Geriatrics.2017;[Epub] CrossRef - Social participation as an indicator of successful aging: an overview of concepts and their associations with health
Heather Douglas, Andrew Georgiou, Johanna Westbrook
Australian Health Review.2017; 41(4): 455. CrossRef - Factors Affecting the Health-Related Quality of Life of Community-Dwelling Elderly in Japan: A Focus on Spirituality
Minako Kobayashi, Eiji Marui
Health.2017; 09(07): 1095. CrossRef - Predictors of Long-Term Care Facility Residents’ Self-Reported Quality of Life With Individual and Facility Characteristics in Canada
Vahe Kehyayan, John P. Hirdes, Suzanne L. Tyas, Paul Stolee
Journal of Aging and Health.2016; 28(3): 503. CrossRef
 PubReader
 ePub Link
 Cite
Cite
