
Articles
- Page Path
- HOME > J Prev Med Public Health > Volume 46(6); 2013 > Article
-
Original Article
Social Network Characteristics and Body Mass Index in an Elderly Korean Population - Won Joon Lee1, Yoosik Youm2, Yumie Rhee3, Yeong-Ran Park4, Sang Hui Chu5, Hyeon Chang Kim1
-
Journal of Preventive Medicine and Public Health 2013;46(6):336-345.
DOI: https://doi.org/10.3961/jpmph.2013.46.6.336
Published online: November 28, 2013
1Department of Preventive Medicine, Yonsei University College of Medicine, Seoul, Korea.
2Department of Sociology, Yonsei University College of Social Sciences, Seoul, Korea.
3Department of Internal Medicine, Yonsei University College of Medicine, Seoul, Korea.
4Division of Silver Industry, Kangnam University, Yongin, Korea.
5Department of Clinical Nursing Science, Yonsei University College of Nursing, Seoul, Korea.
- Corresponding author: Yoosik Youm, PhD. 50 Yonsei-ro, Seodaemun-gu, Seoul 120-752, Korea. Tel: +82-2-2123-2431, Fax: +82-2-123-2420, yoosik@yonsei.ac.kr
Copyright © 2013 The Korean Society for Preventive Medicine
This is an Open Access article distributed under the terms of the Creative Commons Attribution Non-Commercial License (http://creativecommons.org/licenses/by-nc/3.0/) which permits unrestricted non-commercial use, distribution, and reproduction in any medium, provided the original work is properly cited.
ABSTRACT
-
Objectives
- Research has shown that obesity appears to spread through social ties. However, the association between other characteristics of social networks and obesity is unclear. This study aimed to identify the association between social network characteristics and body mass index (BMI, kg/m2) in an elderly Korean population.
-
Methods
- This cross-sectional study analyzed data from 657 Koreans (273 men, 384 women) aged 60 years or older who participated in the Korean Social Life, Health, and Aging Project. Network size is a count of the number of friends. Density of communication network is the number of connections in the social network reported as a fraction of the total links possible in the personal (ego-centric) network. Average frequency of communication (or meeting) measures how often network members communicate (or meet) each other. The association of each social network measure with BMI was investigated by multiple linear regression analysis.
-
Results
- After adjusting for potential confounders, the men with lower density (<0.71) and higher network size (4-6) had the higher BMI (β=1.089, p=0.037) compared to the men with higher density (>0.83) and lower size (1-2), but not in the women (p=0.393). The lowest tertile of communication frequency was associated with higher BMI in the women (β=0.885, p=0.049), but not in the men (p=0.140).
-
Conclusions
- Our study suggests that social network structure (network size and density) and activation (communication frequency and meeting frequency) are associated with obesity among the elderly. There may also be gender differences in this association.
- The study of the effects of social networks on health rose to the surface in the 1970s through pioneers such as Cassel, Cobb, and Berkman, who theorized or proved empirically that social networks could affect mortality [1-6]. After those mortality studies, several studies have reported that social networks are related to infectious diseases, such as sexually transmitted disease [7-9], tuberculosis [10], severe acute respiratory syndrome [11], and pneumonia [12]. Additionally, evidence suggests that emotions and related behaviors such as depression [13], suicide [14], and happiness [15] are also associated with social networks. Social networks affect health through several mechanisms, including the provision of social support (both perceived and actual), social influence (e.g., norms, social control), social engagement, person-to-person contact (e.g., pathogen exposure, secondhand cigarette smoke), and access to resources (e.g., money, jobs, information) [16].
- Obesity is a well-known risk factor for cardiovascular diseases [6]. Adipose tissue has been recognized as an active endocrine organ, capable of releasing many cytokines that play parts in the pathogenesis of many obesity-related diseases [17]. Social network assessment over 32 years in the Framingham Heart Study found that obesity tended to spread through intimate friends [18]. It found that an individual chances of being obese increased by 57% if she or he had a friend who also be obese. Additionally, the evidence for influence of friends on body weight comes from other studies examining the relationships between the weight of individuals and their friends [19-23]. These studies tested the relationship between the body mass index (BMI, kg/m2) of individuals and their friends in order to address the peer effect.
- It is known that obesity appears to spread through social ties. However, the association between other characteristics of social networks and obesity is unclear. Thus, we investigated whether social network characteristics such as network size, density of communication network, average frequency of communication, and average frequency of meeting were associated with BMI in an elderly Korean population.
INTRODUCTION
- The Korean Social Life, Health, and Aging Project (KSHAP) conducted a social network survey and health examination from November 2011 through July 2012 among 860 community-dwelling adults aged 60 or older and their spouses living in Yangsa-myeon, Ganghwa-gun, Incheon, Korea. The institutional review board of Yonsei University approved this study (YUIRB-2011-012-01) and informed consent was obtained from all of the participants. A total of 814 people responded to the social network survey (response rate 94.7%). Potentially confounding factors were assessed as well, including age, education, smoking status (never or ever smoker), alcohol drinking status (non-drinker or drinker), depression score (Center for Epidemiologic Studies-Depression Scale, CES-D), and self-reported comorbidity (hypertension, diabetes, stroke, and arthritis). Among them, 657 participants (80.7%) were examined for height and weight in a public health center or at home. BMI was calculated from measured weight and height.
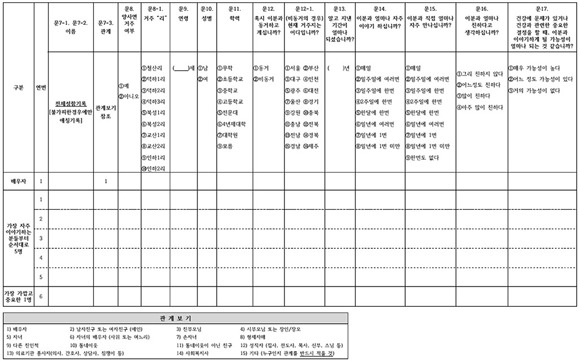
- In order to collect social network data, KSHAP adopted a model similar to that of the National Social Life, Health, and Aging Project (NSHAP) [24]. On 'Social network card I' (Appendix 1), a respondent (ego) was asked questions about three types of alters: their spouse (roster A), a maximum of five people with whom the respondents discussed things that were important to them (roster B), and someone to whom the respondents felt especially close (roster C). On 'Social network card II' (Appendix 2), the respondent answered questions about the relationships among alters listed on the rosters, and this information was used to build up egocentric network variables. The difference between egocentric data and common survey questions is that egocentric questionnaires collect data on the characteristics of the persons named, that is, on the respondent's personal network. The additional network information provides some insight into personal network characteristics and their potential influence on behavior [25].
- Social network characteristics are composed of network structure (network size, density, etc.) and network activation (frequency of nonvisual contact, frequency of face-to-face interaction, etc.) [16,26]. The following are the four social network measures we used.
- Network Size
- The egocentric network was composed of rosters A and B. Network size was simply a count of the number of alters provided in response to questions on 'Social network card I.'
- Density of Communication Network
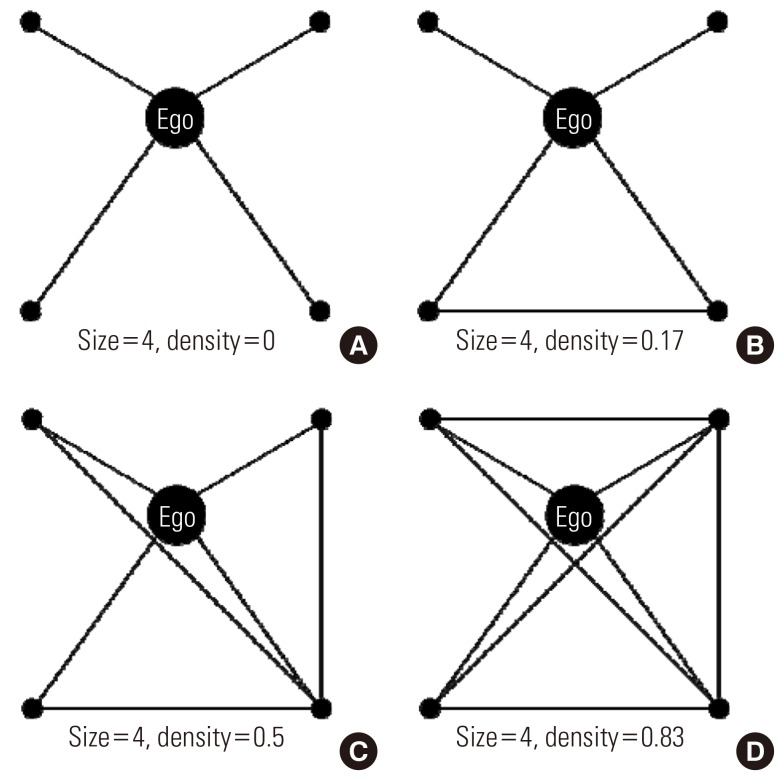
- KSHAP data can be used to construct a personal (ego-centric) network density variable that reflects the extent to which someone's closest contacts are connected to one another. Density of communication network (or density) is calculated as:
- Node nj and nk represent the adjoined nodes connected to node ni and 'e' represents the number of adjoined nodes connected to ni. If node nj and nk are connected, d(nj, nk) becomes 1 and if not, it becomes 0. After summing and dividing by every possible number of connections between adjoined nodes, this becomes the density of the communication network. Figure 1 shows examples of various personal network densities.
- Average Frequency of Communication and Meeting
- Respondents were asked to rate how often they talked to each network member on an 8-point scale, ranging from 'everyday' to 'less than once per year'. The scores were coded by assigning the approximate number of times per year egos interacted with alters (e.g., 'everyday'=365; 'once a month'=12) and the scores were summed across all alters on roster A and roster B to obtain a measure of the overall volume of contact with network members. Then, the scores were summed and divided by the network size. The average frequency of communication (or "communication frequency") indicates how often network members communicated. The average frequency of meeting (or "meeting frequency") was likewise calculated to determine how often network members met.
- Statistical Analysis
- All analyses were performed separately for the men and women. To gain information on the distribution of the continuous variables (age, depression score, BMI, network size, density of communication network, and average frequency of communication and meeting), we drew a histogram and calculated the minimum, lower quartile, median, upper quartile, maximum, and mean values. In order to solve the problem of non-normal distribution, we used two approaches before multiple linear regression analyses. One was the rank transformation approach and the other was the tertile method. The Spearman correlation test was used to examine the possibility of multicollinearity among social network measures. Network size and density were strongly and inversely correlated in the men (Spearman correlation coefficient (rs)=-0.98, p<0.001) and women (rs=-0.97, p<0.001). We created three groups of social network structure: 'higher density (>0.83) and lower size (1-2)', 'middle density (0.71-0.83) and size (3)', and 'lower density (<0.71) and higher size (4-6)' (Appendix 3). Before the regression analysis, unclassified individuals (3 men and 8 women) were removed. For univariate analysis, the trend test was used. For the continuous variables, p-values were calculated by using a contrast to test for a linear trend. For the categorical variables, the Cochran-Armitage test was used. Multiple linear regression analyses were performed to assess the linear relationship between each of the social network measures and BMI. In the matter of network activation, communication frequency was more significant than meeting frequency from the aforementioned analyses. Lastly, both the group of social network structure (density and size) and communication frequency were included in the multiple regression model. All statistical tests were performed with SAS version 9.2 (SAS Inc., Cary, NC, USA). All analyses were two-sided and p-values <0.05 were regarded as statistically significant.
METHODS

- The characteristics of the study population are summarized in Table 1. We assessed the linear trends between the social network measures and BMI (Appendices 4-6). The group of social network structure and communication frequency were significantly associated with BMI in both the men and women. However, meeting frequency was only significant in the women.
- Multiple linear regression analyses were performed to assess the relationship between each social network measure and BMI (Table 2). As regards network structure, rank-transformed network size and density were only associated with the men's BMI in model 3, while the group of network structure was significantly associated with BMI among all of the models in the men. The men with lower density and higher size had a higher BMI (β=1.253, p=0.014) than the men with higher density and lower size, while the men with middle density and size also had a higher BMI (β=1.022, p=0.044) compared with the reference group. We did not observe a significant association between network structure and BMI in the women. As regards network activation, communication frequency was significantly associated with the women's BMI among all of the models. The association between rank-transformed meeting frequency and the women's BMI was significant, but the tertile of meeting frequency was only associated in model 3. We did not observe such an association between network activation and BMI in the men.
- The group of social network structure and the communication frequency as an index of network activation were further analyzed for the association with BMI in the men and women (Table 3). After adjusting for age, education, smoking, alcohol drinking, depression score, comorbidity (hypertension, diabetes, stroke, and arthritis), and communication frequency, the men with lower density (<0.71) and higher size (4-6) had a higher BMI (β=1.089, p=0.037) than the men with higher density (>0.83) and lower size (1-2), but this was not the case in the women (β=0.391, p=0.393). In contrast, after adjusting for potential confounders and social network structure, the lower tertile of communication frequency was associated with a higher BMI in the women (β=0.885, p=0.049), but not in the men (β=0.702, p=0.140). In the women, less education was prominently related with a higher BMI among potential confounders.
RESULTS
- The present study examined the association between social network measures and BMI in an elderly Korean population. The men with a sparse and large communication network had a higher BMI compared with the men embedded in dense and small communication networks. The women in networks with a low frequency of communication had a higher BMI than the women in networks with a high frequency of communication.
- Social contacts can promote, discourage, and sanction attitudes and behaviors [27,28]. Social contacts may influence participation in organized sports [29], dieting [30], and food choices [31]. A study has linked unhealthy weight-control behaviors among adolescent girls to the dieting behaviors of their peers [32]. We found that the men's BMI was more strongly associated with network structure, that is, network size and density, than communication frequency as an index of network activation. KSHAP data from a restricted rural area had a simpler network structure than the NSHAP data because the NSHAP study population was a nationally representative sample [24]. Almost the entire KSHAP study population existed in three of the nine possible density and size groups. Therefore, it was difficult to discriminate statistically the effect of density from the association between social network structure and BMI, because network size and density were strongly correlated. We postulate a possible explanation for the association between network structure and the men's BMI. Dense personal networks provide reinforcement for prevailing norms and practices and can provide protection from outside sources of influence or risk [25]. The greater the density, the more likely a network is to be considered a cohesive community, a source of social support, and an effective transmitter [33]. By contrast, the women's BMI was more strongly associated with network activation such as communication frequency than network structure. In the women, education was prominently related with BMI among potential confounders, such that more advanced education correlated with lower BMI. The well-educated have a healthier lifestyle [34]. They are more likely to exercise, less likely to smoke, and more likely to drink moderately rather than abstain or drink heavily. It could be inferred that individual attributes such as education level may be most important in determining women's BMI. A previous study explained possible reasons for gender differences in factors associated with BMI [35]. Social contact among friends may be qualitatively different for the men and women in relation to how they affect health behavior. Although not statistically significant in interaction terms (social network measures by gender), β-coefficient estimates that are markedly different from each other suggest the possibility of true interaction between gender and social network characteristics [36].
- Previous studies have been mainly interested in the peer effect on obesity. There have been few reports about the association between other characteristics of social networks and obesity. Our findings were not definite, but might illuminate the novel association between social network structure or activation and BMI.
- This study has several limitations. First, because of the cross-sectional design, this study could not establish a temporal relationship between BMI and social network characteristics. Second, the survey data were open to measurement error. In particular, the reported relationships among alters might differ from actual relationships. It is important to determine not only the association between an ego's health behavior and an actual social network, but the perceived social network as well. Third, we assumed an inverse linear relationship between BMI and health. However, an increased risk of death has been observed to be associated with a low BMI in other studies [37,38]. Inadequate or incomplete control for confounding or reverse-causation bias could in part explain the increased risk [39]. A low BMI can be an indicator of certain other chronic medical conditions [40]. We adjusted for comorbidities, such as hypertension, diabetes, stroke, and arthritis, in order to overcome this unintended effect. This study population was dwelling in the community, not institutions, and they completely responded to the long survey (mean response time: 70 minutes). It can thus be concluded that they were not unhealthy enough to induce a reverse-causation bias. Fourth, the questionnaires did not measure diet and physical activity. These factors are determinants for obesity, and taking them into account may be necessary to identify the behavioral process (indirect effect) of social networks on BMI [26]. We could not distinguish behavioral processes from psychological processes in this study. Fifth, external validity could be limited because all of the subjects in the study population resided in a single rural community. Accordingly, further longitudinal studies in urban and rural areas are needed.
- Our study suggests that social network structure (network size and density) and activation (communication frequency and meeting frequency) are associated with obesity among the elderly. Lower density of communication network and higher network size may be associated with higher BMI in men, while lower frequency of communication may be associated with higher BMI in women.
DISCUSSION
ACKNOWLEDGEMENTS
- 1. Cassel J. The contribution of the social environment to host resistance: the Fourth Wade Hampton Frost Lecture. Am J Epidemiol 1976;104(2):107-123. 782233PubMed
- 2. Cobb S. Presidential Address-1976. Social support as a moderator of life stress. Psychosom Med 1976;38(5):300-314. 981490ArticlePubMed
- 3. Berkman LF, Syme SL. Social networks, host resistance, and mortality: a nine-year follow-up study of Alameda County residents. Am J Epidemiol 1979;109(2):186-204. 425958ArticlePubMed
- 4. Blazer DG. Social support and mortality in an elderly community population. Am J Epidemiol 1982;115(5):684-694. 7081200PubMed
- 5. House JS, Robbins C, Metzner HL. The association of social relationships and activities with mortality: prospective evidence from the Tecumseh Community Health Study. Am J Epidemiol 1982;116(1):123-140. 7102648ArticlePubMed
- 6. Haslam DW, James WP. Obesity. Lancet 2005;366(9492):1197-1209. 16198769ArticlePubMed
- 7. Helleringer S, Kohler HP. Sexual network structure and the spread of HIV in Africa: evidence from Likoma Island, Malawi. AIDS 2007;21(17):2323-2332. 18090281ArticlePubMed
- 8. Laumann EO, Youm Y. Racial/ethnic group differences in the prevalence of sexually transmitted diseases in the United States: a network explanation. Sex Transm Dis 1999;26(5):250-261. 10333277ArticlePubMed
- 9. Liljeros F, Edling CR, Amaral LA, Stanley HE, Aberg Y. The web of human sexual contacts. Nature 2001;411(6840):907-908. 11418846ArticlePubMed
- 10. Klovdahl AS, Graviss EA, Yaganehdoost A, Ross MW, Wanger A, Adams GJ, et al. Networks and tuberculosis: an undetected community outbreak involving public places. Soc Sci Med 2001;52(5):681-694. 11218173ArticlePubMed
- 11. Mettikolla P, Calander N, Luchowski R, Gryczynski I, Gryczynski Z, Zhao J, et al. Cross-bridge kinetics in myofibrils containing familial hypertrophic cardiomyopathy R58Q mutation in the regulatory light chain of myosin. J Theor Biol 2011;284(1):71-81. 21723297ArticlePubMedPMC
- 12. Ancel Meyers L, Newman ME, Martin M, Schrag S. Applying network theory to epidemics: control measures for Mycoplasma pneumoniae outbreaks. Emerg Infect Dis 2003;9: 204-210. 12603991ArticlePubMedPMC
- 13. Rosenquist JN, Fowler JH, Christakis NA. Social network determinants of depression. Mol Psychiatry 2011;16(3):273-281. 20231839ArticlePubMedPMC
- 14. Bearman PS, Moody J. Suicide and friendships among American adolescents. Am J Public Health 2004;94(1):89-95. 14713704ArticlePubMedPMC
- 15. Fowler JH, Christakis NA. Dynamic spread of happiness in a large social network: longitudinal analysis over 20 years in the Framingham Heart Study. BMJ 2008;337: a2338. 19056788ArticlePubMedPMC
- 16. Berkman LF, Kawachi I. Social epidemiology. New York: Oxford University Press; 2000. p. 145-149
- 17. Van Gaal LF, Mertens IL, De Block CE. Mechanisms linking obesity with cardiovascular disease. Nature 2006;444(7121):875-880. 17167476ArticlePubMed
- 18. Christakis NA, Fowler JH. The spread of obesity in a large social network over 32 years. N Engl J Med 2007;357(4):370-379. 17652652ArticlePubMed
- 19. Fowler JH, Christakis NA. Estimating peer effects on health in social networks: a response to Cohen-Cole and Fletcher; and Trogdon, Nonnemaker, and Pais. J Health Econ 2008;27(5):1400-1405. 18692263ArticlePubMedPMC
- 20. Halliday TJ, Kwak S. Weight gain in adolescents and their peers. Econ Hum Biol 2009;7(2):181-190. 19497795ArticlePubMed
- 21. Renna F, Grafova IB, Thakur N. The effect of friends on adolescent body weight. Econ Hum Biol 2008;6(3):377-387. 18672412ArticlePubMed
- 22. Trogdon JG, Nonnemaker J, Pais J. Peer effects in adolescent overweight. J Health Econ 2008;27(5):1388-1399. 18565605ArticlePubMed
- 23. Valente TW, Fujimoto K, Chou CP, Spruijt-Metz D. Adolescent affiliations and adiposity: a social network analysis of friendships and obesity. J Adolesc Health 2009;45(2):202-204. 19628148ArticlePubMedPMC
- 24. Cornwell B, Schumm LP, Laumann EO, Graber J. Social Networks in the NSHAP Study: rationale, measurement, and preliminary findings. J Gerontol B Psychol Sci Soc Sci 2009;64(Suppl 1):i47-i55. 19502574ArticlePubMed
- 25. Valente TW. Social networks and health: models, methods, and applications. New York: Oxford University Press; 2010. p. 44-45 p. 69-70
- 26. Uchino BN. Social support and health: a review of physiological processes potentially underlying links to disease outcomes. J Behav Med 2006;29(4):377-387. 16758315ArticlePubMed
- 27. Bahr DB, Browning RC, Wyatt HR, Hill JO. Exploiting social networks to mitigate the obesity epidemic. Obesity (Silver Spring) 2009;17(4):723-728. 19148124ArticlePubMed
- 28. Schlundt DG, Hill JO, Sbrocco T, Pope-Cordle J, Kasser T. Obesity: a biogenetic or biobehavioral problem. Int J Obes 1990;14(9):815-828. 2228413PubMed
- 29. Kohl HW 3rd, Hobbs KE. Development of physical activity behaviors among children and adolescents. Pediatrics 1998;101(3 Pt 2):549-554. 12224661ArticlePubMedPDF
- 30. Haines J, Neumark-Sztainer D. Prevention of obesity and eating disorders: a consideration of shared risk factors. Health Educ Res 2006;21(6):770-782. 16963727ArticlePubMed
- 31. Cullen KW, Klesges LM, Sherwood NE, Baranowski T, Beech B, Pratt C, et al. Measurement characteristics of diet-related psychosocial questionnaires among African-American parents and their 8- to 10-year-old daughters: results from the Girls' health Enrichment Multi-site Studies. Prev Med 2004;38: S34-S42. 15072857ArticlePubMed
- 32. Eisenberg ME, Neumark-Sztainer D, Story M, Perry C. The role of social norms and friends' influences on unhealthy weight-control behaviors among adolescent girls. Soc Sci Med 2005;60(6):1165-1173. 15626514ArticlePubMed
- 33. Kadushin C. Understanding social networks: theories, concepts, and findings. New York: Oxford University Press; 2012. p. 29-30
- 34. Ross CE, Wu CL. The links between education and health. Am Sociol Rev 1995;60(5):719-745Article
- 35. Oliveira AJ, Rostila M, de Leon AP, Lopes CS. The influence of social relationships on obesity: sex differences in a longitudinal study. Obesity (Silver Spring) 2013;21(8):1540-1547. 23818388ArticlePubMed
- 36. Szklo M, Nieto FJ. Epidemiology: beyond the basics. Sudbury: Jones and Bartlett Publishers; 2007. p. 211-212
- 37. Zheng W, McLerran DF, Rolland B, Zhang X, Inoue M, Matsuo K, et al. Association between body-mass index and risk of death in more than 1 million Asians. N Engl J Med 2011;364(8):719-729. 21345101ArticlePubMedPMC
- 38. Jee SH, Sull JW, Park J, Lee SY, Ohrr H, Guallar E, et al. Body-mass index and mortality in Korean men and women. N Engl J Med 2006;355(8):779-787. 16926276ArticlePubMed
- 39. Manson JE, Bassuk SS, Hu FB, Stampfer MJ, Colditz GA, Willett WC. Estimating the number of deaths due to obesity: can the divergent findings be reconciled? J Womens Health (Larchmt) 2007;16(2):168-176. 17388733ArticlePubMed
- 40. Lopez-Jimenez F. Speakable and unspeakable facts about BMI and mortality. Lancet 2009;373(9669):1055-1056. 19328986ArticlePubMed
REFERENCES
- Appendix 3
- Appendix 4
Variable Men (n=273)
Women (n=384)
Higher density and lower size (n=62) Middle density and size (n=104) Lower density and higher size (n=104) Unclassified (n=3) p for trend1 Higher density and lower size (n=139) Middle density and size (n=127) Lower density and higher size (n=110) Unclassified (n=8) p for trend1 Age (y) 73.8±8.6 72.7±7.0 72.3±6.1 71.3±7.5 0.21 74.5±8.4 70.7±8.1 69.6±6.9 69.6±9.3 <0.001 BMI (kg/m2) 22.6±3.4 23.8±3.5 23.9±2.9 24.1±2.1 0.01 23.9±3.4 24.1±3.5 24.9±3.4 24.5±2.3 0.03 Depression score (CES-D) 13.9±8.9 9.7±7.0 8.8±7.0 6.0±2.6 <0.001 13.7±8.8 11.1±7.3 10.6±7.2 7.5±5.5 0.002 Communication frequency 278.4±91.4 256.1±95.5 219.8±104.4 169.2±22.3 <0.001 284.1±102.4 250.9±103.3 214.4±98.7 190.6±52.7 <0.001 Meeting frequency 275.2±92.1 250.8±101.2 204.1±108.3 157.9±32.7 <0.001 276.0±112.5 240.2±110.2 191.4±108.0 185.0±54.3 <0.001 Education (y) 0.07 0.004 ≥7 19 (31) 42 (40) 47 (14) 3 (100) 13 (9) 20 (16) 25 (23) 4 (50) 0-6 43 (69) 62 (60) 57 (55) 0 (0) 126 (91) 107 (84) 85 (77) 4 (50) Smoker 42 (68) 70 (67) 76 (73) 2 (67) 0.41 3 (2) 4 (3) 1 (1) 0 (0) 0.54 Alcohol drinker 25 (40) 40 (38) 52 (50) 1 (33) 0.16 12 (9) 7 (6) 6 (5) 0 (0) 0.30 Comorbidity Hypertension 28 (45) 52 (50) 41 (39) 2 (67) 0.35 86 (62) 68 (54) 55 (50) 4 (50) 0.06 Diabetes 14 (23) 25 (24) 18 (17) 0 (0) 0.35 21 (15) 19 (15) 22 (20) 1 (13) 0.32 Stroke 5 (8) 6 (6) 3 (3) 0 (0) 0.14 11 (8) 3 (2) 2 (2) 0 (0) 0.01 Arthritis 12 (19) 28 (27) 26 (25) 0 (0) 0.49 70 (50) 67 (53) 54 (49) 4 (50) 0.87 - Appendix 5
- Appendix 6
Appendix

Network size and density of communication network
Participant characteristics according to social network structure
Participant characteristics according to average frequency of communication
Participant characteristics according to average frequency of meeting
| Variable |
Men (n=273) |
Women (n=384) |
||||||||||
|---|---|---|---|---|---|---|---|---|---|---|---|---|
|
Model 1 |
Model 2 |
Model 3 |
Model 1 |
Model 2 |
Model 3 |
|||||||
| β | p- value | β | p- value | β | p- value | β | p- value | β | p- value | β | p- value | |
| Social network structure | ||||||||||||
| Network size1 | 0.093 | 0.12 | 0.107 | 0.07 | 0.123 | 0.04 | 0.068 | 0.18 | 0.071 | 0.17 | 0.075 | 0.15 |
| Density of communication network1 | -0.085 | 0.15 | -0.100 | 0.09 | -0.116 | 0.05 | -0.068 | 0.18 | -0.071 | 0.17 | -0.076 | 0.14 |
| Higher density (>0.83) and lower size (1-2)2 | Reference | Reference | Reference | Reference | Reference | Reference | ||||||
| Middle density (0.71-0.83) and size (3)2 | 1.069 | 0.04 | 1.154 | 0.02 | 1.022 | 0.04 | -0.108 | 0.79 | -0.086 | 0.83 | -0.055 | 0.89 |
| Lower density (<0.71) and higher size (4-6)2 | 1.061 | 0.04 | 1.177 | 0.02 | 1.253 | 0.01 | 0.568 | 0.19 | 0.573 | 0.19 | 0.611 | 0.17 |
| Social network activation | ||||||||||||
| Communication frequency1 | -0.093 | 0.12 | -0.088 | 0.13 | -0.085 | 0.14 | -0.124 | 0.01 | -0.126 | 0.01 | -0.136 | 0.007 |
| Upper (365) | Reference | Reference | Reference | Reference | Reference | Reference | ||||||
| Middle (208-364) | 0.621 | 0.20 | 0.708 | 0.13 | 0.471 | 0.31 | 0.148 | 0.72 | 0.097 | 0.81 | 0.112 | 0.78 |
| Lower (<208) | 0.890 | 0.06 | 0.933 | 0.05 | 0.887 | 0.06 | 0.896 | 0.03 | 0.917 | 0.03 | 1.004 | 0.02 |
| Meeting frequency1 | -0.065 | 0.28 | -0.062 | 0.29 | -0.064 | 0.27 | -0.118 | 0.02 | -0.121 | 0.02 | -0.134 | 0.009 |
| Upper (365) | Reference | Reference | Reference | Reference | Reference | Reference | ||||||
| Middle (186-364) | 0.160 | 0.74 | 0.307 | 0.51 | 0.110 | 0.81 | 0.194 | 0.63 | 0.166 | 0.68 | 0.188 | 0.64 |
| Lower (<186) | 0.638 | 0.20 | 0.673 | 0.16 | 0.665 | 0.16 | 0.792 | 0.07 | 0.805 | 0.07 | 0.915 | 0.04 |
Model 1 adjusted for age and education; Model 2 added smoking, alcohol drinking, and depression score; and Model 3 added hypertension, diabetes, stroke, and arthritis.
1 The rank transformation approach was used. β means the standardized β-coefficient.
2 Before the analysis, unclassified individuals (3 men and 8 women) were removed.
Figure & Data
References
Citations
- A Prospective Sociocentric Study of 2 Entire Traditional Korean Villages: The Korean Social Life, Health, and Aging Project (KSHAP)
Jiwon Baek, Ekaterina Baldina, Kiho Sung, Sung-Ha Lee, Nicholas A Christakis, Peter Bearman, Hyeon Chang Kim, Sang Hui Chu, Eun Lee, Yeong-Ran Park, Jeanyung Chey, Youn-Hee Choi, Dohoon Lee, Yoosik Youm
American Journal of Epidemiology.2024; 193(2): 241. CrossRef - The Early-Life Origins of Later-Life Networks
Alyssa W Goldman
Social Problems.2022; 69(2): 562. CrossRef - 20-55 Yaş Arası Kadınların Beden Algılarının Değerlendirilmesi
Can ERGÜN, Bilge MERAL KOC, Selin KALEOĞLU
İstanbul Gelişim Üniversitesi Sağlık Bilimleri Dergisi.2022; (18): 892. CrossRef - Social connections and hypertension in women and men: a population-based cross-sectional study of the Canadian Longitudinal Study on Aging
Zeinab Hosseini, Gerry Veenstra, Nadia A. Khan, Annalijn I. Conklin
Journal of Hypertension.2021; 39(4): 651. CrossRef - Adiposity and the role of diverse social supports: an observational, gender-sensitive study using the baseline Canadian Longitudinal Study on Aging
Zeinab Hosseini, Abdollah Safari, Nadia A Khan, Gerry Veenstra, Annalijn I Conklin
Public Health Nutrition.2021; 24(18): 6103. CrossRef - Associations between social connections, their interactions, and obesity differ by gender: A population-based, cross-sectional analysis of the Canadian Longitudinal Study on Aging
Zeinab Hosseini, Gerry Veenstra, Nadia A. Khan, Annalijn I. Conklin, Liang Wang
PLOS ONE.2020; 15(7): e0235977. CrossRef - Personal network characteristics and body mass index: the role of education among Black Americans
Stephanie T Child, Katrina M Walsemann, Andrew T Kaczynski, Nancy L Fleischer, Alexander C McLain, Spencer Moore
Journal of Public Health.2019; 41(1): 130. CrossRef - Social support, social network and salt-reduction behaviours in children: a substudy of the School-EduSalt trial
Yuan Ma, Xiangxian Feng, Jun Ma, Feng J He, Haijun Wang, Jing Zhang, Wuxiang Xie, Tao Wu, Yunjian Yin, Jianhui Yuan, Graham A MacGregor, Yangfeng Wu
BMJ Open.2019; 9(6): e028126. CrossRef - Is the Relationship between Depression and C Reactive Protein Level Moderated by Social Support in Elderly?-Korean Social Life, Health, and Aging Project (KSHAP)
Nam Wook Hur, Hyeon Chang Kim, Linda Waite, Yoosik Youm
Psychiatry Investigation.2018; 15(1): 24. CrossRef - Applications of social network analysis to obesity: a systematic review
S. Zhang, K. de la Haye, M. Ji, R. An
Obesity Reviews.2018; 19(7): 976. CrossRef - Social Network Analysis and Resilience in University Students: An Approach from Cohesiveness
Cristina Liébana-Presa, Elena Andina-Díaz, María-Mercedes Reguera-García, Iván Fulgueiras-Carril, David Bermejo-Martínez, Elena Fernández-Martínez
International Journal of Environmental Research and Public Health.2018; 15(10): 2119. CrossRef - The association between obesity and social exclusion in middle-aged and older adults: findings from a nationally representative study in Germany
André Hajek, Hans-Helmut König
BMC Geriatrics.2018;[Epub] CrossRef - Factors Associated with Insomnia among the Elderly in a Korean Rural Community
Woo Jung Kim, Won-tak Joo, Jiwon Baek, Sung Yun Sohn, Kee Namkoong, Yoosik Youm, Hyeon Chang Kim, Yeong-Ran Park, Sang Hui Chu, Eun Lee
Psychiatry Investigation.2017; 14(4): 400. CrossRef - The Connection Prescription: Using the Power of Social Interactions and the Deep Desire for Connectedness to Empower Health and Wellness
Jessica Martino, Jennifer Pegg, Elizabeth Pegg Frates
American Journal of Lifestyle Medicine.2017; 11(6): 466. CrossRef - Obesity in older persons
J. Woo
Current Opinion in Clinical Nutrition and Metabolic Care.2015; 18(1): 5. CrossRef - O Programa Nacional de Controle do Tabagismo (PNCT) na perspectiva social: a análise de redes, capital e apoio social
Paulo Cesar Moreira Campos, Marcia Gomide
Cadernos Saúde Coletiva.2015; 23(4): 436. CrossRef - The Korean social life, health and aging project-health examination cohort
Ju-Mi Lee, Won Joon Lee, Hyeon Chang Kim, Wungrak Choi, Jina Lee, Kiho Sung, Sang Hui Chu, Yeong-Ran Park, Yoosik Youm
Epidemiology and Health.2014; 36: e2014003. CrossRef
 PubReader
 ePub Link
 Cite
Cite

