
Articles
- Page Path
- HOME > J Prev Med Public Health > Volume 47(1); 2014 > Article
-
Original Article
Factors Predicting the Physical Activity Behavior of Female Adolescents: A Test of the Health Promotion Model - Hashem Mohamadian1, Mohammad Ghannaee Arani2
-
Journal of Preventive Medicine and Public Health 2014;47(1):64-71.
DOI: https://doi.org/10.3961/jpmph.2014.47.1.64
Published online: January 29, 2014
1Research Centre for Health-Related Social Determinates, Department of Public Health, School of Health, Kashan University of Medical Sciences, Kashan, Iran.
2Trauma Research Centre, Kashan University of Medical Sciences, Kashan, Iran.
- Corresponding author: Mohammad Ghannaee Arani, MSc. Ghotb-e-Ravandi Blvd, Kashan, Iran. Tel: +98-913-3622326, Fax: +98-361-5551112, mohammadarani@yahoo.com
• Received: August 8, 2013 • Accepted: December 31, 2013
Copyright © 2014 The Korean Society for Preventive Medicine
This is an Open Access article distributed under the terms of the Creative Commons Attribution Non-Commercial License (http://creativecommons.org/licenses/by-nc/3.0/) which permits unrestricted non-commercial use, distribution, and reproduction in any medium, provided the original work is properly cited.
ABSTRACT
-
Objectives
- Physical activity behavior begins to decline during adolescence and continues to decrease throughout young adulthood. This study aims to explain factors that influence physical activity behavior in a sample of female adolescents using a health promotion model framework.
-
Methods
- This cross-sectional survey was used to explore physical activity behavior among a sample of female adolescents. Participants completed measures of physical activity, perceived self-efficacy, self-esteem, social support, perceived barriers, and perceived affect. Interactions among the variables were examined using path analysis within a covariance modeling framework.
-
Results
- The final model accounted for an R2 value of 0.52 for physical activity and offered a good model-data fit. The results indicated that physical activity was predicted by self-esteem (β=0.46, p<0.001), perceived self-efficacy (β=0.40, p<0.001), social support (β=0.24, p<0.001), perceived barriers (β=-0.19, p<0.001), and perceived affect (β=0.17, p<0.001).
-
Conclusions
- The findings of this study showed that the health promotion model was useful to predict physical activity behavior among the Iranian female adolescents. Information related to the predictors of physical activity behavior will help researchers plan more tailored culturally relevant health promotion interventions for this population.
- Insufficient physical activity (IPA) is one of the leading risk factors of mortality [1]. Physical activity (PA) behaviors and habits formed in childhood frequently carry over into adulthood and may help reduce death and illness from chronic disease [2]. People with IPA are 20 to 30% more at risk of mortality as compared to those who excercise at least for 30 minutes a week [3]. The prevalence of IPA was higher in girls than that in boys, especially in the developing countries [4]. Research evidence also indicates decreased PA levels in Iran and an alarmingly high prevalence of obesity among Iranian children [5]. Recent estimates suggest that only 25.6% of high school females participate in the recommended levels of PA [6]. Adolescence is a time when many future health behaviors begin and provides an opportunity for interventions encouraging positive health behaviors including participation in PA behaviors [7]. In order to plan and implement an intervention to increase PA in adolescents, we need to determine the factors that play a role in PA in this population. The understanding of PA in adolescents may not simply be derived from the existing knowledge related to the PA of adults.
- A number of behavioral change theories exist to examine the predictors and precursors of certain health behaviors [8]. Pender's health promotion model (HPM) was used in the present study. The theoretical basis of the HPM is the expectancy-value model and social cognitive theory. According to the HPM, individuals have unique variables that affect their actions [9]. The HPM can be ideally applied to all populations but it is particularly important in the adolescent population since adolescents are at a critical time in their life for making independent health care decisions. Despite many studies on the HPM in adults, Srof and Velsor-Friedrich [10] have noted a lack of research on applications of the HPM to the adolescent population. Therefore, the aim of this study was to employ a structural equation modeling approach to determine relationships among variables of HPM (perceived affect, social support, perceived barriers, self-esteem, and self-efficacy) for explaining PA behavior among Iranian female adolescents. According to the HPM, it was hypothesized that perceived affect, social support, perceived barriers, self-esteem, and self-efficacy would be significant predictors of participation in PA. A second hypothesis was that social support, perceived barriers, and self-esteem also have indirect effects on PA through self-efficacy (Figure 1).
INTRODUCTION
- Sample
- This study was a cross-sectional survey of female students from Kashan in the province of Isfahan, Iran. It was conducted between April 2010 and June 2010. A total of 500 female students were included from among urban dwelling high school students aged 15 to 17 years of age. The study used a stratified, two-stage sampling method to select participants for the study to meet the sample size requirement. The samples were selected among girls from public high schools in the city of Kashan. In the first stage of the sampling, the schools were selected randomly based on a probability proportional to the total number of all-girl public high schools. Twenty out of 43 schools were included in the study. At each all-girls public high school, three classes, one from each grade, were randomly selected (i.e., a total of 60 classes). In the second stage, 25 students from each school were drawn at random from the list of students in the senior high school classes including grades 9 to 12. The research protocol was approved by Tehran University of Medical Sciences Institutional Review Board. Written informed assent was obtained from all of the students as well as their parents. Of 500 eligible individuals, 5 individuals did not completely respond to the questionnaire; therefore, they were excluded from the data analysis. Rate of missing data was 1% in this study, resulting in a response rate of 99%. The demographic characteristics are shown in Table 1.
- Measures
- The tools were translated using the Banville method to develop a cultural adaptation [11]. Pilot testing was done on 30 female adolescents to evaluate item clarity and estimate the reliability. A multi-section self-administered questionnaire was developed for this population. The first section of the questionnaire consisted of items on demographic data, including variables such as age, body mass index (BMI) and parent education. The second part of the questionnaire consisted of cognitive-perceptual factors.
- The Multidimensional Scale of Perceived Social Support (MSPSS) was used to measure the perceived social support [12] which was defined as the individual's perceptions of social support received from three separate sources: family, friends, and a significant person. Although support from family and friends is common in social support literature, the inclusion of support from a significant person is a unique facet of the MSPSS. The MSPSS is a 12-item assessment tool utilizing a 7-point Likert-type scale. Scores on each subscale range from 4 to 28 in which higher scores indicate a higher level of perceived social support received from the respective subscale (i.e., family, friends and significant people). The internal consistency was 0.91 on the total scale and 0.90 to 0.95 for the subscales [12]. The internal consistency of the MSPSS in the present study was 0.73 for the total scale and 0.76, 0.70, and 0.74 for the subscales.
- The Perceived Health Competence Scale (PHCS) was applied to measure the perceived self-efficacy which was defined as the degree to which a person feels capable of reasonably managing his or her health outcomes. The PHCS is an 8-item questionnaire based on the 5-point Likert scale. The higher the level of perceived competence, the more competent the person feels able to practice more health promoting behaviors. There have been studies in which a PHCS was used that reported an internal consistency, using Cronbach's alpha, ranging from 0.82 to 0.90 [13]. In this study Cronbach's alpha was 0.80.
- The Barriers to Health Promoting Activities scale [14] is an 18-item instrument with 4-point Likert-type items that requests individuals to show how often the listed barriers keep them from accepting responsibility for their health. The higher the score an individual receives on this rating scale, the larger are the perceived barriers [15]. The internal consistency reliability has been reported to be above 0.80 and the test/retest reliability was 0.75 [16]. In this study Cronbach's alpha was 0.79.
- The positive and negative affect schedules (PANAS) were used to measure the perceived affect which was defined by the individual emotional states in general, at this moment, over a 24-h period and various time frames. The PANAS is a 20-item questionnaire that uses a 5-point Likert-type scale. Higher scores reflect a greater positive or negative affect. Cronbach's alpha was 0.84 and 0.87 for the positive and negative affect indexes, respectively [17]. In this study, the reliability of the positive and negative affect indices was 0.72 and 0.71, respectively.
- Rosenberg's Self-esteem Scale (RSE) was developed to assess an individual's feeling of self-deprecation and self-worth. This scale consists of 10 items based on 4-point Likert scale. A high score indicates high self-esteem. Rosenberg reported good reproducibility coefficients of 0.85 to 0.92. The test/retest reliability coefficient for a two-week interval was 0.85 [18]. In this study, the reliability of the RSE was 0.83.
- The third part of our questionnaire was the Physical Activity for Adolescents (PAQ-A) tool is to assess general levels of PA. The PAQ-A (a slightly modified version of the PAQ-C with the "recess" item removed) is a self-administered, 7-day recall tool that assesses general levels of PA for high school students in grades 9 to 12 [19]. Kowalski et al. [20] reported that the PAQ-A was useful for large population studies involving children with differing levels of PA. The PAQ-A also seeks information regarding PA during spare time, physical education, game time, and lunchtime, after school, in the evenings, and on weekends [19]. For example, "In the last 7 days, what did you do most of the time during recess?" Previous studies have identified the convergent validity of the PAQ-A as a measure of the general PA level for high school students [21]. The PAQ-A appeared to be internally consistent in children who are 9 to 15 years of age with Cronbach's alpha of 0.79 to 0.89 reported [22]. The PAQ-A can be applied in a classroom setting and provides a summary PA score derived from eight items, each scored on a 5-point scale. The mean of all the items is used to indicate the level of PA. A high score indicates higher levels of PA. Further, in this study, the total test/retest reliability of the PAQ-A was 0.73.
- Statistical Analysis
- Descriptive statistics including Pearson's correlation coefficients, the mean scores, and standard deviations for all the constructs were calculated and used to analyze the linear relationships among the study variables shown in Table 2. The data were analyzed using LISREL 8.8 (SSI Inc., Skokie, IL, USA) and SPSS version 18 (SPSS Inc., Chicago, IL, USA). Path analysis using maximum likelihood estimation was conducted [23]. Prior to the analysis, the regression assumptions including the relationship between independent and dependent variables and multicollinearity were examined. The results indicated no evidence of multicollinearity because all tolerance values were more than 0.19 ranging from 0.72 to 0.94. Further, the variance inflation factor was less than 5.3 ranging from 1.06 to 1.37 [24,25].
- An initial examination was performed on the hypothesized model depicted in Figure 1. The model fits the index criteria such as the goodness of fit index (GFI), adjusted goodness of fit index (AGFI), chi-squared (χ2), degree of freedom (DF) and root mean square error of approximation (RMSEA) [26]. Figure 2 shows the final structural model with the suggested causal paths highlighted in bold.
METHODS
- Demographic Characteristics of the Sample
- The majority of the participants were 16 (33.3%) or 15 (28.3%) years old. The average age was 15.61 years (SD, 1.05). The majority of the parents had up to a primary education (fifth grade, 62.4%). In terms of BMI, the majority of the subjects were normal (61%) (Table 1).
- Correlations for scores of the variables of HPM are presented in Table 2. PA was positively related with the variables of HPM except for perceived barriers. Among all the variables, self-efficacy emerged as the variable that most highly correlated with PA.
- Overall Goodness-of-fit of the Hypothesized and the Final Structural Models
- The hypothesized model revealed that the overall χ2 value was 222.14. None of the indices conformed to the required minimum for accepting a model showing a weak model fit. The final model revealed an overall χ2 value of 7.69. Figure 2 shows that the goodness-of-fit of the initial model significantly improved with the four significant paths added which are highlighted in bold. These results indicate that this model fits the data well. The final model accounted for 52% of the variance of PA (Figure 2). The standardized coefficients for the paths from self-esteem, perceived self-efficacy, perceived affect, social support, and perceived barriers to PA were 0.31, 0.34, 0.17, 0.20, and -0.16, respectively. Table 3 provides a list of direct, indirect, and total relationship variables of the HPM on PA. Among these factors, however, it was self-esteem that had a substantial association with both PA and perceived self-efficacy. The total association of the predictors of PA indicated that the Iranian female adolescents with a higher self-esteem, a greater self-efficacy, lower perceived barriers, more positive affect, andhigher social support were predisposed to higher PA.
RESULTS
- The HPM was chosen because it integrates biological, psychological, social, and environmental aspects of human behaviors which can be used to explain the PA of youth [27]. Since HPM unlike Health Belief Model does not focus on the potential threat of disease as a source of motivation, it can be used in many more situations during lifespan [28]. Model of HPM does not limit itself to a specific type of health behavior. However, it helps the patient and the nurse work together towards achieving a better quality of life. One of the main weaknesses in the theory is that the model may not be completely accurate in practice for communities and families as a whole since the individual is focused there [29]. Personal factors are broken down into biological, psychological, and sociocultural factors in the model making it clear which personal factors are being considered. It seems that Pender is breaking down the overall "environment" into what she defines as interpersonal influences (family, peers, and providers) and situational influences. Although Pender believes that the healthcare provider can influence an individual's behaviors towards health promotion, it is unclear at which point(s) in the model the provider should intervene. Other theoretical models describing health promotion include the transtheoretical model (TTM) and the theory of reasoned action (TRA). However, the TTM focuses mostly on the process of change and less on the factors that influence it. The TRA focuses more on behavioral intent and the respondent's attitudes towards performing a certain behavior [30]. Although similarities to these other models exist, in general,the HPM is unique in that it distinguishes itself from other models by not counting threats or avoidance as a motivator for health promotion [29]. The final model provided a good fit to the data, and all the variables accounted for 52% of the variance in PA. This result is consistent with the findings of previous studies [13,31]. Overall, the findings lend support to the capacity of the HPM as an explanatory model in this population. The findings of the current study indicated that self-esteem played a significant role in the PA level of all the variables in the target population. The path analysis revealed that self-esteem contributed to 46% of the variability in the PA level among the Iranian female adolescents. This was the most important predictor of PA. Prior studies have revealed the influence of self-esteem on PA behavior [32]. On the basis of this finding, the individuals may enhance their PA by having a positive image of their bodies and their physical skills and abilities. Parents, teachers, and physically active elite can positively influence self-esteem and provide girls with an ongoing incentive to participate and personally succeed in PA endeavors. Here are some steps to improving self-esteem: 1) identify the issue, 2) manage the thoughts, 3) view mistakes as learning opportunities, 4) try new things, 5) recogniz what you can change and what you cannot, and 6) set goals. Perceived self-efficacy was found to be the largest direct contributor to predicting PA behavior in the target population. The results of the current study indicated that higher belief in self-efficacy is likely to influence students' participation in PA. These findings were consistent with those of the prior studies. Self-efficacy, based on Bandura's social cognitive theory has wide appeal and usefulness in the health and social sciences [33] and has been added to other health-behavior theories including the HPM. Since self-efficacy is as an important factor in determining the PA level, healthcare practitioners focusing on increasing PA should include ways and strategies for promoting it. Therefore, if an individual feels that she has the capacity and resources to participate in the given behavior in the face of salient external constraints, then she is more likely to participate in the behavior. Perceived barriers had an indirect and direct negative relationship with the PA. Female adolescents who perceive fewer PA barriers are typically more active than those who perceive more barriers. One of the main causes of being physically inactive is that girls and children from minority ethnic communities are more restricted in using the public places. Another concern is absence of equipment that may cause physical challenges for children particularly in the case of girls. Review of literatures revealed that the perceived barriers are important determinants of health promoting behavior in 79% of the studies using the HPM [28]. It is important to understand the reasons why some people choose to be active and others do not, so that creating strategies to overcome them can be better targeted to support and encourage PA as part of the daily routine. Many technological advances and conveniences have made our lives easier and less active [34]. In addition, the environment in which we live has a great influence on our level of PA. Factors such as the accessibility of walking paths, cycling trails, recreation facilities, traffic, the availability of public transportation, insecurity, and air pollution may affect our plans to become more physically active. We can make changes in our environment by resorting to those institutes supporting public sport activities. The results showed that there was a significant positive relationship between social support and PA in the target population. Consistent with other studies, social support was an important predictor of PA behavior [35]. In 57% of the studies testing the HPM, there was evidence that interpersonal influences were determinants of health promoting behavior [28]. This finding indicates that significant others play an influential role in determining adolescent girls' level of PA. Due to the changing nature of children's family and social contexts, researchers should continue to use the significant others in providing support to youth of different ages [36]. The effect of emotions on physical health has been a central topic in health psychology. The PANAS is a new construct developed in this study. The present study found that PANAS and PA were related. However, the amount of variance explained was relatively small. The results suggest that improving female adolescents' perceived affect might increase their participation in PA behavior. These results are consistent with other studies [37]. PANAS may influence PA by changing social relations. Persons with more positive affect socialize more often and maintain more and higher-quality social ties. Further, PA may result in more and closer social contacts because it facilitates approach behavior and because others are drawn to form attachments with pleasant individuals. Finally, healthcare providers may be more attentive to persons with a more pleasant affect in order to promote PA in the target population.
- Since the data were self-reported, the possibility of reporting some variables inaccurately could not be totally overlooked. Likewise, as a consequence of the cross-sectional nature of the workplace, it is difficult to determine the causality between and among the relationships. Another limitation of this survey was the regional differences.
- Findings from this study provide partial support the HPM in explaining PA behavior in a sample of Iranian female adolescents. These results can apply to the development of better tailoring of interventions for increasing the PA level amongIranian adolescents. More research is needed to examine how constructs from different theoretical models might be related to one another and serve complementary roles in changing PA behavior. Parents, school officials, and community leaders should consider the design of new programs based on the current study findings so that they can help adolescents to be physically active inside and outside of the school setting. Policymakers need to prioritize PA as a critical component in educational policy and set up strategies and structures based on the study findings that support this. Local authorities and policy makers should strengthen professional training programs that better enable providers, and school nurses and counselors to distinguish and address sensitive issues like low self-efficacy, more barriers, low social support, more negative affect, and low self-esteem.
DISCUSSION
ACKNOWLEDGEMENTS
- 1. Mathers C, Stevens G, Mascarenhas M. Global health risks: mortality and burden of disease attributable to selected major risks. Geneva: World Health Organization; 2009. p. 11-18
- 2. Gallahue DL, Cleland-Donnelly F. Developmental physical education for all children. 4th ed. Champaign: Human Kinetics; 2007. p. 78-100
- 3. World Health Organization. Global recommendations on physical activity for health. Geneva: World Health Organization; 2009. p. 8-10
- 4. De Moraes AC, Guerra PH, Menezes PR. The worldwide prevalence of insufficient physical activity in adolescents; a systematic review. Nutr Hosp 2013;28(3):575-584. 23848074PubMed
- 5. Mohammadpour-Ahranjani B. The epidemiology and prevention of childhood obesity in Tehran, Iran [dissertation]. Birmingham: University of Birmingham; 2011
- 6. Eaton DK, Kann L, Kinchen S, Shanklin S, Ross J, Hawkins J, et al. Youth risk behavior surveillance--United States, 2007. MMWR Surveill Summ 2008;57(4):1-131. 18528314
- 7. Biddle SJ, Gorely T, Stensel DJ. Health-enhancing physical activity and sedentary behaviour in children and adolescents. J Sports Sci 2004;22(8):679-701. 15370482ArticlePubMed
- 8. Raingruber B. Contemporary health promotion in nursing practice. Burlington: Jones & Bartlett Learning; 2012. p. 53-90
- 9. Dembeck K. Physical activity and self-esteem in females during late adolescence [dissertation]. Jacksonville: University of North Florida; 2011
- 10. Srof BJ, Velsor-Friedrich B. Health promotion in adolescents: a review of Pender's health promotion model. Nurs Sci Q 2006;19(4):366-373. 16982726ArticlePubMed
- 11. Banville D, Desrosiers P, Genet-Volet Y. Translating questionnaires and inventories using a cross-cultural translation technique. J Teach Phys Educ 2000;19(3):374-387Article
- 12. Zimet GD, Dahlem NW, Zimet SG, Farley GK. The multidimensional scale of perceived social support. J Pers Assess 1988;52(1):30-41Article
- 13. Canty-Mitchell J, Zimet GD. Psychometric properties of the Multidimensional Scale of Perceived Social Support in urban adolescents. Am J Community Psychol 2000;28(3):391-400. 10945123ArticlePubMed
- 14. Stuifbergen AK, Seraphine A, Harrison T, Adachi E. An explanatory model of health promotion and quality of life for persons with post-polio syndrome. Soc Sci Med 2005;60(2):383-393. 15522493ArticlePubMed
- 15. Bass LA. Health-promoting lifestyle, perceived health competence, barriers to health promotion, and asthma-related knowledge in persons with chronic asthma [dissertation]. Richmond: Virginia Commonwealth University; 1998
- 16. Becker H, Stuifbergen A. What makes it so hard? Barriers to health promotion experienced by people with multiple sclerosis and polio. Fam Community Health 2004;27(1):75-85. 14724504ArticlePubMed
- 17. Lee HH, Kim EJ, Lee MG. A validation study of Korea positive and negative affect schedule: the PANAS scales. Korean J Clin Psychol 2003;22(4):935-946. (Korean)
- 18. Rosenberg M, Schooler C, Schoenbach C. Global self-esteem and specific self-esteem: different concepts, different outcomes. Am Sociol Rev 1995;60(1):141-156Article
- 19. Adeniyi AF, Okafor NC, Adeniyi CY. Depression and physical activity in a sample of nigerian adolescents: levels, relationships and predictors. Child Adolesc Psychiatry Ment Health 2011;5: 16. 21569581ArticlePubMedPMC
- 20. Kowalski KC, Crocker PR, Donen RM. The physical activity questionnaire for older children (PAQ-C) and adolescents (PAQ-A) manual. 2004. cited 2014 Jan 24. Available from: http://www.dapa-toolkit.mrc.ac.uk/documents/en/PAQ/PAQ_manual.pdf
- 21. Kowalski KC, Crocker PRE, Kowalski NP. Original research convergent validity of the physical activity questionnaire for adolescents. Pediatr Exerc Sci 1997;9(4):342-352
- 22. Crocker PR, Bailey DA, Faulkner RA, Kowalski KC, McGrath R. Measuring general levels of physical activity: preliminary evidence for the Physical Activity Questionnaire for Older Children. Med Sci Sports Exerc 1997;29(10):1344-1349. 9346166ArticlePubMed
- 23. Loehlin JC. Latent variable models: an introduction to factor, path, and structural equation analysis. 4th ed. New York: Psychology Press; 2011. p. 1-30
- 24. George D, Mallery P. SPSS for Windows step by step: a simple guide and reference, 17.0 update. 10th ed. Boston: Allyn & Bacon; 2010. p. 87-92
- 25. Meyers LS, Gamst G, Guarino AJ. Applied multivariate research : design and interpretation. Thousand Oaks: Sage Publications; 2006. p. 180-182
- 26. Hoyle RH. Structural equation modeling: concepts, issues, and applications. Thousand Oaks: Sage Publications; 1995. p. 76-99
- 27. Park H, Kim N. Predicting factors of physical activity in adolescents: a systematic review. Asian Nurs Res 2008;2(2):113-128Article
- 28. Butts JB, Rich KL. Philosophies and theories for advanced nursing practice. Sudbury: Jones and Bartlett Publishers; 2011. p. 404-410
- 29. Peterson SJ, Bredow TS. Middle range theories : application to nursing research. 2nd ed. Philadelphia: Wolters Kluwer Health; 2009. p. 92-302
- 30. Galloway RD. Health promotion: causes, beliefs and measurements. Clin Med Res 2003;1(3):249-258. 15931316ArticlePubMedPMC
- 31. Wu TY, Pender N. Determinants of physical activity among Taiwanese adolescents: an application of the health promotion model. Res Nurs Health 2002;25(1):25-36. 11807917ArticlePubMed
- 32. McAuley E, Blissmer B, Katula J, Duncan TE, Mihalko SL. Physical activity, self-esteem, and self-efficacy relationships in older adults: a randomized controlled trial. Ann Behav Med 2000;22(2):131-139. 10962706ArticlePubMed
- 33. O'Sullivan D, Strauser DR. Operationalizing self-efficacy, related social cognitive variables, and moderating effects: implications for rehabilitation research and practice. Rehabil Couns Bull 2009;52(4):251-258Article
- 34. Centers for Disease Control and Prevention. Overcoming barriers to physical activity. cited 2011 Feb 16. Available from: http://www.cdc.gov/physicalactivity/everyone/getactive/barriers.html
- 35. Okun MA, Ruehlman L, Karoly P, Lutz R, Fairholme C, Schaub R. Social support and social norms: do both contribute to predicting leisure-time exercise? Am J Health Behav 2003;27(5):493-507. 14521246ArticlePubMed
- 36. Duncan SC, Duncan TE, Strycker LA. Sources and types of social support in youth physical activity. Health Psychol 2005;24(1):3-10. 15631557ArticlePubMed
- 37. Ostir GV, Cohen-Mansfield J, Leveille S, Volpato S, Guralnik JM. The association of positive and negative affect and exercise self-efficacy in older adults. J Aging Phys Act 2003;11(2):265-274Article
REFERENCES
Figure 1A hypothesized model of physical activity (PA) for teen age girls (n=495). Goodness of fit: chi-square=222.14, degree of freedom=10, p<0.001, root mean square error of approximation=0.208, goodness of fit index=0.87, adjusted goodness of fit index=0.61. *p<0.05, **p<0.01, ***p<0.001.

Figure 2The final model of physical activity (PA) for teen age girls (n=495). Goodness of fit: chi-square=7.69, degree of freedom=6, p<0.26, root mean square error of approximation=0.024, goodness of fit index=0.98, adjusted goodness of fit index=0.98. *p<0.05, **p<0.01, ***p<0.001.
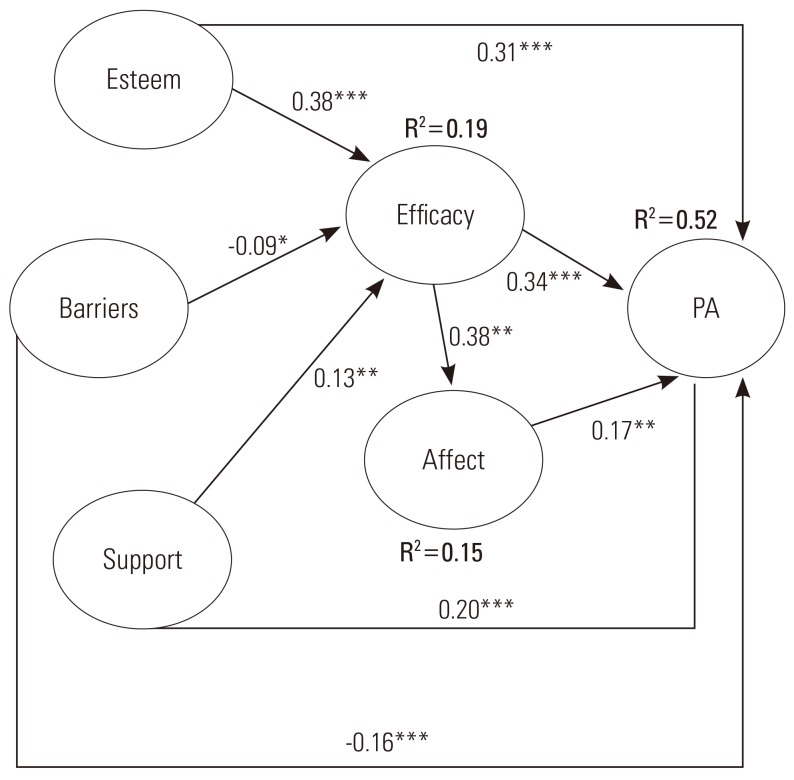
Table 1.Demographic characteristics of the sample (n=495)
Table 2.Means, standard deviations (SDs) and correlations among variables (n=495)
Table 3.Direct, indirect, and total effects of variables in the final model for predicting physical activity
Figure & Data
References
Citations
Citations to this article as recorded by 
- A meta-analysis of the relationship between social support and physical activity in adolescents: the mediating role of self-efficacy
Hao Lin, Haidong Chen, Qingzao Liu, Jie Xu, Shan Li
Frontiers in Psychology.2024;[Epub] CrossRef - Modelo de Nola Pender para promoção da saúde do adolescente
Daniela Bulcão Santi, Iara Sescon Nogueira, Vanessa Denardi Antoniassi Baldissera
REME-Revista Mineira de Enfermagem.2023;[Epub] CrossRef - Evaluation of Physical Activity and its Effective Factors in Junior High School Female Students in Rafsanjan City: Application of Social-cognitive Theory, 2017-18
Zahra Soleiman Ahari, Mohammad Asadpour, Leili Mazar, Mostafa Nasirzadeh
Qom Univ Med Sci J.2021; 15(3): 188. CrossRef - Predicting physical activity among urban adolescent girls: A test of the health promotion model
Vicki R. Voskuil, Lorraine B. Robbins, Steven J. Pierce
Research in Nursing & Health.2019; 42(5): 392. CrossRef - Health behaviours in emerging adulthood: Their relationship with perceived maternal and paternal parental attitudes and the mediating role of self-efficacy
Anna Maria Jankowska, Marta Łockiewicz, Dorota Dykalska-Bieck, Ariadna Łada, Weronika Owoc, Dawid Stańczykowski
Health Psychology Report.2017; 6(1): 94. CrossRef - The relationship between self-esteem and overall health behaviors in Korean adolescents
Junghyun Park, Young-Ho Kim, Seon-Joo Park, Sooyeon Suh, Hae-Jeung Lee
Health Psychology and Behavioral Medicine.2016; 4(1): 175. CrossRef - Should Schools Send BMI Report Cards to Parents? A Review of Literature
Alexander Henningsen, Piroska Boros, Kent Ingvalson, Fabio E. Fontana, Oksana Matvienko
Journal of Physical Education, Recreation & Dance.2015; 86(9): 26. CrossRef
 PubReader
 ePub Link
 Cite
Cite


