Adjustment for Multimorbidity in Estimations of the Burden of Diseases Using Korean NHIS Data
Article information

Abstract
The current multimorbidity correction method in the Global Burden of Disease studies assumes the independent occurrence of diseases. Those studies use Monte-Carlo simulations to adjust for the presence of multiple disease conditions for all diseases. The present study investigated whether the above-mentioned assumption is reasonable based on the prevalence confirmed from actual data. This study compared multimorbidity-adjusted years of lived with disability (YLD) obtained by Monte-Carlo simulations and multimorbidity-adjusted YLD using multimorbidity prevalence derived from National Health Insurance Service data. The 5 most common diseases by sex and age groups were selected as diseases of interest. No significant differences were found between YLD estimations made using actual data and Monte-Carlo simulations, even though assumptions about the independent occurrence of diseases should be carefully applied. The prevalence was not well reflected according to disease characteristics in those under the age of 30, among whom there was a difference in YLD between the 2 methods. Therefore, when calculating the burden of diseases for Koreans over the age of 30, it is possible to calculate the YLD with correction for multimorbidity through Monte-Carlo simulation, but care should be taken with under-30s. It is useful to apply the efficiency and suitability of calibration for multiplicative methods using Monte-Carlo simulations in research on the domestic disease burden, especially in adults in their 30s and older. Further research should be carried out on multimorbidity correction methodology according to the characteristics of multiple diseases by sex and age.
INTRODUCTION
Due to population aging, the increased prevalence of chronic diseases, and extended life expectancy, the prevalence of multimorbidity, which refers to the co-occurrence of 2 or more diseases in an individual, is growing [1-3]. As multimorbidity increases, the population’s use of medical expenses and resource consumption will increase, negatively affecting the burden of disease (BoD) [4,5]. Therefore, to accurately measure the health level of the population, there is a growing need to account for multimorbidity. The World Health Organization (WHO) calculates BoD in the Global Burden of Disease (GBD) studies using a single health level measurement indicator according to risk factors [6].
The disability-adjusted life-year (DALY) is the measure of overall disease burden used in the GBD, which is mainly conducted by the Institute for Health Metrics and Evaluation. DALYs are expressed by combining years of life lost due to early death and years of lived with disability (YLD) [7,8]. In the early GBD studies conducted by WHO, the BoD was calculated based on incidence rate without accounting for multimorbidity [9]. However, since calculating incidence-based BoD could not correctly reflect the prevalence, from 2010, multimorbidity started to be considered in estimating the BoD, assuming that the occurrence of one health condition would have no effect on the occurrence of another health condition [10,11]. In recent years, the BoD has been estimated using Monte-Carlo simulations after adjusting for multimorbidity and with the assumption that health conditions occur independently [7].
BoD research conducted in the early years in Korea also failed to take multimorbidity into account, measuring the total disease burden by simply summing the disease burden by individual disease [12]. Recently, however, by applying the research methodology of GBD, attempts have been made to calculate the BoD while correcting for multimorbidity [13-15]. When the multimorbidity-adjusted BoD is calculated, measuring prevalence and disability weights (DWs) for all combinations of multimorbidity is difficult from a practical standpoint. For this reason, multimorbidity is simulated hypothetically using a Monte-Carlo simulation, after which the DWs for individual diseases are estimated before calculating YLD. Previous research that assessed the validity of methods for calculating the DWs of multimorbidity established that calculating DWs with a multiplicative function is the most appropriate approach [14]. Nonetheless, there is insufficient evidence to evaluate the validity of the assumption of independent occurrence of diseases in the case of multimorbidity and to assess how to adjust for multimorbidity.
Therefore, this study aimed to empirically compare multimorbidity-adjusted YLD based on its prevalence from actual data with the multimorbidity-adjusted YLD estimated through a simulation assuming the independent prevalence of individual diseases for the sex-specific and age-specific top 5 diseases with the highest prevalence.
METHODS
Data Sources
This study used the customized research database of the National Health Insurance Service (NHIS) as the data source. In total, 9 456 637 individuals were selected by random sampling, which translates to 25% of the 2016 NHIS database for all qualified citizens (Supplemental Material 1). The top 5 diseases with the highest prevalence were selected by 5-year age and sex groups. Diagnostic codes were used from the International Classification of Diseases, 10th revision (ICD-10), and the definitions of the prevalence criteria and the diseases included in this study followed Yoon et al. [13]’s study. Thus, the ICD codes for the sex-specific and age-specific top 5 diseases with the highest prevalence were used, and based on the main diagnosis and sub-diagnosis, those who were hospitalized at least once in 2016 or those who satisfied the minimum number of outpatient visits were defined as patients. Cancer and injury, however, were not included in the prevalent disease groups. This is because in Yoon et al. [13]’s 2018 study, the same definition of a patient could not be applied to these 2 diseases as the data were obtained from another source. In Yoon et al. [13]’s study, the statistical data from the National Cancer Registration and Statistics data of National Cancer Center were used to calculate the BoD of cancer, and the Korean National Hospital Discharge In-depth Injury Survey data were used to calculate the BoD of injury.
Statistical Analysis
Assessment of the assumption of the independent occurrence of diseases
The actual prevalence of multimorbidity for the sex-specific and age-specific top 5 diseases with the highest prevalence was identified. The observed prevalence and the expected prevalence were calculated and compared for each multimorbidity combination. A standardized difference of less than 0.1 between the 2 groups according to balance diagnostics based on a 95% confidence interval (CI) was considered negligible [16,17].
Validity assessment of the correction method for multimorbidity
As aspects of multimorbidity tend to vary depending on sex and age, and YLD estimation varies depending on prevalence [18], this study analyzed sex-specific and age-specific prevalent diseases to calculate YLD reflecting the actual prevalence of multimorbidity.
The prevalence-based YLD was calculated using the prevalence and DWs of individual sequelae to estimate YLD due to those sequelae. Here, prevalence reflects duration of disease with a focus on cause–sequelae–health state, and not just cause, with an emphasis on a person’s overall health experience [15].
YLD before adjusting for multimorbidity based on actual data
The sex-specific and age-specific 5 most prevalent diseases were selected from actual data, and the distribution ratios of cause–sequelae–health state collected from Korean subjects [12] were applied to calculate the prevalence of disease sequelae. Afterwards, DWs for individual sequelae were estimated by applying a multiplicative function to DWs per state of health calculated with paired comparisons in Koreans [19].
YLD after adjusting for multimorbidity based on actual data
YLD was calculated by multiplying the DWs of multimorbidity by the prevalence of the combination of the sex-specific and age-specific 5 diseases obtained from the actual data. However, in the age group of 20 years old and younger, acute infectious diseases were included in the top diseases with the highest prevalence, but the actual duration of these diseases could not be specified. For this reason, the prevalence rate unadjusted for duration of disease was used. DWs were calculated by estimating the DWs of individual sequelae with a multiplicative function to calculate the DWs of an individual disease, then re-applying the multiplicative function for the DWs of the disease.
DWk : Disability weight for disease k
n : Total number of diseases
Multimorbidity-adjusted YLD using Monte-Carlo simulations
Applying the method used in the 2016 GBD study [6], assuming that hypothetical subjects were exposed to each of the 5 diseases at an independent rate, Monte-Carlo simulations were run based on the prevalence of individual sequelae of each disease, so that a single morbidity or a multimorbidity state was created for each of the 40 000 hypothetical subjects. The DWs of each hypothetical subject were assigned to his or her relevant disease.
ADWiκ: Attributable DW of phase sequelae k belonging to simulant l
DWcombined: DW for the combination of sequelae experienced by simulant I
The sum of the DWs of the 40 000 hypothetical subjects was divided by the total number of diseases in order to calculate the multimorbidity-adjusted YLD.
The process was repeated 1000 times in order to obtain a 95% CI and to enable a comparison of the 95% CIs of YLD estimates in order to confirm any differences. The validity of the application of Monte-Carlo simulations was reviewed according to age and sex. This study used SAS version 9.4 (SAS Institute Inc., Cary, NC, USA) to estimate the prevalence of multimorbidity, and the Monte-Carlo simulations were run in R version 4.0.2 (R Foundation, Vienna, Austria).
Ethics Statement
The study was conducted after receiving an exemption from the Research Ethics Review Committee (SEUMC 2021-01-004) of Ewha Womans University Seoul Hospital.
RESULTS
Assessment of the Assumption of Independent Prevalence Between Diseases
The prevalence of multimorbidity for the top 5 diseases with the highest prevalence is shown in Table 1. Subjects included for each of the 5 diseases were patients with that specific principal condition and not the other 4. The prevalence of multimorbidity was high in individuals aged 10 years old and younger or 60 years old and older. For male, the prevalence of multimorbidity per 1000 population for the 5 most prevalent diseases was highest for individuals aged 0-4 years, at 219.65. This estimate dropped to 3.77 in individuals aged 30-34 years, and then increased again to 170.28/1000 in individuals aged 80 years and older. For female, this estimate started at 187.00 in individuals aged 0-4 years, increased to 228.18 in individuals aged 5-9 years, then decreased to 9.23 in individuals aged 25-29 years, 9.21 in individuals aged 30-34 years, 3.49 in individuals aged 35-39 years, after which it continued to increase to 190.57/1000 in individuals aged 80 years and older.

Prevalence of multimorbidity for the 5 most prevalent diseases
Figure 1 shows the difference between the observed and expected prevalence of the sex-specific and age-specific top 5 diseases with the highest prevalence. In all age groups, the 95% CIs for observed prevalence and expected prevalence did not overlap. Table 2 illustrates the difference between the observed and expected prevalence, which decreased with age to the point that the difference was the smallest in individuals aged 50-54 years for male and in individuals aged 35-39 years for female. After this point, the difference increased again, and in individuals aged 80 years and older, the observed prevalence was 0.170 (95% CI, 0.160 to 0.180) and the expected prevalence was 0.068 (95% CI, 0.063 to 0.074) in males, whereas the observed prevalence was 0.191 (95% CI, 0.184 to 0.198) and the expected prevalence was 0.084 (95% CI, 0.079 to 0.088) in females. The standardized difference between the observed and expected prevalence was greater than 0.1 in individuals aged 0-24 years and over 60 in males, and in individuals aged 0-29 years and over 60 in females.
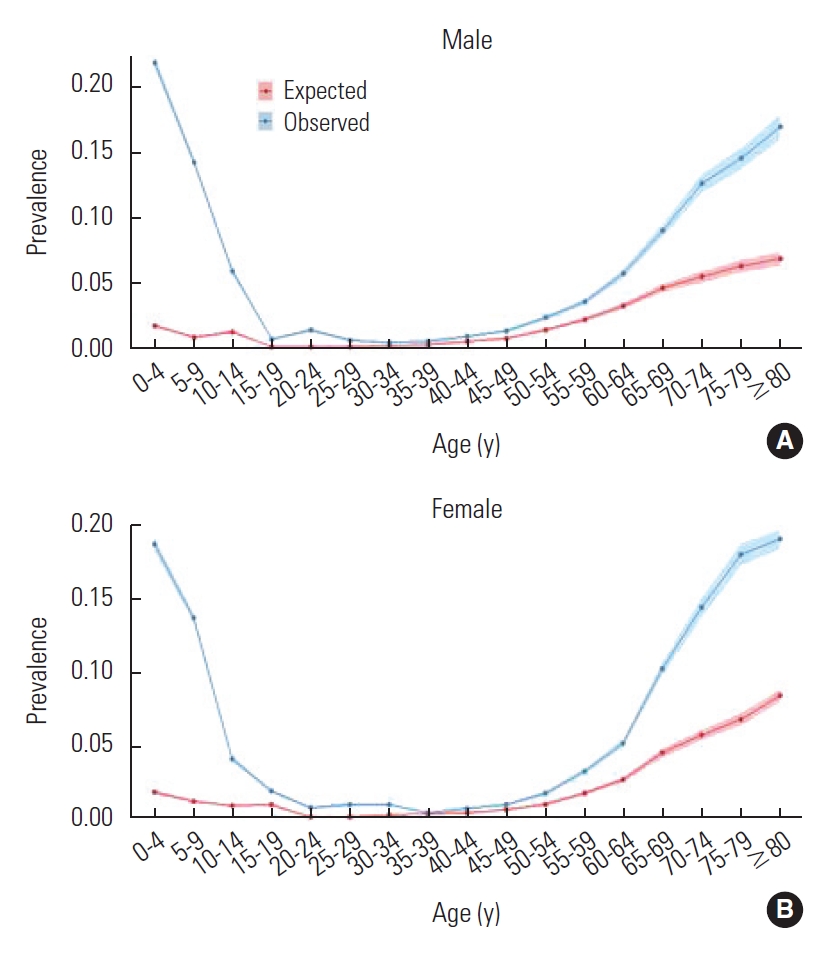
Comparison of observed and expected prevalence of multimorbidity for the five most prevalent diseases (A: male, B: female).

Observed and expected prevalence for multimorbidity with SDs
Assessment of the Validity of the Adjustment Method for Multimorbidity
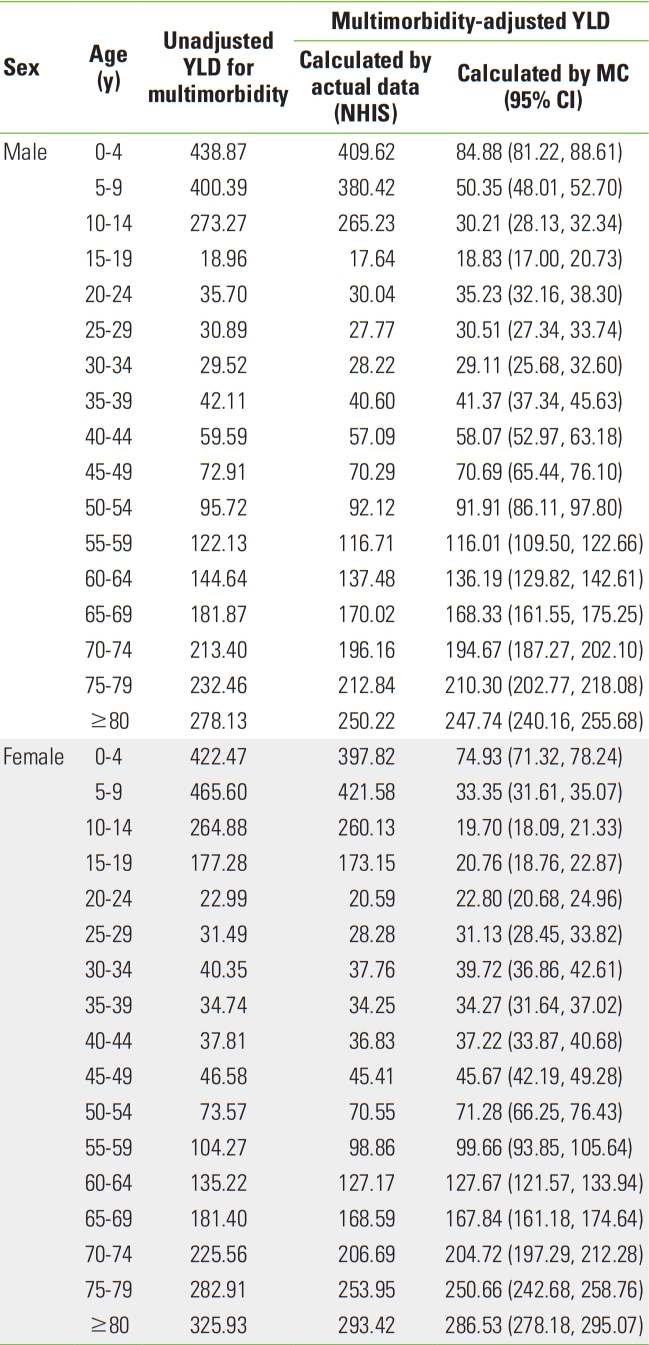
The multimorbidity-adjusted YLD values based on actual data and the multimorbidity-adjusted YLD values using Monte-Carlo simulations were compared. As shown in Table 3 and Supplemental Material 1, both YLD values had no significant differences, as shown by non-overlapping 95% CIs, for both males and females aged 30 years and older. There was a difference between the 2 multimorbidity-adjusted YLD values depending on the adjustment method and age, but this difference fell within the 95% CIs. However, since with individuals aged 20 years and younger, the prevalence of acute infectious diseases used in YLD calculation was not adjusted for duration of disease, the YLD in this case was substantially different from the YLD calculated using Monte-Carlo simulations.

Observed and predicted YLD adjusting for multimorbidity (per 1000 population)
Table 4 shows the comparison of YLD values before and after adjusting for multimorbidity. A multiplicative function was applied to both methods, and the YLD estimates were lower after adjusting for multimorbidity. After adjustment using Monte-Carlo simulations, YLDs decreased by between 0-15% except in males aged 0-14 years and in females aged 0-19 years. In all other age groups, the change in multimorbidity-adjusted YLD estimates increased with age. Since the duration of disease was not accounted for in males 0-14 years old and in females 0-19 years old due to the inclusion of acute infectious diseases, the difference between YLD values before and after adjusting for multimorbidity with Monte-Carlo simulations was significantly larger in these age groups. In individuals aged 30 years and older, the change in YLD after adjusting for multimorbidity using actual data and the change in YLD after adjusting for multimorbidity with Monte-Carlo simulations did not show a significant difference, as demonstrated by non-overlapping 95% CIs.

Comparison of YLD before and after adjusting for multimorbidity
DISCUSSION
Assessment of the Assumption of Independent Prevalence Between Groups
This study used and analyzed the exact list of diseases, disease codes, and standards for disease prevalence as used in the BoD studies of Koreans, thereby promoting straightforward application and use in future BoD studies. However, since cancer and injury were excluded for the purpose of this study, the sex-specific and age-specific top diseases with the highest prevalence may be different from the diseases generally considered as being highly prevalent.
The findings of this study revealed that, when calculating the prevalence of multimorbidity, assuming the independent occurrence of individual diseases should be done with caution in individuals aged 30 years and younger and in individuals aged 60 years and older. However, some diseases showed unusual differences in multimorbidity prevalence in relation to sex and age, which might lead to an overestimation of the BoD [20]. Therefore, for a more accurate estimation of YLD, one must identify any sex-specific or age-specific patterns of multimorbidity and any diseases for which assuming independent occurrence according to sex and age would be inappropriate.
Assessment of the Validity of the Method of Adjustment for Multimorbidity
The source for this study was the 2016 customized research database of the NHIS, through which the actual prevalence of multimorbidity was calculated for use in the analysis. Although previous studies have used the dependence correction factor in order to adjust for the prevalence of multimorbidity [20] and examined methods to identify the prevalence patterns of multimorbidity based on actual data [21], insufficient research has examined the validity of adjustment methods for multimorbidity using prevalence from actual data. Therefore, this study is significant in that it sought to assess the validity of the adjustment methods for multimorbidity when calculating the BoD using prevalence from actual data.
In individuals aged 30 years and older, the estimation of age-specific multimorbidity-adjusted BoD based on actual NHIS data showed no significant difference from that estimated with Monte-Carlo simulations assuming independent occurrence within the 95% CI. This implies that it is possible to calculate multimorbidity-adjusted YLD with Monte-Carlo simulations to estimate the BoD in Koreans aged 30 years and older.
The GBD studies also use Monte-Carlo simulations to account for multimorbidity when calculating the BoD, and they have performed analyses for all age groups as done in this study [7,22]. Moreover, an assessment study using the United States Medical Expenditure Panel Survey data on the validity of the adjustment method used in GBD studies reported that the correlation between the actual data-based YLD and the simulation-corrected YLD was high [23]. Furthermore, studies that have calculated the BoD of children specified the use of Monte-Carlo simulations to adjust for multimorbidity in an identical manner as in adults and included infectious diseases as key diseases [24]. It has been mentioned in GBD studies that in order to reduce the inaccuracy of estimates from adjusting for multimorbidity using simulations, 1000 simulations were run for each age-sex-country-year group and that 40 000 hypothetical subjects were created. They clarified that measures such as these yield relatively accurate estimates even in younger age groups with low prevalence rates. This study also utilized the same measures to avoid inaccuracy of adjusted estimates. However, since it is difficult to specify the duration of disease for diseases with a short duration when adjusting for multimorbidity with actual data, assessing the validity in such cases has limitations.
Attempts have been made to calculate prevalence-based BoD in BoD studies for Koreans [13], but incidence-based BoD calculations are still more widely used [12], where YLD equals the product of the number of incident cases, the morbidity period, and DWs. If adjustment for the duration of disease is needed for morbidity period calculation, the duration of disease is calculated with NHIS data for infectious diseases and with the DISMOD-II program [25] based on number of prevalent cases, incident cases, and deaths for all other diseases. Duration-adjusted prevalence varies substantially depending on how duration is calculated. As acute infectious diseases have a morbidity period shorter than 1 year, unlike chronic diseases, it is necessary to consider the duration of disease. In a study that calculated the prevalence-based BoD of Koreans, duration-adjusted prevalence was used for acute infectious diseases [13]. In this study, acute infectious diseases were among the top 5 prevalent diseases in individuals aged 20 years and younger. For acute infectious diseases, although duration-adjusted prevalence is used with Monte-Carlo simulations in the BoD calculation, estimating the duration-adjusted multimorbidity prevalence is difficult when using actual data. In other words, for curable diseases like acute infectious diseases with a short duration, considering cases with less than 1 year of duration of disease in the calculation of prevalence-based BoD could yield an overestimated result. Therefore, defining the diseases to be included in such calculation to estimate prevalence should be done with caution.
CONCLUSION
Changing the number of diseases to be included in calculations of multimorbidity changes the analysis results of a study [26]. Despite findings that associate a higher number of conditions included in multimorbidity calculations with a higher prevalence [27], this study calculated the prevalence of multimorbidity using actual data with only the 5 most prevalent diseases by sex and age. Furthermore, the sex-specific and age-specific top 5 diseases with the highest prevalence were different from those generally considered most prevalent because cancer and injury were excluded. However, as the objective of this study was to assess the validity of the assumption of independent occurrence as a method of multimorbidity-adjusted BoD calculation, rather than to calculate accurate BoD statistics, it aimed to minimize bias by selecting and analyzing diseases with high prevalence according to sex and age.
Both GBD studies and studies on BoD in Koreans use DWs of disease sequelae to calculate YLD. This study also used DWs of disease sequelae in both YLD calculation before multimorbidity adjustment based on actual data and YLD calculation after multimorbidity adjustment with Monte-Carlo simulations. In the multimorbidity-adjusted YLD calculation based on actual data, however, the DWs were applied using a multiplicative function. This study limited the number of most prevalent diseases to 5, which in turn limited the impact of the difference in the application method for DWs on estimation. Therefore, applying DWs with a higher number of diseases should be done with caution.
This study sought to verify the currently used multimorbidity adjustment method using Monte-Carlo simulations for the most prevalent diseases based on actual data. The findings revealed that there was no significant difference in estimates in individuals aged 30 years and older. However, in individuals aged 29 years and younger, adjusting for multimorbidity based on actual data was either not possible, or the values estimated using simulations were inaccurate depending on the diseases included as the most prevalent. As such, the assumption of independent occurrence may not be appropriate depending on the characteristics of certain diseases, which calls for designing a multimorbidity adjustment method that accounts for disease-specific characteristics. The findings of this study may be used as a basis for the current multimorbidity adjustment method using Monte-Carlo simulations.
SUPPLEMENTAL MATERIALS
Supplemental material is available at https://doi.org/10.3961/jpmph.21.583.
Korean version is available at https://doi.org/10.3961/jpmph.21.583.
Multimorbidity-adjusted YLD by methodology (per 1,000 population)
Notes
CONFLICT OF INTEREST
The authors have no conflicts of interest associated with the material presented in this paper.
FUNDING
This research was supported by a grant from the Korean Health Technology R&D Project, Ministry of Health & Welfare, Korea (study number HI18C0446 and REQ000046576-001).
ACKNOWLEDGEMENTS
None.
Notes
AUTHOR CONTRIBUTIONS
Conceptualization: Shin Y, Park H. Data curation: Choi EJ, Shin Y, Park H. Formal analysis: Shin Y, Lee EK. Funding acquisition: Park H. Methodology: Park B, Lee HA, Lee EK. Project administration: Shin Y, Choi EJ. Visualization: Shin Y. Writing – original draft: Shin Y. Writing – review & editing: Shin Y, Choi EJ, Lee HA, Park B, Lee EK, Park H.