
Articles
- Page Path
- HOME > J Prev Med Public Health > Volume 57(2); 2024 > Article
-
Original Article
Patterns of Health-related Quality of Life in Men Who Inject Drugs: A Survey in Southeast Iran -
Marzieh Nojomi1,2
 , Maysam Rezapour3, Neda Soleimanvandi Azar1, Mehdi Darabi4, Mehran Asadi-Aliabadi5
 -
Journal of Preventive Medicine and Public Health 2024;57(2):148-156.
DOI: https://doi.org/10.3961/jpmph.23.379
Published online: February 23, 2024
- 1,542 Views
- 76 Download
1Preventive Medicine and Public Health Research Center, Psychosocial Health Research Institute, Iran University of Medical Sciences, Tehran, Iran
2Department of Community and Family Medicine, School of Medicine, Iran University of Medical Sciences, Tehran, Iran
3Amol Faculty of Paramedical Sciences, Mazandaran University of Medical Sciences, Sari, Iran
4Kermanshah University of Medical Sciences, Kermanshah, Iran
5Health Sciences Research Center, Addiction Institute, Mazandaran University of Medical Sciences, Sari, Iran
- Corresponding author: Maysam Rezapour, Amol Faculty of Paramedical Sciences, Mazandaran University of Medical Sciences, Fiyaz Bakhsh Alley, Taleb Amoli Street, Sari 4615861468, Iran E-mail: maysam.rezapour@gmail.com
- Co-corresponding author: Mehran Asadi-Aliabadi, Health Sciences Research Center, Addiction Institute, Mazandaran University of Medical Sciences, Prophet Azam Complex, Km 18 Khazarabad Road, Sari 4847116548, Iran E-mail: mehran_asadi_a@yahoo.com
Copyright © 2024 The Korean Society for Preventive Medicine
This is an Open Access article distributed under the terms of the Creative Commons Attribution Non-Commercial License (http://creativecommons.org/licenses/by-nc/4.0/) which permits unrestricted non-commercial use, distribution, and reproduction in any medium, provided the original work is properly cited.
ABSTRACT
-
Objectives:
- Understanding patterns of quality of life in people who inject drugs (PWID) can help healthcare providers plan and manage their health problems in a more focused manner. Therefore, the current study aimed to identify patterns of health-related quality of life in PWID in southeast Iran.
-
Methods:
- This cross-sectional study was conducted in southeast Iran on men who had injected drugs at least once during the last year. We used convenience sampling in 2 drop-in centers and venue-based sampling at 85 venues. Demographic characteristics, high-risk behaviors, and health-related quality of life were evaluated using the 5-level EQ-5D version (EQ-5D-5L) questionnaire. Latent profile analysis was used to identify patterns of quality of life.
-
Results:
- This study enrolled 398 PWID, who had a mean age of 34.1±11.4 years. About 47.9% reported a prison history in the last 10 years, 59.2% had injected drugs in the last month, and 31.6% had a history of sharing syringes. About 46.3% reported having 2 or more sexual partners in the last 6 months, and 14.7% had a history of sex with men. Out of the 5 EQ-5D-5L profiles, the fifth profile had the most people (36.6%). Most variations in quality of life were related to pain and discomfort.
-
Conclusions:
- We showed that the pain and discomfort dimension of EQ-5D-5L had more variation in PWID. This finding will be useful for allocating appropriate interventions and resources to promote health-related quality of life in this population.
- Globally, there are approximately 11 million people who inject drugs (PWID), 12.7% of whom are human immunodeficiency virus (HIV)-positive [1]. The risk of HIV transmission during a single injection with an infected needle is around 70% [2]. Additionally, 39.4% of PWID are living with hepatitis C virus infection [3]. In addition to these diseases and sometimes following them, other infectious and non-infectious diseases threaten the health of PWID and even their relatives [4-7]. Despite the physical health implications, a broad spectrum of psychological disorders is frequently reported among this group [8-10]. These common comorbidities increase the likelihood of engaging in high-risk behaviors [8,11].
- Currently, based on the existing evidence, 208 000 PWID live in Iran [12]. It is estimated that 70% of HIV infections in Iran are due to high-risk injection practices among this population [13,14]. According to the World Health Organization (WHO), harm reduction programs are being implemented in many countries around the world [15]. These programs comprise a suite of initiatives and services designed to minimize the harm to individuals and communities, particularly those at high risk for drug-related issues, including HIV infection. For PWID, comprehensive harm reduction packages include needle and syringe programs, opioid substitution therapy, targeted information, education, and communication for PWID and their sexual partners, and promoting condom use among PWID and their partners [15]. Despite the challenges in reaching this population, Iran has launched various programs to ensure high-risk groups have adequate access to services. These services are provided through voluntary counseling and testing centers (VCTCs), drop-in centers (DICs), and mobile clinics [16]. Proper implementation of these programs can significantly contribute to achieving or approaching a normal life that meets the needs of these individuals. However, the coverage of these programs is still very poor in many areas [15], which can reduce the health-related quality of life (HRQoL) for PWID [17].
- HRQoL is considered a key indicator for assessing the impact of health interventions [18]. The quality of life among PWID is influenced by a variety of factors, including cultural, social, economic, and geographical elements, each of which can be examined individually. Recently, there has been growing interest in assessing HRQoL patterns to identify subgroups in need of specialized clinical services tailored to their specific needs. This approach can enhance the overall quality of healthcare. Although several studies have examined HRQoL patterns among medical staff [19] and breast cancer patients [20], there is limited research on HRQoL among PWID [21]. Latent profile analysis (LPA) is a person-centered approach that can identify patterns or hidden subgroups based on individual responses from continuous data. A previous study among 574 Chinese medical staff [19], which analyzed individual HRQoL responses, identified 3 distinct HRQoL patterns: high, moderate, and low HRQoL. To our knowledge, there is scant information on the patterns of HRQoL among PWID in Iran. Therefore, by identifying HRQoL patterns in this population, we can provide health managers and decisionmakers with insights on how to improve access to services in terms of both quantity and quality.
- Therefore, the aim of this study was to identify patterns of HRQoL among PWID through LPA. Subsequently, we investigated the relationships between socio-demographic and HIVrelated factors and these HRQoL patterns.
INTRODUCTION
- Study Setting and Sampling
- A cross-sectional study was conducted in Iranshahr, located in the border region of southeastern Iran, adjacent to the borders of Pakistan and Afghanistan. The study area was equipped with 3 DICs, 1 VCTC, and 5 mobile teams to provide services. Within this community of 254 314 people, there were 11 203 drug users, 829 PWID, and 122 venues identified. The region is expansive, and its population density is high compared to other areas of Iran, where the average is 10 people per square kilometer. In contrast, other parts of Iran have an average population density of 46 people per square kilometer. Approximately 74% of the population in this area resides in rural settings [22].
- In the initial phase of this study, invitations were extended to the managers of 3 DICs to participate. Of these, 2 DICs and 3 mobile teams agreed to collaborate. Prior to commencing the survey, 8 interviewers, organized into 4 teams, received training and orientation. Additionally, an observer was appointed to oversee monitoring and quality assurance. The survey was conducted daily, including holidays, from 9 a.m. to 6 p.m., between May 11, 2019 and June 17, 2019. The participants of this study comprised 398 PWID, with 209 from the 2 DICs and 189 from 85 different venues. Each PWID received an incentive of 100 000 rials (the currency of Iran) for their participation. The inclusion criteria were as follows: male individuals aged 18 years or older, a history of injecting drugs at least once in the past year, and provision of informed consent for study participation. Participants were informed that they had the right to withdraw from the interview at any point. Furthermore, all questionnaires were completed anonymously.
- Measures and Instruments
- To collect information on HRQoL, we utilized the 5-level EQ-5D version (EQ-5D-5L) questionnaire. Trained community health workers conducted these assessments through face-to-face interviews. We gathered socioeconomic data and other characteristics, including age, marital status, education level, employment status over the past year, monthly income, residency status, and access to heating and cooling equipment. We also considered financial constraints affecting the ability to purchase essential food, any history of imprisonment or detention exceeding a week in the past 10 years, the timing of the last drug injection, the number of sexual partners in the past 6 months, age at first drug use, age at first drug injection, high-risk injection practices, age at first sexual experience, frequency of sexual encounters in the past month, male-to-male sexual contact, perception of HIV risk, and self-rated health. These factors were assessed using a questionnaire, which consisted of 5 dimensions: mobility, self-care, usual activities, pain/ discomfort and anxiety/depression. A weighted sum was used to provide a single index value for health status [23]. Each dimension had a 5-point response option, as follows: no problems (code=1), slight problems (code=2), moderate problems (code=3), severe problems (code=4), and extreme problems (code=5) [24]. The Persian version of this questionnaire was prepared after correspondence with the EuroQoL Group.
- Statistical Analysis
- LPA was conducted to identify profiles (patterns) of HRQoL in PWID based on 5 HRQoL items. The analysis commenced with a 2-profile model, with the number of profiles incrementally increased by 1 until the model failed to converge. Latent profile models were evaluated to ascertain the most suitable number of profiles. To determine the optimal profile, data fit indices were employed in conjunction with empirical evidence and interpretability. The model fit statistics included the Akaike information criterion (AIC), Bayesian information criterion (BIC) [25], sample size-adjusted Bayesian information criterion (aBIC) [26], and bootstrapping likelihood ratio-test (BLRT). Low BIC, AIC, and aBIC values indicate better model fit. A simulation study showed that aBIC is a superior index compared to BIC and AIC [27]. A significant BLRT p-value indicates that the latent class model with K classes is better than the simpler K-1 class model. Furthermore, the entropy value (0-1) was considered to assess the quality of the classification of individuals into classes, with values closer to 1 indicating a more desirable classification. Finally, the associations between the identified profiles and the independent variables were examined by one-way analysis of variance and the Tukey post-hoc test, as well as the chi-square test using Stata version 14 (StataCorp., College Station, TX, USA). LPA was performed using Mplus 7.4, and missing data were treated using the full-information maximum likelihood.
- Ethics Statement
- This study has been approved by Iran University of Medical Sciences Institutional Review Board (code: IR.IUMS.REC.1398.14018). Written informed consent was obtained from the study participants.
METHODS
- In this study, 398 PWID were evaluated. The participants’ mean age was 34.11±11.39 years. Approximately 59.2% had no monthly income, and 64.7% were homeless. Over 99.2% lacked access to heating and cooling equipment, and 94.1% reported difficulties in purchasing essential foods in the past year. Additional characteristics of the participants are presented in Table 1.
- The mean and standard deviations (SDs) for quality of life across 5 dimensions are presented in Table 2. A range of latent profile models, from 2 to 6, were estimated using the 5 quality of life items (Table 2).
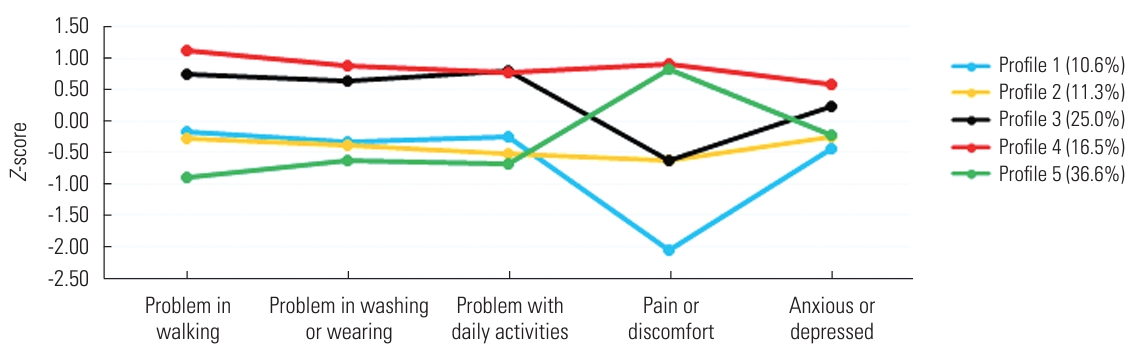
- The 7-latent profile model failed to converge. Although the 6-profile solution had the lowest AIC value, the BIC and aBIC values were lowest for the 5-profile solution. Consequently, the optimal model was not clearly identified. However, the entropy value for the 5-profile solution was higher than that of the 6-profile solution, even though it was highest for the 3-profile solution. Since the p-value of the BLRT was significant for all models, this index did not provide useful differentiation. In contrast, the p-value of the Lo-Mendell-Rubin–adjusted likelihood ratio-test was non-significant for the 6-profile solution but significant for the 5-profile solution, as shown in Table 3. The profiles were labeled as follows: the first profile as “medium multiple problems without pain” (MPWP), the second profile as “medium multiple problems” (MP), the third profile as “high multiple problems with medium pain” (HPMP), the fourth profile as “high multiple problems” (HP), and the fifth profile as “low multiple problems with high pain” (LPHP).
- The profiles extracted from the 5-profile analysis exhibit a uniform clustering distribution of participants. Both the fit indices and substantive interpretation endorsed the 5-profile solution as the preferred model. The Z-score for each item across the profiles is depicted in Figure 1.
- The association of latent profiles with related variables, based on the group’s differences across these variables, is presented in Table 4. The results indicated significant differences in all the variables shown in Table 4, with the exception of the men who have sex with men variable. Age differed across the 5 profiles (F=12.8; p<0.001), with profile 5 having the lowest and profile 4 having the highest mean age. Education levels also varied significantly across the profiles (χ2=34.5, p<0.001). Notably, profiles 4 and 5 had a higher proportion of illiterate participants compared to profiles 1, 2, and 3. For participants with primary and high school education, profiles 3 and 5 had a higher proportion than profiles 1, 2, and 4. Marital status differed across the 5 profiles (χ2=53.1, p<0.001). Specifically, single participants were more commonly found in profiles 4 and 5 than in profiles 1, 2, and 3. Participants with 1 wife were more frequently clustered in profile 5 relative to the other profiles. Men with more than 1 wife were predominantly clustered in profiles 3 and 5, as opposed to the other profiles.
- The prison or detention status of participants over the past 10 years (for periods exceeding 1 week) varied significantly across the 5 profiles (χ2=13.1, p<0.05). Participants with a history of imprisonment were less likely to be found in profiles 1 and 2 compared to the other profiles. Conversely, participants with no history of imprisonment were more commonly associated with profiles 3 and 5 than with the other profiles.
- The timing of the last drug injection varied significantly across the 5 profiles (χ2=129.5, p<0.001). Participants whose last injection occurred less than 1 month ago were predominantly clustered in profiles 1 and 2, relative to the other profiles. Those whose last injection was between 1 month and 6 months ago were more frequently found in profile 3 compared to the other profiles. Participants whose last injection occurred more than 6 months ago were less commonly associated with profiles 4 and 5 when compared to the other profiles.
- The number of sexual partners in the last 6 months differed significantly across the 5 profiles (χ2=48.8, p<0.001). Participants who had only 1 sexual partner in the past 6 months were predominantly clustered in profiles 2 and 4, compared to the other profiles. Conversely, those who had multiple sexual partners in the last 6 months were less frequently found in profiles 1 and 2. The age at first drug consumption was lower for individuals in latent profiles 1 and 2 than for those in profiles 4 and 5 (F=5.6, p<0.001). The age at first drug injection was similar across all profiles, with the exception of profile 5 (F=18.7, p<0.001).
- High-risk injection status differed significantly across the 5 profiles (χ2=109.7, p<0.001). Participants who reported high-risk injection behaviors constituted the largest percentage in profile 5. The age of first sexual experience was higher for profiles 1 and 4 than for the other profiles (F=7.7, p<0.001). The number of sexual partners in the past month varied across the 5 profiles (χ2=50.1, p<0.001). Participants who had 2 or fewer partners in the last month were more commonly clustered in profiles 3 and 5 compared to the other profiles.
- Risk perception of HIV varied significantly across the 5 profiles (χ2=97.8, p<0.001). Participants who reported “yes” regarding their risk perception of HIV were predominantly clustered in profile 5, more so than in other profiles. Conversely, those who reported “no” were mainly clustered in profile 3. The status of being a man who has sex with men did not differ significantly across the 5 profiles (χ2=4.7, p>0.05). Lastly, participants in profile 4 reported the lowest self-rated health (F=8.8, p<0.001).
RESULTS
- The aim of the current study was to extract HRQoL patterns using LPA in men who inject drugs and to examine their association with HIV-related factors. The findings indicated that individuals clustered in the HP and LPHP profiles had the highest scores, while the MPWP profile had the lowest scores. Additionally, individuals in the HPMP and HP profiles exhibited similar levels of multiple problems. However, in terms of pain and discomfort, individuals in the HPMP profile scored lower than those in the HP profile.
- Anxiety and depression did not show significant variation among the extracted patterns; however, the prevalence of anxiety and depression among PWID was high. The study by Armstrong et al. [28] on men who inject drugs in India revealed that 84% of participants exhibited symptoms of depression, while 71% showed symptoms of anxiety. As has been reported in other studies [29,30], the highly stigmatized nature of drug injection and the associated shame, along with disconnection from family and community, appear to contribute to the marginalization of PWIDs and a high incidence of depression and anxiety. This, in turn, leads to a diminished quality of life. Another study identified a significant association between depression and poor HRQoL in PWID [31]. In the study conducted by Vasylyev et al. [30] among HIV-positive PWID in Ukraine, it was found that 7 out of 10 HIV-positive PWIDs had anxiety, and 6 out of 10 experienced depression.
- The participants who reported abstaining from drug injection for more than 6 months exhibited the lowest frequency of use. Compared to those who reported their last injection of drugs as occurring less than 1 month ago or between 1 month to 6 months ago, these variations in latent profiles were more pronounced. The LPHP profile contained the highest frequency of participants who reported their last drug injection as occurring less than 1 month prior, whereas there were no participants in this profile who reported a lapse of more than 6 months since their last injection. The study by Korthuis et al. [32] demonstrated that both current and former drug use were linked to a decrease in HRQoL when compared to individuals who had never used drugs.
- Participants who had multiple sexual partners in the past 6 months were more likely to fall into the LPHP category. Previous studies have indicated that a higher number of sexual partners is associated with negative effects on HRQoL [33,34]. It appears that having multiple sexual partners may lead to a reduction in social support, which in turn can diminish the psychological and mental aspects of quality of life. Conversely, the study by Préau et al. [35] found that social support from a stable partner was a significant predictor of “normal” mental HRQoL among HIV-infected injecting drug users.
- The HRQoL scores observed in the PWID population are notably lower than those reported for other vulnerable groups in the literature. Fischer et al. [36] found that PWID experienced significantly reduced HRQoL across all domains compared to individuals with chronic heart disease, prisoners, and those with spinal cord injuries. Additionally, their HRQoL was significantly worse in most domains than that of individuals with pain, neurological disorders, and stroke. Similar to our results, the findings of Costenbader et al. [37], who conducted a study among PWID in North Carolina, showed that HRQoL scores for PWID were significantly lower than those of the general population.
- The current study has several limitations. First, as this is a cross-sectional study, the sample may not provide a representative overview of drug injectors. Consequently, the generalizability of our findings could be limited. Second, we did not examine changes or stability in these patterns over time, nor how profiles might predict the long-term HRQoL in PWID. Longitudinal studies are required to address this objective. Finally, the use of non-probability sampling precludes the extrapolation of our research findings.
- To our knowledge, no studies have utilized LPA to investigate HRQoL patterns in PWID. Therefore, our findings offer valuable insights for policymakers to inform targeted reforms aimed at improving HRQoL in this population. Our analysis revealed significant heterogeneity in HRQoL among PWID. Notably, the dimension of discomfort and pain emerged as particularly important due to its higher variation across different groups. Consequently, policymakers should consider adopting more tailored interventions that address this dimension.
DISCUSSION
-
Conflict of Interest
The authors have no conflicts of interest associated with the material presented in this paper.
-
Funding
This work was supported by Iran University of Medical Sciences (grant No. 14018).
-
Author Contributions
Data curation: Rezapour M, Asadi-Aliabadi M. Formal analysis: Rezapour M, Asadi-Aliabadi M. Funding acquisition: Nojomi M, Rezapour M, Asadi-Aliabadi M, Darabi M, Azar NS. Methodology: Nojomi M, Asadi-Aliabadi M. Project administration: Nojomi M, Asadi-Aliabadi M. Visualization: Rezapour M, Asadi-Aliabadi M, Darabi M, Azar NS. Writing – original draft: Rezapour M, Asadi-Aliabadi M, Darabi M, Azar NS. Writing – review & editing: Nojomi M, Rezapour M, Asadi-Aliabadi M, Darabi M, Azar NS.
Notes
Acknowledgements
| Profiles | AIC | BIC | aBIC | LMR | BLRT | Entropy |
|---|---|---|---|---|---|---|
| 2nd | 4043.8 | 4107.2 | 4056.4 | 428.4*** | 440.4*** | 0.84 |
| 3rd | 3618.7 | 3705.9 | 3636.1 | 425.1 | 437.1*** | 1.00 |
| 4th | 3276.3 | 3387.2 | 3298.4 | 347.1* | 354.3* | 0.98 |
| 5th1 | 3183.2 | 3315.9 | 3110.1 | 102.9* | 105.1*** | 0.95 |
| 6th | 3157.6 | 3316.1 | 3189.1 | 36.9 | 37.6*** | 0.94 |
| 7th | Did not converge | |||||
| Variables | Profile 1 (medium multiple problems without pain) | Profile 2 (medium multiple problems) | Profile 3 (high multiple problems with medium pain) | Profile 4 (high multiple problems) | Profile 5 (low multiple problems with high pain) | Chi-square or F-statistics1 | Group differences |
|---|---|---|---|---|---|---|---|
| Total | 41 (10.6) | 44 (11.3) | 97 (25.0) | 64 (16.5) | 142 (36.6) | ||
| Age (y) | 36.6±9.0 | 33.3±8.3 | 37.7±10.8 | 38.2±13.7 | 29.2±10.3 | 12.8*** | 1,3,4>5 |
| Education | 34.5*** | ||||||
| Illiterate | 4 (9.8) | 1 (2.3) | 6 (6.2) | 18 (28.1) | 13 (9.2) | 23.0*** | 4,5>1,2,3 |
| Primary | 5 (12.2) | 8 (18.2) | 29 (29.9) | 16 (25.0) | 28 (19.7) | 5.4* | 3,5>1,2,4 |
| High school | 32 (78.1) | 35 (79.6) | 62 (63.9) | 30 (46.9) | 101 (71.1) | 6.1** | 3,5>1,2,4 |
| Marital status | 53.1*** | ||||||
| Single | 17 (41.5) | 14 (31.8) | 18 (18.6) | 7 (11.1) | 5 (3.5) | 39.2*** | 1,2,3>4,5 |
| Married 1 wife | 13 (31.7) | 16 (36.4) | 32 (33.0) | 20 (31.7) | 71 (50.0) | 6.7* | 5>1,2,3,4 |
| ≥2 wives | 11 (26.8) | 14 (31.8) | 47 (48.4) | 36 (57.1) | 66 (46.5) | 7.1* | 1,2<3,4,5 |
| Prison (or detention) in the past 10 y (more than a week) | 13.1* | ||||||
| Yes | 15 (36.6) | 19 (43.2) | 41 (42.7) | 43 (67.2) | 68 (47.9) | 1,2<3,4,5; 3,4<5 | |
| No | 26 (63.4) | 25 (56.8) | 55 (57.3) | 21 (32.8) | 74 (52.1) | 1,2,4<3,5 | |
| The last time of drug injection (mo) | 129.5*** | ||||||
| <1 | 9 (21.9) | 10 (22.7) | 40 (41.7) | 43 (67.2) | 128 (90.1) | 47.9*** | 1,2<3,4,5; 3,4<5 |
| 1-6 | 17 (41.5) | 18 (40.9) | 40 (41.7) | 13 (20.3) | 14 (9.9) | 31.2*** | 1,2,4,5<3 |
| >6 | 15 (36.6) | 16 (36.4) | 16 (16.7) | 8 (12.5) | 0 (0.0) | 50.4*** | 5,4<1,2,3; 5<4 |
| The no. of sexual partners in the last 6 mo | 48.8*** | ||||||
| 1 | 30 (75.0) | 32 (74.4) | 66 (68.7) | 32 (50.8) | 46 (32.6) | 22.6*** | 1,2,4<3,5 |
| ≥2 | 10 (25.0) | 11 (25.6) | 30 (31.2) | 31 (49.2) | 95 (67.4) | 26.3*** | 1,2<3,4,5; |
| Age at first drug consumption | 17.3±1.3 | 17.0±1.8 | 18.0±1.9 | 18.6±1.8 | 18.2±2.1 | 5.6*** | 1<4; 2<4,5 |
| Age in first drug injection | 25.3±5.3 | 23.3±4.2 | 23.2±3.4 | 23.3±4.3 | 20.0±2.9 | 18.7*** | 5<1,2,3,4 |
| High risk injection | 109.7*** | ||||||
| Yes | 4 (9.8) | 6 (14.6) | 8 (8.8) | 12 (22.2) | 79 (68.1) | 74.9*** | 1,2,3,4<5 |
| No | 37 (90.2) | 35 (85.4) | 83 (91.2) | 42 (77.8) | 37 (31.9) | 34.9** | 1,2,4,5<3 |
| Age at first sexual intercourse | 19.6±2.1 | 18.8±1.8 | 18.7±1.3 | 19.1±1.5 | 18.1±1.5 | 7.7*** | 3,5<1; 5<4 |
| The no. of instances of sexual intercourse with partners in the last month | 50.1*** | ||||||
| ≤2 | 32 (91.4) | 29 (74.4) | 81 (94.2) | 44 (77.2) | 62 (53.4) | 12.8** | 3,5>1,2,4 |
| >2 | 3 (8.6) | 10 (25.6) | 5 (5.8) | 13 (22.8) | 54 (46.5) | 37.3*** | 5>1,2,3,4 |
| Man-who-has-sex-with-men status | 4.7 | ||||||
| Yes | 4 (10.3) | 4 (9.8) | 14 (15.4) | 5 (8.9) | 22 (19.1) | NS | |
| No | 35 (89.7) | 37 (90.2) | 77 (84.6) | 51 (91.1) | 93 (80.9) | NS | |
| Risk perception of HIV | 97.8*** | ||||||
| Yes | 10 (24.4) | 10 (25.0) | 19 (20.21) | 24 (42.11) | 94 (81.03) | 53.7*** | 5>1,2,3,4 |
| No | 31 (75.6) | 30 (75.0) | 75 (79.79) | 33 (57.89) | 22 (18.97) | 44.1*** | 3>1,2,4,5 |
| Self-rated health | 46.1±10.6 | 47.6±6.9 | 41.4±10.2 | 38.1±11.8 | 42.9±7.4 | 8.8*** | 1,2>4; 5>4; 2>3 |
Values are presented as number (%) or mean±standard deviation.
EQ-5D, EuroQol-5 Dimension; HIV, human immunodeficiency virus; NS, not significant.
1 One-way analysis of variance was conducted for continuous variables and the chi-square test was used for categorical variables.
* p<0.05,
** p<0.01,
*** p<0.001.
- 1. United Nations Office on Drugs and Crime. Prevalence of drug use; 2020 [cited 2023 Aug 29]. Available from: https://www.unodc.org/unodc/en/data-and-analysis/wdr2021_annex.html
- 2. Fauci AS, Folkers GK, Clifford Lane H. Chapter 197: human immunodeficiency virus disease: AIDS and related disorders. In: Kasper DL, Harrison TR, editors. Harrison’s principles of internal medicine. 16th ed. New York: McGraw-Hill; 2005. p. 1076-1139
- 3. Grebely J, Larney S, Peacock A, Colledge S, Leung J, Hickman M, et al. Global, regional, and country-level estimates of hepatitis C infection among people who have recently injected drugs. Addiction 2019;114(1):150-166. https://doi.org/10.1111/add.14393ArticlePubMed
- 4. Degenhardt L, Charlson F, Stanaway J, Larney S, Alexander LT, Hickman M, et al. Estimating the burden of disease attributable to injecting drug use as a risk factor for HIV, hepatitis C, and hepatitis B: findings from the Global Burden of Disease Study 2013. Lancet Infect Dis 2016;16(12):1385-1398. https://doi.org/10.1016/S1473-3099(16)30325-5ArticlePubMed
- 5. Des Jarlais DC, Kerr T, Carrieri P, Feelemyer J, Arasteh K. HIV infection among persons who inject drugs: ending old epidemics and addressing new outbreaks. AIDS 2016;30(6):815-826. https://doi.org/10.1097/QAD.0000000000001039ArticlePubMed
- 6. Larney S, Peacock A, Mathers BM, Hickman M, Degenhardt L. A systematic review of injecting-related injury and disease among people who inject drugs. Drug Alcohol Depend 2017;171: 39-49. https://doi.org/10.1016/j.drugalcdep.2016.11.029ArticlePubMed
- 7. McCarthy NL, Baggs J, See I, Reddy SC, Jernigan JA, Gokhale RH, et al. Bacterial infections associated with substance use disorders, large cohort of United States hospitals, 2012-2017. Clin Infect Dis 2020;71(7):e37-e44. https://doi.org/10.1093/cid/ciaa008ArticlePubMed
- 8. Mackesy-Amiti ME, Donenberg GR, Ouellet LJ. Prevalence of psychiatric disorders among young injection drug users. Drug Alcohol Depend 2012;124(1-2):70-78. https://doi.org/10.1016/j.drugalcdep.2011.12.012ArticlePubMedPMC
- 9. Mwangi C, Karanja S, Gachohi J, Wanjihia V, Ngang’a Z. Depression, injecting drug use, and risky sexual behavior syndemic among women who inject drugs in Kenya: a cross-sectional survey. Harm Reduct J 2019;16(1):35. https://doi.org/10.1186/s12954-019-0307-5ArticlePubMedPMC
- 10. Williams SC, Davey-Rothwell MA, Tobin KE, Latkin C. People who inject drugs and have mood disorders-a brief assessment of health risk behaviors. Subst Use Misuse 2017;52(9):1181-1190. https://doi.org/10.1080/10826084.2017.1302954ArticlePubMedPMC
- 11. Lemstra M, Rogers M, Thompson A, Moraros J, Buckingham R. Risk indicators of depressive symptomatology among injection drug users and increased HIV risk behaviour. Can J Psychiatry 2011;56(6):358-366. https://doi.org/10.1177/070674371105600607ArticlePubMed
- 12. Nikfarjam A, Shokoohi M, Shahesmaeili A, Haghdoost AA, Baneshi MR, Haji-Maghsoudi S, et al. National population size estimation of illicit drug users through the network scale-up method in 2013 in Iran. Int J Drug Policy 2016;31: 147-152. https://doi.org/10.1016/j.drugpo.2016.01.013ArticlePubMed
- 13. Shokoohi M, Karamouzian M, Osooli M, Sharifi H, Fahimfar N, Haghdoost A, et al. Low HIV testing rate and its correlates among men who inject drugs in Iran. Int J Drug Policy 2016;32: 64-69. https://doi.org/10.1016/j.drugpo.2016.03.009ArticlePubMed
- 14. Rahimi J, Gholami J, Amin-Esmaeili M, Fotouhi A, Rafiemanesh H, Shadloo B, et al. HIV prevalence among people who inject drugs (PWID) and related factors in Iran: a systematic review, meta-analysis and trend analysis. Addiction 2020;115(4):605-622. https://doi.org/10.1111/add.14853ArticlePubMed
- 15. World Health Organization. Health topics: HIV/AIDS: 2020 [cited 2023 Jul 4]. Available from: https://www.who.int/europe/health-topics
- 16. Sharifi H, Mirzazadeh A, Shokoohi M, Karamouzian M, Khajehkazemi R, Navadeh S, et al. Estimation of HIV incidence and its trend in three key populations in Iran. PLoS One 2018;13(11):e0207681. https://doi.org/10.1371/journal.pone.0207681ArticlePubMedPMC
- 17. Tran BX, Nguyen LH, Nong VM, Nguyen CT, Phan HT, Latkin CA. Behavioral and quality-of-life outcomes in different service models for methadone maintenance treatment in Vietnam. Harm Reduct J 2016;13: 4. https://doi.org/10.1186/s12954-016-0091-4ArticlePubMedPMC
- 18. Karimi M, Brazier J. Health, health-related quality of life, and quality of life: what is the difference? Pharmacoeconomics 2016;34(7):645-649. https://doi.org/10.1007/s40273-016-0389-9ArticlePubMed
- 19. Huang J, Zhu J, Ruan Y, Zhou H, Guo W, Dong A. Health-related quality of life in Chinese medical staff: a latent profile analysis. Front Public Health 2023;11: 1183483. https://doi.org/10.3389/fpubh.2023.1183483ArticlePubMedPMC
- 20. Pinheiro LC, Tan X, Olshan AF, Wheeler SB, Reeder-Hayes KE, Samuel CA, et al. Examining health-related quality of life patterns in women with breast cancer. Qual Life Res 2017;26(7):1733-1743. https://doi.org/10.1007/s11136-017-1533-5ArticlePubMedPMC
- 21. Cheng Q, Bajis S, Cunningham E, Shih ST, Schulz M, Marshall AD, et al. Health-related quality of life among people who inject drugs in Australia. Qual Life Res 2023;32(11):3195-3207. https://doi.org/10.1007/s11136-023-03465-3ArticlePubMedPMC
- 22. Wikipedia. Iranshahr, Iran [cited 2023 Jul 18]. Available from: https://en.wikipedia.org/wiki/Iranshahr,_Iran
- 23. Devlin N, Parkin D, Janssen B. An introduction to EQ-5D instruments and their applications. In: Devlin N, Parkin D, Janssen B, editors. Methods for analysing and reporting EQ-5D data. Cham: Springer; 2020. https://doi.org/10.1007/978-3-030-47622-9
- 24. Herdman M, Gudex C, Lloyd A, Janssen M, Kind P, Parkin D, et al. Development and preliminary testing of the new five-level version of EQ-5D (EQ-5D-5L). Qual Life Res 2011;20(10):1727-1736. https://doi.org/10.1007/s11136-011-9903-xArticlePubMedPMC
- 25. Schwarz G. Estimating the dimension of a model. Ann Stat 1978;6(2):461-464. https://doi.org/10.1214/aos/1176344136Article
- 26. Sclove SL. Application of model-selection criteria to some problems in multivariate analysis. Psychometrika 1987;52: 333-343. https://doi.org/10.1007/BF02294360Article
- 27. Nylund KL, Asparouhov T, Muthén BO. Deciding on the number of classes in latent class analysis and growth mixture modeling: a Monte Carlo simulation study. Struct Equ Modeling 2007;14(4):535-569. https://doi.org/10.1080/10705510701575396Article
- 28. Armstrong G, Nuken A, Samson L, Singh S, Jorm AF, Kermode M. Quality of life, depression, anxiety and suicidal ideation among men who inject drugs in Delhi, India. BMC Psychiatry 2013;13: 151. https://doi.org/10.1186/1471-244X-13-151ArticlePubMedPMC
- 29. Roshanfekr P, Khezri M, Karimi SE, Vameghi M, Ali D, Ahmadi S, et al. Lifetime and past-month substance use and injection among street-based female sex workers in Iran. Harm Reduct J 2021;18(1):33. https://doi.org/10.1186/s12954-021-00477-5ArticlePubMedPMC
- 30. Vasylyev M, Davtyan H, Denisiuk O, Chadwick Jayaraj J, Koval T, Piddubna A, et al. Anxiety, depression, and quality of life among HIV positive injection drug users in Ukraine, 2017. J Infect Dev Ctries 2019;13(7.1):111S-117S. https://doi.org/10.3855/jidc.11295ArticlePubMed
- 31. Bielińska A, Wa Ż P, Bielińska-Wa Ż D. A computational model of similarity analysis in quality of life research: an example of studies in Poland. Life (Basel) 2022;12(1):56. https://doi.org/10.3390/life12010056ArticlePubMedPMC
- 32. Korthuis PT, Zephyrin LC, Fleishman JA, Saha S, Josephs JS, McGrath MM, et al. Health-related quality of life in HIV-infected patients: the role of substance use. AIDS Patient Care STDS 2008;22(11):859-867. https://doi.org/10.1089/apc.2008.0005ArticlePubMedPMC
- 33. Nikoo Seresht Z, Rimaz S, Nedjat S, Motevallian SA, Saeepour N. The relationship between quality of life and social capital amongst people living with HIV/AIDS attending the Imam Khomeini hospital consultation center for clients with risky behaviors in Tehran–2011. J Sch Public Health Inst Public Health Res 2011;11(3):17-28. (Persian)
- 34. Yen YF, Chou P, Lin YS, Deng CY. Factors associated with healthrelated quality of life among injection drug users at methadone clinics in Taipei, Taiwan. J Chin Med Assoc 2015;78(5):292-298. https://doi.org/10.1016/j.jcma.2015.01.001ArticlePubMed
- 35. Préau M, Protopopescu C, Spire B, Sobel A, Dellamonica P, Moatti JP. Health related quality of life among both current and former injection drug users who are HIV-infected. Drug Alcohol Depend 2007;86(2-3):175-182. https://doi.org/10.1016/j.drugalcdep.2006.06.012ArticlePubMed
- 36. Fischer JA, Conrad S, Clavarino AM, Kemp R, Najman JM. Quality of life of people who inject drugs: characteristics and comparisons with other population samples. Qual Life Res 2013;22(8):2113-2121. https://doi.org/10.1007/s11136-013-0350-8ArticlePubMed
- 37. Costenbader EC, Zule WA, Coomes CM. The impact of illicit drug use and harmful drinking on quality of life among injection drug users at high risk for hepatitis C infection. Drug Alcohol Depend 2007;89(2-3):251-258. https://doi.org/10.1016/j.drugalcdep.2007.01.006ArticlePubMedPMC
 PubReader
 ePub Link
 Cite
Cite

