
Articles
- Page Path
- HOME > J Prev Med Public Health > Volume 53(2); 2020 > Article
-
Original Article
Role of Information and Communication Technology and Women’s Empowerment in Contraceptive Discontinuation in Indonesia -
Omas Bulan Samosir
 , Ayke Soraya Kiting, Flora Aninditya
 -
Journal of Preventive Medicine and Public Health 2020;53(2):117-125.
DOI: https://doi.org/10.3961/jpmph.19.300
Published online: February 12, 2020
Lembaga Demografi, Faculty of Economics and Business, Universitas Indonesia, Depok, Indonesia
- Corresponding author: Omas Bulan Samosir, PhD Lembaga Demografi, Faculty of Economics and Business, Universitas Indonesia. Nathanael Iskandar Building, Depok 16424, Indonesia E-mail: omasbr@yahoo.co.uk
Copyright © 2020 The Korean Society for Preventive Medicine
This is an Open Access article distributed under the terms of the Creative Commons Attribution Non-Commercial License (http://creativecommons.org/licenses/by-nc/4.0/) which permits unrestricted non-commercial use, distribution, and reproduction in any medium, provided the original work is properly cited.
ABSTRACT
-
Objectives
- This study investigated the role of information and communication technology and women’s empowerment in contraceptive discontinuation in Indonesia.
-
Methods
- The study used data from the 2017 Indonesia Demographic and Health Survey and monthly contraceptive calendar data. A Gompertz proportional hazards model was used for analysis.
-
Results
- The 12-month contraceptive discontinuation rate was higher among women who had used the Internet in the past year, women who were mobile phone owners, and women who reported having fully participated in household decision-making than among their counterparts. These factors significantly impacted the risk of contraceptive discontinuation in Indonesia, even after controlling for contraceptive method, age, parity, contraceptive intent, education, work status, place of residence, and wealth status.
-
Conclusions
- After adjustment for the control variables, a higher risk of contraceptive discontinuation was associated with having used the Internet in the past year, owning a mobile phone, and not participating in household decision-making. Higher contraceptive discontinuation risk was also associated with using contraceptive pills, older age, lower parity, intent of spacing births, more education, current unemployment, and rural residence, and the risk was also significantly higher for those in the lowest household wealth quintile than for those in the fourth household wealth quintile. The association of contraceptive discontinuation with the use of modern information and communication technology and relatively disempowerment in household decision-making may imply that information regarding family planning and contraception should be conveyed via social media as part of setting up an eHealth system. This must include a strong communication strategy to empower and educate women in contraceptive decision-making.
- After a period of fertility decline between 1971 and 2000, the fertility rate in Indonesia stalled between 2000 and 2015. The results of the 2002-2003, 2007, and 2012 Indonesia Demographic and Health Surveys (DHS) showed that the country’s total fertility rate was stagnant at 2.6 children per woman. This stalling has been attributed in part to a steady increase in contraceptive discontinuation rates.
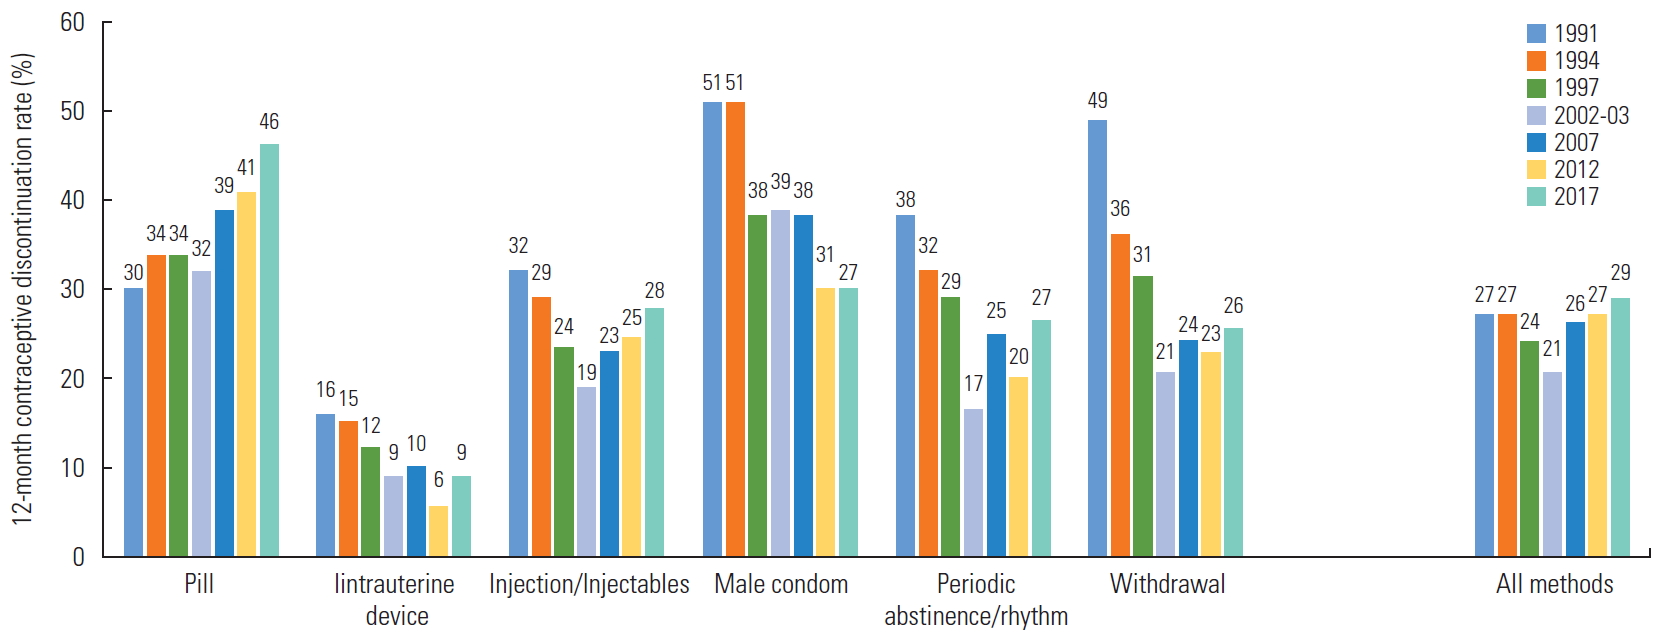
- As Figure 1 [1-7] shows, the overall 12-month contraceptive discontinuation rate increased gradually from 2002-2003 to 2017. This increase appears to have been driven by an increase in the discontinuation of contraceptive pills, while the discontinuation of most other methods has decreased or shown little change. In 2017, 12% of women were currently using pills as a contraceptive method, making pills the second-most used method reported in the DHS survey, after injectable contraceptives [7].
- Some studies have been conducted on factors correlated with contraceptive discontinuation in Indonesia [8-14]. These studies found that the causes of contraceptive discontinuation in Indonesia included the type of contraception, age, parity, contraceptive intent, exposure to mass media, level of education, place of residence, wealth status, and work status.
- However, in the 2010s, socioeconomic and developmental patterns in Indonesia changed meaningfully compared with earlier years, particularly regarding increasing Internet use and mobile phone ownership. Approximately half of married women of reproductive age used the Internet in the 12 months prior to the 2017 DHS survey, and almost 4 in 5 women owned a mobile phone [7]. Media exposure via the Internet and mobile phones can influence reproductive health behaviors [15,16], including contraceptive discontinuation. Nevertheless, few studies have examined the effects of Internet use and mobile phone ownership on contraceptive discontinuation.
- Indonesia has also experienced a marked improvement in women’s empowerment, as measured by the reduction of the country’s gender inequality index. The United Nations Development Program reported that Indonesia’s gender inequality index declined from 0.500 in 2013 to 0.453 in 2018 [17,18]. Specifically, the 2017 Indonesia DHS indicated that around 7 in 10 women of reproductive age in Indonesia contributed to making decisions about their own healthcare, main household purchases, and visits to family or relatives. However, the effects of women’s empowerment on contraceptive discontinuation have been less well-investigated.
- Therefore, there is a need to re-examine factors correlated with contraceptive discontinuation in Indonesia. In general, this study aimed to investigate the impacts of information and communication technology and women’s empowerment on contraceptive discontinuation in Indonesia. More specifically, it sought to examine differences in contraceptive discontinuation by Internet use, mobile phone ownership, and women’s participation in decision-making and to assess the effects of these factors on contraceptive discontinuation in Indonesia after controlling for contraceptive method, age, parity, contraceptive intent, education, work status, place of residence, and wealth status. Understanding the impact of information and communication technology and women’s empowerment on contraceptive discontinuation may help guide the formulation of policies to reduce contraceptive discontinuation in Indonesia.
INTRODUCTION
- Data
- The data used in this study were obtained from the 2017 Indonesia DHS. The data were weighted to account for sampling probability and non-response so that the results were nationally representative of women in union aged 15-49 and adjusted to account for the complex survey design and robust standard errors. The unit of analysis was the episode of contraceptive use, defined as a period of continuous use of a contraception method. Accordingly, DHS monthly calendar data were used in the analysis.
- Contraceptive discontinuation can be defined as initiating and later terminating contraceptive use for any reason while an unplanned pregnancy is still possible [19]. In the DHS, the contraceptive discontinuation rate is defined as the percentage of episodes of contraceptive use discontinued within 12 months among women aged 15-49 who experienced such an episode within the 5 years preceding the survey. This rate is further subclassified by the reason for discontinuation and the specific contraceptive method. The analysis included 25 930 contraceptive use episodes of 17 784 women in union aged 15-49.
- Variables
- The outcome variable in this study was the duration of the risk period prior to the occurrence of contraceptive discontinuation. Therefore, it was subject to non-response in the sample due to right censoring, since the complete durations of the episodes that were still ongoing at the end of the observation period were unknown.
- The main independent variables were Internet use, mobile phone ownership, and women’s participation in decision-making. Internet use referred to any use of the Internet in the prior year (yes or no). Mobile phone ownership was defined as whether the woman owned a mobile phone at the time of the survey (yes or no). Women’s participation in decision-making referred to whether the woman reported participating in household decision-making (no participation, partial participation, or full participation).
- The control variables included method-related, demographic, and socioeconomic factors. The only method-related variable was the discontinued contraceptive method (pill, intrauterine device [IUD], injectable contraceptive, implant, condom, or traditional method [periodic abstinence or withdrawal]). The demographic variables were age, parity, and contraceptive intent. Age was defined as the woman’s age at the start of the contraceptive episode in years. Parity was the number of living children at the end of the episode, as the parity could change during the episode due to child death. Contraceptive intent referred to whether the contraceptive episode was intended to space or to limit births [12].
- Socioeconomic variables included education, work status, place of residence, and wealth status. Education was defined as the years of education attained at the time of the survey. Work status included 2 options: currently not employed or currently employed at the time of the survey. Place of residence at the time of the survey was considered either urban or rural. Wealth status was reflected by household wealth index quintile at the time of the survey: lowest, second, middle, fourth, or highest.
- Statistical Analysis
- The data were analyzed using Stata version 15 (StataCorp., College Station, TX, USA). Univariate analysis was used to assess the percentage distribution of ever-use of the Internet, mobile phone ownership, and women’s participation in decision-making as well as method-related, demographic, and socioeconomic characteristics. Bivariate analysis was carried out by estimating the 12-month contraceptive discontinuation rate using the life table technique, which was then assessed by ever-use of the Internet, mobile phone ownership, and women’s participation in decision-making and by method-related, demographic, and socioeconomic factors.
- Inferential analysis of the impact of ever-use of the Internet, mobile phone ownership, and women’s participation in decision-making on contraceptive discontinuation in Indonesia after controlling for method-related, demographic, and socioeconomic factors was performed using survival analysis. A primary advantage of survival analysis for the analysis of duration data is its capability to deal with censored observations [20, 21]. A Gompertz proportional hazards model was employed, since its Akaike information criterion and Bayesian information criterion are low and since this model has been found to accurately represent the contraceptive discontinuation process [22]. Gompertz hazards models are fully parametric and are estimated using maximum likelihood procedures. Use of such models is based on the assumption that hazards are proportional across groups [23,24].
- The hazard model used in the present study included everuse of the Internet, mobile phone ownership, and women’s participation in household decision-making as main covariates and the control variables—contraceptive method, age, parity, contraceptive intent, years of education, work status, place of residence, and wealth status—as covariates.
- Ethics Statement
- The 2017 Indonesia DHS follows the Standard DHS survey protocol under the Demographic and Health Surveys Program (DHS-7) that was approved by the Institutional Review Board of International Classification of Functioning, Disability and Health and complied with the United States Department of Health and Human Services requirements for the “Protection of Human Subjects” (45 CFR 46).
METHODS
- Characteristics of Women
- Table 1 presents the percentage distribution of contraceptive use episodes in the 5 years prior to the survey. These episodes tended to occur in women who had not used the Internet in the past year, in mobile phone owners, and in those who fully participated in household decision-making. In addition, such episodes were relatively common in women who used injectable contraceptives, who were aged 25-34, who had 2 or 3 children at the end of an episode, whose contraceptive intent was spacing of births, who had 6-12 years of education, who were currently employed, and who lived in rural areas. In addition, the results of the correlation analysis showed that women who had ever used the Internet, who owned a mobile phone, and who fully participated in household decision-making tended to be better educated, employed, wealthier, and urban dwellers.
- Differences in Contraceptive Discontinuation
- The results showed that nearly 3 in 10 episodes of contraceptive use were discontinued within 12 months (Table 1). The 12-month contraceptive discontinuation rate differed by ever-use of the Internet, mobile phone ownership, and women’s participation in decision-making, as well as by contraceptive method and demographic, socioeconomic, and cultural factors. The discontinuation rate was higher among women who had used the Internet in the past year, women who owned a mobile phone, and women who reported participating in household decision-making, whether fully or partially, than among their counterparts. In addition, it was relatively high among women who were aged 15-24 at the start of the contraceptive episode, women who had no children or 1 child at the end of the episode, those who intended to space births, those with more than 12 years of education, those who were currently employed, urban dwellers, and the relatively wealthy.
- Effects of Information and Communication Technology and Women’s Empowerment on Contraceptive Discontinuation
- Table 2 shows the results of the Gompertz hazard model (hazard ratio) for the effects of ever-use of the Internet, mobile phone ownership, and women’s participation in decisionmaking on contraceptive discontinuation in Indonesia after controlling for contraceptive method, age, parity, contraceptive intent, education, work status, place of residence, and wealth status. Ever-use of the Internet, mobile phone ownership, and women’s participation in decision-making had statistically significant effects on the risk of contraceptive discontinuation. In addition, all control variables significantly influenced the risk of discontinuing contraception. The shape parameter was negative (-0.012), implying a decreasing risk of contraceptive discontinuation over time.
- The results of this study indicated that women who had used the Internet in the year prior to the survey had a higher risk of contraceptive discontinuation than women who did not. Owning a mobile phone was also associated with a higher risk of discontinuing contraception. Furthermore, partial or full participation in household decision-making was associated with a lower risk of abandoning a contraceptive episode than no participation in household decision-making.
- Control factors were also found to significantly influence the risk of contraceptive discontinuation. Users of IUDs, injectable contraceptives, implants, male condoms, and traditional methods (periodic abstinence or withdrawal) were at a lower risk of discontinuing contraception than users of contraceptive pills. Meanwhile, each 1-year increase in the woman’s age at the start of an episode was found to increase the risk of contraceptive discontinuation, while an increase of 1 child in a woman’s number of living children at the end of an episode reduced the hazard of contraceptive discontinuation. Women who used contraception to limit births were at lower risk of ending a contraceptive episode than those who used it to space births.
- Furthermore, each 1-year increase in education increased the risk of contraceptive discontinuation. Women who were currently employed were at lower risk of discontinuing contraception than women who were unemployed. Urban women had a lower risk of contraceptive discontinuation than rural women, and women in the fourth household wealth quintile had a lower risk of discontinuation than women in the lowest wealth quintile.
RESULTS
- The fact that episodes of contraceptive use predominantly occurred in women who were mobile phone owners and in those who fully participated in household decision-making, as well as the fact that almost half of episodes occurred in women who had access to the Internet, may indicate that Indonesian women have greater opportunities and choices than they had previously. Ever-use of the Internet and ownership of a mobile phone were associated with higher risk of contraceptive discontinuation, perhaps because these instruments of information and communication may allow women to find information on family planning services that can help them handle problems with contraception.
- In addition, women who were empowered—that is, who reported being partial or full participants in household decision-making—were at a relatively low risk of discontinuing contraception. This is inconsistent with the finding of the bivariate analysis presented in Table 1 that showed a higher 12-month contraceptive discontinuation rate in empowered women than in disempowered women, most likely because more empowered women also tended to be more educated. However, all else being equal, empowered women may be more determined than disempowered women to maintain contraception in order to avoid unintended pregnancy. This finding also supports the results of previous studies [25-27] that have shown the importance of women’s empowerment in the use of maternal and child health services.
- Regarding the factors that were controlled, the results of this study generally align with past analyses [8-14,28,29]. We found that contraceptive method was strongly associated with contraceptive discontinuation risk in Indonesia, as women were at a higher risk of discontinuing pill-based contraceptives than other methods. This may be because the pill is much easier than other methods to abandon when women experience side effects and have health concerns, particularly compared with long-term methods, such as IUDs and implants that must be removed by trained medical personnel. This result supports the findings of another study that was conducted in Indonesia [12].
- The present study indicated that parity was negatively associated with the risk of discontinuing contraception. This is expected, as women with more children have more motivation to avoid unwanted pregnancy in order to maintain their preferred number of children. This finding is consistent with the results of studies in Indonesia [12], Senegal [28], and Ghana [29].
- Using contraception to limit births was associated with a lower risk of contraceptive discontinuation. Women who limit births may feel more pressure to avoid unwanted pregnancy than women who space births, and consequently may be less likely to discontinue contraceptive use. This finding supports studies in Indonesia [10,12] that found a lower risk of contraceptive discontinuation among women who limited births.
- A higher risk of contraceptive discontinuation was found to be associated with higher education levels among women. This might be because more educated women are generally more informed and have better access to family planning information and services, enabling them to switch contraceptive methods more easily. This result is consistent with the results of a study in Indonesia [12] that found a higher rate of contraceptive switching among more educated women.
- A higher risk of discontinuing contraception was strongly associated with older age and unemployed status, while lower risk was associated with urban residence and higher wealth. This was inconsistent with the findings of the bivariate analysis, probably because older women were more likely to limit births, unemployed women tended to be younger, and urban and wealthier women tended to be more empowered. Older women were more likely to abandon contraception, perhaps because they feel they are less fertile and have lower risk of unintended pregnancy. This result is consistent with the results of a study conducted in Senegal [28]. Meanwhile, unemployed women might be under less pressure to prevent unwanted pregnancy than employed women and hence are more likely to discontinue contraception than women who are currently employed, as found in another study in Indonesia [11] that reported a lower risk of discontinuing contraception among women who had worked during the past year. Furthermore, urban and wealthier women may also have better access to family planning services and information, in particular family planning counseling services, to support and maintain their contraceptive use. This finding supports the results of studies in Indonesia [11,12] that found a lower risk of discontinuing contraception among urban and relatively wealthy women.
- The results of this study confirm the significance of the impact of information and communication technology and women’s empowerment on contraceptive discontinuation, even after controlling for demographic and socioeconomic factors. The risk of discontinuing contraception was relatively high among women who had used the Internet in the past year, those who owned a mobile phone, and those who did not participate in household decision-making. In addition, a higher risk of discontinuing contraception was associated with the use of contraceptive pills, older age, lower parity, intent of spacing births, more years of education, unemployed status, and rural residence.
- The findings from this study present guidance crucial for improving family planning services in Indonesia in order to reduce unnecessary and unintentional contraceptive discontinuation. Information regarding family planning and contraception should be conveyed via social media as part of instituting an eHealth system. Formulating strong and cost-effective communication policies to empower and educate women on contraceptive decision-making is imperative, as both the national and sub-national governments face budget limitations in this area.
- The relatively high rate of contraceptive discontinuation among those using contraceptive pills may suggest the need for improved counseling, more effective communication about contraceptive methods, and improvements in contraceptive technology. Women should be enabled to discuss potential side effects or health concerns associated with contraceptive use. Additionally, the number of contraceptive methods available should be increased to allow women to switch promptly to suitable methods.
- Limitations
- A limitation of this study is that the analysis of contraceptive discontinuation risk extended over the 3-month to 62-month period prior to the survey, but some independent variables were not time-varying. For example, use of the Internet in the past year, mobile phone ownership at the time of the study, and the usual level of participation of women in household decision-making at the time of the survey were used as proxies of ever-use of the Internet, mobile phone ownership, and participation in household decision-making over the 5 years preceding the survey. We assumed that women who had used the Internet in the past year, who owned a mobile phone at the time of the survey, and who reported usually participating in household decision-making at the time of the survey were more likely to have ever used the Internet, to have owned a mobile phone, and to have usually participated in household decision-making in the past. Therefore, this limitation should not meaningfully affect the findings, and this study still makes an important contribution to the study of contraceptive discontinuation. In addition, this limitation indicates that time-varying socioeconomic independent variables should be made available and employed in future contraceptive discontinuation studies.
DISCUSSION
-
CONFLICT OF INTEREST
The authors have no conflicts of interest associated with the material presented in this paper.
-
FUNDING
This work was supported by the United States Agency for International Development (USAID), which provided for funding for thise research project through the Demographic and Health Surveys Program (#720-OAA-18C-00083).
Notes
ACKNOWLEDGEMENTS
-
AUTHOR CONTRIBUTIONS
Conceptualization: OBS. Data curation: OBS, ASK, FA. Formal analysis: OBS, ASK, FA. Funding acquisition: OBS. Methodology: OBS, ASK, FA. Project administration: OBS. Visualization: OBS, ASK, FA. Writing - original draft: OBS, ASK, FA. Writing - review & editing: OBS, ASK, FA.
Notes
- 1. Indonesia Central Bureau of Statistics. Demographic and Health Survey 1991. [cited 2019 Oct 1]. Available from: https://datacatalog.worldbank.org/dataset/indonesia-demographic-and-health-survey-1991
- 2. Indonesia Central Bureau of Statistics. Demographic and Health Survey 1994. [cited 2019 Oct 1]. Available from: https://datacatalog.worldbank.org/dataset/indonesia-demographic-and-health-survey-1994
- 3. Indonesia Central Bureau of Statistics. Demographic and Health Survey 1997. [cited 2019 Oct 1]. Available from: https://datacatalog.worldbank.org/dataset/indonesia-demographic-and-health-survey-1997
- 4. Indonesia Central Bureau of Statistics. Demographic and Health Survey 2002-2003. [cited 2019 Oct 1]. Available from: https://datacatalog.worldbank.org/dataset/indonesia-demographic-and-health-survey-2002-2003
- 5. Indonesia Central Bureau of Statistics. Demographic and Health Survey 2007. [cited 2019 Oct 1]. Available from: https://datacatalog.worldbank.org/dataset/indonesia-demographic-and-health-survey-2007
- 6. Indonesia Central Bureau of Statistics. Demographic and Health Survey 2012. [cited 2019 Oct 1]. Available from: https://datacatalog.worldbank.org/dataset/indonesia-demographic-and-health-survey-2012
- 7. Indonesia Central Bureau of Statistics. Demographic and Health Survey 2017. [cited 2019 Oct 1]. Available from: https://datacatalog.worldbank.org/dataset/indonesia-demographic-and-health-survey-2017
- 8. Ali MM, Cleland JG, Shah IH; World Health Organization. Causes and consequences of contraceptive discontinuation: evidence from 60 demographic and health surveys. 2012 [cited 2020 Feb 10]. Available from: https://apps.who.int/iris/handle/10665/75429
- 9. Amran Y, Nasir NM, Dachlia D, Yelda F, Utomo B, Ariawan I, et al. Perceptions of contraception and patterns of switching contraceptive methods among family-planning acceptors in West Nusa Tenggara, Indonesia. J Prev Med Public Health 2019;52(4):258-264ArticlePubMedPMCPDF
- 10. Arifin EN. Factors associated with contraceptive discontinuation in Bali, Indonesia: a multilevel discrete-time competing risks hazard model. 2003 [cited 2020 Feb 10]. Available from: https://pdfs.semanticscholar.org/1ed5/737d17c440628231a9b9035df9ee5e30a3cd.pdf
- 11. Bradley SE, Hilary MS, Shane K. Levels, trends, and reasons for contraceptive discontinuation. BDHS analytical studies No. 20 [cited 2020 Feb 12]. Available from: https://www.dhsprogram.com/pubs/pdf/AS20/AS20.pdf
- 12. Curtis SL, Ann KB. Determinants of contraceptive failure, switching, and discontinuation: an analysis of DHS contraceptive histories. DHS analytical reports No. 6 [cited 2020 Feb 10]. Available from: https://www.dhsprogram.com/publications/publication-ar6-analytical-studies.cfm
- 13. Fathonah S. Patterns of contraceptive use in Indonesia. DHS further analysis reports No. 30 [cited 2020 Feb 12]. Available from: https://dhsprogram.com/publications/publication-fa30-further-analysis.cfm
- 14. Samosir OB. Contraceptive use in Indonesia. [dissertation]. Southampton: University of Southampton; 1994
- 15. Lou CH, Zhao Q, Gao ES, Shah IH. Can the Internet be used effectively to provide sex education to young people in China? J Adolesc Health 2006;39(5):720-728ArticlePubMed
- 16. Greenleaf AR, Ahmed S, Moreau C, Guiella G, Choi Y. Cell phone ownership and modern contraceptive use in Burkina Faso: implications for research and interventions using mobile technology. Contraception 2019;99(3):170-174ArticlePubMedPMC
- 17. United Nations Development Programme (UNDP). Human development report 2014. Sustaining human progress: reducing vulnerabilities and building resilience. [cited 2020 Feb 12]. Available from: http://hdr.undp.org/sites/default/files/hdr14-report-en-1.pdf
- 18. United Nations Development Programme. Human development indices and indicators: 2018 statistical update. [cited 2020 Feb 12]. Available from: http://hdr.undp.org/sites/default/files/2018_human_development_statistical_update.pdfArticle
- 19. Castle S, Askew I. Contraceptive discontinuation: reasons, challenges, and solutions. 2015 [cited 2020 Feb 12]. Available from: http://ec2-54-210-230-186.compute-1.amazonaws.com/wp-content/uploads/2015/12/FP2020_Contraceptive-Discontinuation_SinglePage_Final_12.08.15.pdf
- 20. Kleinbaum DG, Klein M. Survival analysis: a self-learning text statistics for biology and health. 2nd ed. New York: Springer; 2005. p. 2
- 21. Yamaguchi K. Event history analysis. London: Sage Publication; 1991. p. 3
- 22. MacQuarrie KL, Bradley SE, Gemmill A, Staveteig S. Contraceptive dynamics following HIV testing: DHS analytical studies No. 47. 2014 [cited 2020 Feb 12]. Available from: https://dhsprogram.com/pubs/pdf/AS47/AS47.pdf
- 23. Allison PD. Survival analysis using SAS: a practical guide. Cary: SAS Institute; 1995. p. 21
- 24. Cleves M, Gould W, Gould WW, Gutierrez R, Marchenko Y. An introduction to survival analysis using Stata. 3rd ed. College Station: Stata Press; 2010. p. 232-234
- 25. Ahmed S, Creanga AA, Gillespie DG, Tsui AO. Economic status, education and empowerment: implications for maternal health service utilization in developing countries. PLoS One 2010;5(6):e11190ArticlePubMedPMC
- 26. Corroon M, Speizer IS, Fotso JC, Akiode A, Saad A, Calhoun L, et al. The role of gender empowerment on reproductive health outcomes in urban Nigeria. Matern Child Health J 2014;18(1):307-315ArticlePubMedPMCPDF
- 27. Sebayang SK, Efendi F, Astutik E. Women’s empowerment and the use of antenatal care services in Southeast Asian countries. 2017 [cited 2020 Feb 12]. Available from: https://www.dhsprogram.com/pubs/pdf/WP129/WP129.pdf
- 28. Barden-O’Fallon J, Speizer IS, Calhoun LM, Corroon M. Women’s contraceptive discontinuation and switching behavior in urban Senegal, 2010-2015. BMC Womens Health 2018;18(1):35ArticlePubMedPMCPDF
- 29. Parr NJ. Discontinuation of contraceptive use in Ghana. J Health Popul Nutr 2003;21(2):150-157PubMed
REFERENCES
Figure & Data
References
Citations
- Contraceptive switch and abandonment among women using the pill, condoms and injectables in Brazil
Christiane Borges do Nascimento Chofakian, Ana Luiza Vilela Borges
The European Journal of Contraception & Reproductive Health Care.2024; 29(1): 15. CrossRef - Early discontinuation of long-acting reversible contraceptives methods and its associated factors in Hosanna town, central Ethiopia: a cross-sectional study
Amanuel Defar Bande, Tilahun Bayene Handiso, Habtamu Wude Hanjelo, Belayneh Hamdela Jena
Scientific Reports.2024;[Epub] CrossRef - Prevalence of discontinuation of contraceptives due to failure among women aged 14 to 49 years in Uganda: a nation wide cross-sectional survey
Ruth Ketty Kisuza, Saviour Kicaber, Derrick Bary Abila, Felix Bongomin, Christopher Orach Garimoi
Contraception and Reproductive Medicine.2023;[Epub] CrossRef - The Nexus between Economic Features and Contraceptive Switching in Indonesia
Wilson Rajagukguk, Fajar Lamhot Gultom, Muhammad Alfarabi
Balkan Journal of Interdisciplinary Research.2023; 9(3): 33. CrossRef - Predicting COVID-19 health behaviour initiation, consistency, interruptions and discontinuation among social media users in Nigeria
Eke Kalu Oyeoku, Felix Olajide Talabi, David Oloyede, Aiyesimoju Ayodeji Boluwatife, Verlumun Celestine Gever, Ibe Ebere
Health Promotion International.2022;[Epub] CrossRef - Does Digital Literacy Empower Adolescent Girls in Low- and Middle-Income Countries: A Systematic Review
Salima Meherali, Komal Abdul Rahim, Sandra Campbell, Zohra S. Lassi
Frontiers in Public Health.2021;[Epub] CrossRef - Pattern and Determinant of Contraceptive Use among Women in Indonesia from 2007 to 2017: Evidence from Demographic and Health Survey
Desy Nuri Fajarningtiyas, Dedik Sulistiawan, Margareth Maya Parulianta Naibaho, Riza Fatma Arifa
Open Access Macedonian Journal of Medical Sciences.2021; 9(E): 1363. CrossRef
 PubReader
 ePub Link
 Cite
Cite

