
Articles
- Page Path
- HOME > J Prev Med Public Health > Volume 51(4); 2018 > Article
-
Original Article
Urinary Mercury Levels Among Workers in E-waste Shops in Nakhon Si Thammarat Province, Thailand -
Somsiri Decharat

-
Journal of Preventive Medicine and Public Health 2018;51(4):196-204.
DOI: https://doi.org/10.3961/jpmph.18.049
Published online: June 19, 2018
- 7,821 Views
- 177 Download
- 16 Crossref
Department of Occupational Health and Safety, Faculty of Health and Sports Science, Thaksin University, Phatthalung, Thailand
- Corresponding author: Somsiri Decharat, PhD Department of Occupational Health and Safety, Faculty of Health and Sports Science, Thaksin University, 222 Moo 2 Papayom District, Phatthalung 93210, Thailand E-mail: somsiri_9@hotmail.com
• Received: February 21, 2018 • Accepted: June 8, 2018
Copyright © 2018 The Korean Society for Preventive Medicine
This is an Open Access article distributed under the terms of the Creative Commons Attribution Non-Commercial License (http://creativecommons.org/licenses/by-nc/4.0/) which permits unrestricted non-commercial use, distribution, and reproduction in any medium, provided the original work is properly cited.
ABSTRACT
-
Objectives
- To determine urinary mercury levels in e-waste workers in Southern Thailand and the airborne mercury levels in the e-waste shops where they worked, to describe the associations between urinary and airborne mercury levels, and to evaluate the prevalence of mercury exposure-related health effects among e-waste workers.
-
Methods
- A cross-sectional study was conducted by interviewing 79 workers in 25 e-waste shops who lived in Nakhon Si Thammarat Province, Thailand. Information on general and occupational characteristics, personal protective equipment use, and personal hygiene was collected by questionnaire. Urine samples were collected to determine mercury levels using a cold-vapor atomic absorption spectrometer mercury analyzer.
-
Results
- The e-waste workers’ urinary mercury levels were 11.60±5.23 μg/g creatinine (range, 2.00 to 26.00 μg/g creatinine) and the mean airborne mercury levels were 17.00±0.50 μg/m3 (range, 3.00 to 29.00 μg/m3). The urinary and airborne mercury levels were significantly correlated (r=0.552, p<0.001). The prevalence of self-reported symptoms was 46.8% for insomnia, 36.7% for muscle atrophy, 24.1% for weakness, and 20.3% for headaches.
-
Conclusions
- Personal hygiene was found to be an important protective factor, and should therefore be stressed in educational programs. Employers should implement engineering measures to reduce urinary mercury levels and the prevalence of associated health symptoms among e-waste workers.
- Electronic waste, or e-waste, can be defined as discarded computers, electronic office equipment, electronic entertainment devices, mobile phones, television sets, and refrigerators [1]. An estimated 50 million tons of e-waste are produced each year [2]. In the US, 30 million computers are discarded each year, and 100 million phones are disposed of in Europe annually. The Environmental Protection Agency has estimated that only 15-20% of e-waste is recycled, while the rest of these electronics go directly into landfills and incinerators [3]. Thailand is a developing country that faces e-waste problems due to a lack of appropriate technologies, facilities, and resources, as well as gaps in e-waste regulations causing the illegal importation of e-waste for dismantling and recycling purposes [4-8]. Substances found in e-waste include epoxy resins, fiberglass, polychlorinated biphenyls, polyvinyl chlorides, thermosetting plastics, lead, tin, copper, silicon, beryllium, carbon, iron, aluminum, cadmium, mercury, and thallium [8]. Mercury can be found in fluorescent tubes (numerous applications), tilt switches (mechanical doorbells, thermostats) [3], and flat-screen monitors. Toxic substances in e-waste can be released into the environment, ending up in bodies of water, groundwater, soil, and air. This can impact the health of land and sea animals, including humans [9-12]. Mercury exposure can lead to several adverse health effects, including sensory impairment, dermatitis, memory loss, and muscle weakness. Exposure in utero causes fetal deficits in motor function, attention, and verbal domains [13].
- For the purposes of this study, an e-waste shop was defined as a facility that engages in the refurbishment, dismantling, or recycling of e-waste. The objectives of this study were to determine urinary mercury levels in e-waste workers and the airborne mercury levels in the e-waste shops where they worked, to assess associations between urinary and airborne mercury levels, and to evaluate the prevalence of mercury exposure-related health effects among e-waste workers.
INTRODUCTION
- In this cross-sectional study, urinary mercury samples were collected from 79 e-waste workers who worked in 25 e-waste shops in Nakhon Si Thammarat Province, southern Thailand, from May to August 2016. This research was approved by the ethics committee of the Institute of Research and Development, Thaksin University (no. E001/2557).
- Study Population
- This study enrolled workers at e-waste shops with records of high levels of exposures; in total, 79 e-waste workers (25 office workers refer to the workers who worked in office area that low levels of exposure; and 54 worker in e-waste processes refer to the workers who worked in e-waste processes area that high levels exposure) were recruited from 25 e-waste shops in Nakhon Si Thammarat Province in southern Thailand. The inclusion criteria for the exposed group were: e-waste workers, aged 18-57 years, in occupational contact with e-waste, who had maintained that occupational contact for at least 1 year. Participants who agreed to take part in the study provided written informed consent. Of the 79 exposed subjects recruited, 47 were male and 32 were female.
- Questionnaires and Urine Sample Collection
- General information on the e-waste workers was collected by face-to-face interviews using a survey form, by a walk-through survey, and through on-site observations. The 79 ewaste workers were interviewed using a questionnaire. Detailed information was collected, including general and occupational characteristics, personal protective equipment (PPE) use, and personal hygiene. At the end of each shift, the subjects were interviewed about their general characteristics, including work-related factors. Spot urine samples (30 mL) were collected from the first urination in the morning, then kept in polypropylene sample vessels and stored at -20°C for analysis.
- Airborne Mercury Collection
- The dosimeter and hopcalite sampling devices were exposed side-by-side following step-by-step experimental procedures that have been previously described [14]. All samples were collected in the e-waste workers’ breathing zone according to the Occupational Safety and Health Administration analytical method. Each personal sampling pump was calibrated with a representative sampler, and the end of the sampler was broken off immediately prior to sampling. Samplers were attached to pumps with flexible tubing and air was collected at a rate of 0.15 to 0.25 L/min. Samplers were capped and packed securely for shipment. Hopcalite sorbent and the front glass wool plug from each sampler were placed in separate 50 mL volumetric flasks, and 2.5 mL of concentrated nitric acid followed by 2.5 mL of concentrated hydrogen chloride was added. The hopcalite sorbent was dissolved, diluted to 50 mL with deionized water, and the mercury concentration was then determined with cold-vapor atomic absorption spectroscopy.
- Laboratory Analysis
- Creatinine levels in urine were determined using the Jaffe’s reaction, in which creatinine produces an orange color after reaction with picric acid in alkaline medium [15]. After allowing an incubation time of 15 minutes at room temperature for color development, optical absorbance was measured at 520 nm.
- The method of measuring urinary mercury levels was modified from that of Ham [16]. A CETAC M6000A cold-vapor atomic absorption spectrometer (CETAC, Omaha, NE, USA) was used to measure urinary mercury levels. The instrumental parameters were a slit width of 0.5 μm, wavelength of 253.7 nm, photo multiplier tube of 4 mA, no background correction, and a delay time before reading of 55 or 70 seconds.
- Field water blank samples (10% of urine specimens) were frozen and shipped on dry ice as quality control for all analyses. These field blanks were analyzed for mercury using the same method. A series of standard additions containing 0, 10, 20, and 40 mg/dL were prepared. The correlation coefficient (r) between the mercury concentration in the authentic mercury solution and absorption was 0.9995. The overall limit of detection was 5 mg/g creatinine. External quality control (Lyphochek While Blood Metals Control; Bio-Rad, Hercules, CA, USA) and a 5 mg/L calibration range standard check were performed at the start and end of the analysis, and after every 10 samples. The accuracy of the overall method ranged from 96.8 and 98.8%, and the calculated precision was within an 8.0% relative standard deviation. The detection limit for mercury was 0.15 μg/L. The urinary mercury analysis required 0.2 mL of urine.
- Statistical Analysis
- Descriptive statistics were used to present the results of the urinary mercury tests. The means of normally distributed data groups were compared using the Student t-test. The Pearson test was used to investigate the association between airborne mercury levels and urinary mercury levels. Statistical significance was defined as p<0.05 and statistical analyses were performed using SPSS version 17 (SPSS Inc., Chicago, IL, USA).
METHODS
Measurement of urinary creatinine levels
Measurement of urinary mercury levels
Validation of urinary mercury analyses
- Demographic Characteristics of the Subjects
- The subjects of this study consisted of 79 e-waste workers in e-waste shops in Nakhon Si Thammarat Province, southern Thailand. The age range of the e-waste workers was 18-57 years (mean, 34.27 years). All workers were Buddhist. The majority had a secondary-school education or lower (67.1%), and nearly half were married (48.1%). The subjects consisted of 27 smokers (34.2%) and 52 non-smokers (65.8%), while 53.2% reported that they consumed alcohol. In this study, 59.5% of subjects consumed fish and seafood ≤3 times/mo, while 40.5% consumed fish and seafood >3 times/mo.
- Of all subjects, 57.0% worked more than 8 hours per day and 81.0% had a work duration of more than 6 years. Most subjects (73.4%) did not used cotton masks and 51.9% did not used gloves when contacting e-waste. Only 25.3% of them washed their hands before lunch, while 74.7% did not do so.
- The average urinary mercury levels of the e-waste workers were significantly different from those of 25 office workers refer to the workers who worked in office area that low levels of exposure; and 54 worker in e-waste processes refer to the workers who worked in e-waste processes area that high levels exposure that shown in study population (p<0.001). It was found that mean urinary mercury levels were significantly affected by characteristics such as smoking cigarettes, hours worked per day, duration of work, not using PPE, and not washing one’s hands before lunch (p<0.001) (Table 1).
- Non-smoking workers’ urinary mercury concentrations were significantly lower (β=-0.004, p<0.001) than those of their smoking counterparts. Those who consumed fish ≤3 times/mo had significantly lower urinary mercury concentrations than those who consumed fish >3 times/mo (β=0.024, p=0.016). Age and gender were not significant risk factors for urinary mercury concentrations (β=-0.008, p=0.875; β=-0.004, p=0.987, respectively). Smoking status appeared to be a confounder for age. Urinary mercury concentrations were positively correlated with the amount of fish consumed per month. Among the non-smokers, the office workers had lower urinary mercury concentrations than those who worked directly in ewaste processing (p<0.001).
- In the multivariate regression analysis, smoking cigarettes, hours worked per day, duration of work (years), not using a cotton mask, not washing one’s hands before lunch, and fish consumption were significant predictors of urinary mercury concentrations (Table 2).
- Correlation Between Air Mercury Levels and Urinary Mercury Levels
- The mean airborne mercury level was 17.00±0.50 μg/m3 (range, 3.00 to 29.00 μg/m3). The occupational exposure standard for mercury in the workplace atmosphere is 50 μg/m3 for 8 hr/d and 40 hr/wk, using time-weight averages [17]; none of the air samples exceeded this level. However, the mean airborne mercury levels were significantly lower in the office areas (10.82±0.34 μg/m3; range, 3.00 to 15.00 μg/m3) than in the working areas (25.24±0.21 μg/m3; range, 15.00 to 29.00 μg/m3). The mean urinary mercury concentration was 11.60±5.23 μg/g creatinine (range, 2.00 to 26.00 μg/g creatinine). In this study, the workers who worked in office areas (9.84±1.02 μg/g creatinine; range, 3.00 to 15.30 μg/g creatinine) had significantly lower urinary mercury concentrations than those who did not (19.26±3.02 μg/g creatinine; range, 15.00 to 29.00 μg/g creatinine). A significant correlation was found between the sampled airborne mercury levels and urinary mercury levels (r=0.552, p<0.001) (Figure 1).
- The prevalence of self-reported symptoms in the past 3 months is shown in Table 3. The most common symptom was insomnia (46.8%), followed by muscle atrophy (36.7%), weakness (24.1%), and headaches (20.3%).
- The relationships between position worked, gender, age, educational level, smoking, alcohol consumption, hours worked per day, duration of work, use of PPE, and personal hygiene (as independent variables) with the symptom rates for 4 selected symptoms (insomnia, muscle atrophy, weakness, and headaches) are shown in Table 4.
- The prevalence of insomnia was statistically significantly higher among subjects who worked in e-waste processing than among subjects who worked in an office environment (p<0.001). The education, gender, age, smoking, alcohol consumption, duration of work, mask use, and glove use were all significantly associated with increased insomnia at the level of p<0.001.
- The prevalence of muscle atrophy was statistically significantly higher among workers who worked in e-waste processing than among office workers (p<0.001). The following variables (gender, age, education, hours worked per day, mask use, glove use, and washing one’s hands before lunch) were also significantly associated with increased muscle atrophy at the level of p<0.001.
- The prevalence of weakness was statistically significantly higher among workers who worked in e-waste processing than among subjects who worked in the office (p<0.001). In addition, gender, age, education, and hours worked per day were significantly associated with weakness at the level of p<0.001.
- In addition, the prevalence of headaches was statistically significantly higher among workers who worked in e-waste processing than among office workers (p<0.001). The following variables (education, hours worked per day, duration of work, mask use, and washing one’s hands before lunch) were also significantly associated with headaches at the p<0.001 level.
RESULTS
Prevalence of health symptoms among the subjects
- Urinary mercury levels are commonly used as diagnostic measures and indicators of mercury exposure in humans [18]. The urinary mercury levels of the subject workers were all below the 35 μg/g creatinine biological exposure index recommended by the American Conference of Governmental Industrial Hygienists (ACGIH) [18]. Overall, 16.5% of the airborne mercury samples (13 of 79) exceeded the 25 μg/m3 threshold recommended by the ACGIH [18]. However, all samples were below the 50 μg/m3 time-weight average exposure index recommended by the Department of Labor Protection and Welfare of Thailand [17].
- This study agrees with the results of Babu et al. [19], who reported that the recycling process of e-waste may release mercury in its elemental vapor form into the environment. Workers who live at e-waste recycling sites may be exposed to both inorganic and organic mercury. The results of this study are also similar to those reported by Decharat [20] and Julander et al. [21], who found that garbage workers who had contact with solid waste were at a greater risk of exposure to mercury than those who were in other positions. This result is also consistent with the study of Needhidasan et al. [22], who reported that levels of hexavalent chromium, manganese, lead, and tin were significantly higher in workers at an e-waste recycling facility than in e-waste workers in a slum community. In contrast, the levels of cobalt, silver, cadmium, and mercury were significantly higher in the slum community workers than in the facility workers.
- Workers who worked more than 8 hours per day and had worked at the facilities for more than 6 years had significantly higher urinary mercury levels than their counterparts. This result is supported by the findings of Hansen and Danscher [23], who reported that long-term exposure to mercury and a lack of appropriate prevention may lead to an accumulation of mercury in workers’ bodies. The author noted that the e-waste workers were working in a poorly-ventilated, enclosed area without a mask and technical expertise, resulting in dangerous levels of exposure. This result is further supported by Jafari et al. [24], who also showed that when local and general ventilation systems were both on, the occupational exposure to oxide chemicals was below the threshold limit values (TLVs), but that exposure to respiratory dust at 2 welding stations and ozone levels at 3 welding stations were higher than the respective TLVs.
- Workers who used a mask and/or gloves had significantly lower urinary mercury levels than those who did not, and those who always washed their hands before lunch had significantly lower urinary mercury levels than those who sometimes did so. This highlights the benefits of good hygiene practices after handling e-waste. Workers must adhere to good personal hygiene, especially before eating, smoking, and when leaving the workplace, so that microorganisms and harmful chemicals are unable to be absorbed into their bodies or transmitted to another environment on the clothes of contaminated workers [25].
- Seafood was probably also a cause of elevated urinary mercury levels, which were significantly different in recycling workers and office workers [26].
- This study assessed health symptoms among e-waste workers. Health symptoms, including insomnia, muscle atrophy, weakness, and headaches, were significantly more prevalent among workers who were directly involved in e-waste processing than among other workers. The prevalence of insomnia in this study was consistent with the findings of Wilson [27], which reported the occurrence of certain symptoms, including insomnia, headaches, disturbances in sensations, and tremors among workers who had contact with e-waste. The health symptoms found in this study are similar to those described by Huo et al. [28], who reported that the prevalence rates of headache/vertigo (47.7%), itching (15.0%), nausea (11.1%), insomnia (9.7%), hypomnesia (5.3%), nasal obstruction (5.3%), and conjunctiva congestion (4.8%) in e-waste dismantlement workers were significantly higher than those in the control group. The period of time worked in an e-waste shop was statistically significantly associated with the prevalence of health symptoms among e-waste workers. This finding is also supported by the findings of Grant et al. [29], who showed that increases in spontaneous abortions, stillbirths, premature births, and reduced birth weight and birth length were associated with the length of exposure to e-waste.
- The use of PPE at work was also statistically significantly associated with the prevalence of health symptoms among ewaste workers. This finding is also supported by the results of Monika and Kishore [30], who reported that the majority of informal e-waste recyclers did not use any PPE to protect themselves from the dangerous toxins released by processing ewaste. This is also consistent with a study by the International Labor Organization [31], which reported that when the recycling process (cleaning, crushing, or heating parts) was carried out using bare hands and without the use of masks, the adverse health effects included sensory impairment, dermatitis, memory loss, and muscle weakness [10]. In the present study, the author noted that the types of PPE in use in these shops were inappropriate for this type of work. Mercury can accumulate on the surfaces of the PPE used by the e-waste workers. In addition, mercury can penetrate a cotton mask and enter a worker’s airway. E-waste workers using these inappropriate protective devices may mistakenly believe that they are protected.
- A limitation of this study is that our data did not contain information on amalgam restorations, although previous studies have shown significant associations between amalgam fillings and oral lesions, autoimmune disorders, multiple sclerosis [32], central nervous symptoms [33], and subfertility in females [34].
- In conclusion, personal hygiene is an important protective factor that should be stressed in educational programs. Employers should implement engineering measures to reduce urinary mercury levels and the prevalence of related health symptoms among e-waste workers.
DISCUSSION
ACKNOWLEDGEMENTS
-
CONFLICT OF INTEREST
The author has no conflicts of interest associated with the material presented in this paper.
Notes
Figure. 1.The correlation plot of airborne mercury levels versus e-waste workers’ urinary mercury levels.
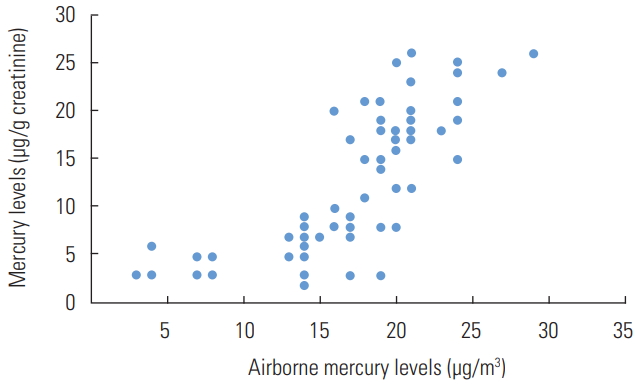
Table 1.Subject characteristics
Table 2.Univariate analysis for factors associated with work positions
Table 3.Prevalence of health symptoms during the preceding 3 months
Table 4.Prevalence of symptoms in the preceding 3 months
- 1. Wikipedia. Electronic waste. [cited 2017 Dec 12]. Available from: https://en.wikipedia.org/wiki/Electronic_waste
- 2. Sthiannopkao S, Wong MH. Handling e-waste in developed and developing countries: initiatives, practices, and consequences. Sci Total Environ 2013;463-464. 1147-1153ArticlePubMed
- 3. US Environmental Protection Agency. Statistics on the management of used and end-of-life electronics. 2012 [cited 2017 Dec 12]. Available from: https://twosidesna.org/US/u-s-environmental-protection-agency-epa-website-statistics-on-themanagement-of-used-and-end-of-life-electronics/
- 4. Wong CS, Duzgoren-Aydin NS, Aydin A, Wong MH. Evidence of excessive releases of metals from primitive e-waste processing in Guiyu, China. Environ Pollut 2007;148(1):62-72ArticlePubMed
- 5. Frazzoli C, Orisakwe OE, Dragone R, Mantovani A. Diagnostic health risk assessment of electronic waste on the general population in developing countries’ scenarios. Environ Impact Assess Rev 2010;30(6):388-399Article
- 6. Zhang S, Forssberg E. Mechanical separation-oriented characterization of electronic scrap. Resour Conserv Recycl 1997;21(4):247-269Article
- 7. Perkins DN, Brune Drisse MN, Nxele T, Sly PD. E-waste: a global hazard. Ann Glob Health 2014;80(4):286-295ArticlePubMed
- 8. Chan JK, Xing GH, Xu Y, Liang Y, Chen LX, Wu SC, et al. Body loadings and health risk assessment of polychlorinated dibenzo-p-dioxins and dibenzofurans at an intensive electronic waste recycling site in China. Environ Sci Technol 2007;41(22):7668-7674ArticlePubMed
- 9. Puckett J, Byster L, Westervelt S, Gutierrez R, Davis S, Hussain A, et al. Exporting harm: the high-tech trashing of Asia. 2012 [cited 2018 Jul 7]. Available from: https://noharm-uscanada.org/sites/default/files/documents-files/84/Exporting_Harm_Trashing_Asia.pdf
- 10. Chen A, Dietrich KN, Huo X, Ho SM. Developmental neurotoxicants in e-waste: an emerging health concern. Environ Health Perspect 2011;119(4):431-438ArticlePubMed
- 11. Frazzoli C, Orisakwe OE, Dragone R, Mantovani A. Diagnostic health risk assessment of electronic waste on the general population in developing countries’ scenarios. Environ Impact Assess Rev 2010;30(6):388-399Article
- 12. Needhidasan S, Samuel M, Chidambaram R. Electronic waste–an emerging threat to the environment of urban India. J Environ Health Sci Eng 2014;12: 36ArticlePubMedPMC
- 13. Ross EJ, Graham DL, Money KM, Stanwood GD. Developmental consequences of fetal exposure to drugs: what we know and what we still must learn. Neuropsychopharmacology 2015;40(1):61-87ArticlePubMedPDF
- 14. United States Department of Labor. Evaluation of a solid sorbent passive dosimeter for collecting mercury vapor. 1989 [cited 2017 Dec 12]. Available from: https://www.osha.gov/dts/sltc/methods/inorganic/id140/id140bkr.html
- 15. Toora BD, Rajagopal G. Measurement of United States creatinine by Jaffe’s reaction--determination of concentration of sodium hydroxide required for maximum color development in standard, urine and protein free filtrate of serum. Indian J Exp Biol 2002;40(3):352-354PubMed
- 16. Ham GA. Determination of mercury in blood and urine by cold vapor AAS using the VGA-77. [cited 2017 Dec 12]. Available from: http://www.gbcpolska.pl/agilent_przyrzady/aas/pdfy/aa126_oznaczanie_rteci_Hg_we_krwi.pdf
- 17. Pollution Control Department, Ministry of Natural Resources and Environment. Thailand state of pollution report 2010. 2012 [cited 2018 Jul 7]. Available from: http://infofile.pcd.go.th/mgt/Report_Eng2553.pdf
- 18. Association Advancing Occupational and Environmental Health. Mercury, elemental: BEI (R). 2013 [cited 2018 Jul 16]. Available from: https://www.acgih.org/forms/store/Product-FormPublic/mercury-elemental-bei-r-7th-edition-documentation
- 19. Babu BR, Parande AK, Basha CA. Electrical and electronic waste: a global environmental problem. Waste Manag Res 2007;25(4):307-318ArticlePubMed
- 20. Decharat S. Mercury exposure among garbage workers in Southern Thailand. Saf Health Work 2012;3(4):268-277ArticlePubMedPMC
- 21. Julander A, Lundgren L, Skare L, Grandér M, Palm B, Vahter M, et al. Formal recycling of e-waste leads to increased exposure to toxic metals: an occupational exposure study from Sweden. Environ Int 2014;73: 243-251ArticlePubMed
- 22. Needhidasan S, Samuel M, Chidambaram R. Electronic waste - an emerging threat to the environment of urban India. J Environ Health Sci Eng 2014;12(1):36ArticlePubMedPMC
- 23. Hansen JC, Danscher G. Organic mercury: an environmental threat to the health of dietary-exposed societies? Rev Environ Health 1997;12(2):107-116ArticlePubMedPDF
- 24. Jafari MJ, Shafiei B, Azari MR, Movahhedi M. Occupational exposure to welding fumes using different ventilation scenarios. Int J Occup Hyg 2010;2(1):1-5
- 25. OSHwiki. Protective clothing against chemical and biological hazards. [cited 2017 Dec 25]. Available from: https://oshwiki.eu/wiki/Protective_clothing_against_chemical_and_biological_hazards#Protective_clothing_against_biological_hazards
- 26. Rice KM, Walker EM Jr, Wu M, Gillette C, Blough ER. Environmental mercury and its toxic effects. J Prev Med Public Health 2014;47(2):74-83ArticlePubMedPMCPDF
- 27. Wilson D. Waste Electrical and Electronic Equipment (WEEE). WEEE (e-waste) in consumer electronic devices. 2016 [cited 2018 Jul 15]. Available from: https://ewaste.ee.washington.edu/students/electronic-devices/
- 28. Huo X, Peng L, Xu X, Zheng L, Qiu B, Qi Z, et al. Elevated blood lead levels of children in Guiyu, an electronic waste recycling town in China. Environ Health Perspect 2007;115(7):1113-1117ArticlePubMedPMC
- 29. Grant K, Goldizen FC, Sly PD, Brune MN, Neira M, van den Berg M, et al. Health consequences of exposure to e-waste: a systematic review. Lancet Glob Health 2013;1(6):e350-e361ArticlePubMed
- 30. Kishore J. E-waste management: as a challenge to public health in India. Indian J Community Med 2010;35(3):382-385ArticlePubMedPMC
- 31. International Labor Organization. The global impact of e-waste: addressing the challenges. [cited 2017 Dec 25]. Available from: http://www.ilo.org/wcmsp5/groups/public/---ed_dialogue/---sector/documents/publication/wcms_196105.pdf
- 32. Eyeson J, House I, Yang YH, Warnakulasuriya KA. Relationship between mercury levels in blood and urine and complaints of chronic mercury toxicity from amalgam restorations. Br Dent J 2010;208(4):E7ArticlePubMedPDF
- 33. Langworth S, Sällsten G, Barregård L, Cynkier I, Lind ML, Söderman E. Exposure to mercury vapor and impact on health in the dental profession in Sweden. J Dent Res 1997;76(7):1397-1404ArticlePubMed
- 34. Rowland AS, Baird DD, Weinberg CR, Shore DL, Shy CM, Wilcox AJ. The effect of occupational exposure to mercury vapour on the fertility of female dental assistants. Occup Environ Med 1994;51(1):28-34ArticlePubMedPMC
REFERENCES
Figure & Data
References
Citations
Citations to this article as recorded by 
- Assessing Neurobehavioral Alterations Among E-waste Recycling Workers in Hong Kong
Gengze Liao, Feng Wang, Shaoyou Lu, Yanny Hoi Kuen Yu, Victoria H. Arrandale, Alan Hoi-shou Chan, Lap Ah Tse
Safety and Health at Work.2024; 15(1): 9. CrossRef - Bridging the knowledge gap! Health outcomes in informal e-waste workers
Béla Eckhardt, Andrea Kaifie
Journal of Occupational Medicine and Toxicology.2024;[Epub] CrossRef - Soil heavy metal pollution from waste electrical and electronic equipment of repair and junk shops in southern Thailand and their ecological risk
Panatda Pibul, Siriuma Jawjit, Supabhorn Yimthiang
Heliyon.2023; 9(10): e20438. CrossRef - Interactions between heavy metals and sleep duration among pre-and postmenopausal women: A current approach to molecular mechanisms involved
Hai Duc Nguyen
Environmental Pollution.2023; 316: 120607. CrossRef - Is exposure to chemical pollutants associated with sleep outcomes? A systematic review
Danielle A. Wallace, Jayden Pace Gallagher, Shenita R. Peterson, Seyni Ndiaye-Gueye, Kathleen Fox, Susan Redline, Dayna A. Johnson
Sleep Medicine Reviews.2023; 70: 101805. CrossRef - Review on E-waste management and its impact on the environment and society
Muskan Jain, Depak Kumar, Jyoti Chaudhary, Sudesh Kumar, Sheetal Sharma, Ajay Singh Verma
Waste Management Bulletin.2023; 1(3): 34. CrossRef - Electronic waste pollution and the COVID-19 pandemic
Deblina Dutta, Shashi Arya, Sunil Kumar, Eric Lichtfouse
Environmental Chemistry Letters.2022; 20(2): 971. CrossRef - Mercury Exposure and Its Health Effects in Workers in the Artisanal and Small-Scale Gold Mining (ASGM) Sector—A Systematic Review
Kira Taux, Thomas Kraus, Andrea Kaifie
International Journal of Environmental Research and Public Health.2022; 19(4): 2081. CrossRef - Health risk assessment of gaseous elemental mercury (GEM) in Mexico City
Benedetto Schiavo, Ofelia Morton-Bermea, Elias Salgado-Martínez, Rocío García-Martínez, Elizabeth Hernández-Álvarez
Environmental Monitoring and Assessment.2022;[Epub] CrossRef - E-waste scenario in South-Asia: an emerging risk to environment and public health
Alviti Kankanamalage Hasith Priyashantha, Nidyanandan Pratheesh, Pratheesh Pretheeba
Environmental Analysis Health and Toxicology.2022; 37(3): e2022022. CrossRef - Systematic Review and Meta-Analysis of Mercury Exposure among Populations and Environments in Contact with Electronic Waste
Gwen Aubrac, Ashley Bastiansz, Niladri Basu
International Journal of Environmental Research and Public Health.2022; 19(19): 11843. CrossRef - Electronic waste generation, regulation and metal recovery: a review
Rajarathinam Nithya, Chandrasekaran Sivasankari, Arunachalam Thirunavukkarasu
Environmental Chemistry Letters.2021; 19(2): 1347. CrossRef - Characterization of inhalation exposure to gaseous elemental mercury during artisanal gold mining and e-waste recycling through combined stationary and personal passive sampling
Melanie A. Snow, Godfred Darko, Opoku Gyamfi, Eugene Ansah, Knut Breivik, Christopher Hoang, Ying Duan Lei, Frank Wania
Environmental Science: Processes & Impacts.2021; 23(4): 569. CrossRef - Health Problems Among Workers Who Recycle Electronic Waste in Southern Thailand
Somsiri Decharat, Peeranart Kiddee
Osong Public Health and Research Perspectives.2020; 11(1): 34. CrossRef - Mercury exposure in relation to sleep duration, timing, and fragmentation among adolescents in Mexico City
Erica C. Jansen, Emily C. Hector, Jaclyn M. Goodrich, Alejandra Cantoral, Martha María Téllez Rojo, Niladri Basu, Peter X.K. Song, Libni Torres Olascoaga, Karen E. Peterson
Environmental Research.2020; 191: 110216. CrossRef - Mercury pollution in modern times and its socio-medical consequences
Lygia Therese Budnik, Ludwine Casteleyn
Science of The Total Environment.2019; 654: 720. CrossRef
 PubReader
 ePub Link
 Cite
Cite

