
Articles
- Page Path
- HOME > J Prev Med Public Health > Volume 47(6); 2014 > Article
-
Original Article
Serum Uric Acid Level and the Incidence of Metabolic Syndrome in Middle-aged Korean Men: A 5-Year Follow-up Study - Jong-Keun Lee1, Jae-Hong Ryoo1, Joong-Myung Choi1, Sung Keun Park1,2
-
Journal of Preventive Medicine and Public Health 2014;47(6):317-326.
DOI: https://doi.org/10.3961/jpmph.14.028
Published online: November 4, 2014
1Department of Preventive Medicine, Kyung Hee University School of Medicine, Seoul, Korea
2Total Healthcare Center, Kangbuk Samsung Hospital, Sungkyunkwan University School of Medicine, Seoul, Korea
- Corresponding author: Sung Keun Park, MD, MMSC 26 Kyungheedae-ro, Dongdaemun-gu, Seoul 130-701, Korea Tel: +82-2-961-0280, Fax: +82-2-969-0792 E-mail: kkkmin7@hotmail.com
Copyright © 2014 The Korean Society for Preventive Medicine
This is an Open Access article distributed under the terms of the Creative Commons Attribution Non-Commercial License (http://creativecommons.org/licenses/bync/3.0/) which permits unrestricted non-commercial use, distribution, and reproduction in any medium, provided the original work is properly cited.
ABSTRACT
-
Objectives:
- Elevated serum uric acid (UA) has been known to be associated with the prevalence of metabolic syndrome (MetS). However, no prospective studies have examined whether serum UA levels are actually associated with the development of MetS. We performed a prospective study to evaluate the longitudinal effects of baseline serum UA levels on the development of MetS.
-
Methods:
- A MetS-free cohort of 14 906 healthy Korean men, who participated in a medical check-up program in 2005, was followed until 2010. MetS was defined according to the Joint Interim Statement of the International Diabetes Federation Task Force on Epidemiology and Prevention. Cox proportional hazards models were performed.
-
Results:
- During 52 466.1 person-years of follow-up, 2428 incident cases of MetS developed between 2006 and 2010. After adjusting for multiple covariates, the hazard ratios (95% confidence intervals) for incident MetS for the second, the third, and the fourth quartile to the first quartile of serum UA levels were 1.09 (0.92-1.29), 1.22 (1.04-1.44), and 1.48 (1.26-1.73), respectively (p for trend <0.001). These associations were also significant in the clinically relevant subgroup analyses.
-
Conclusions:
- Elevated serum UA levels were independently associated with future development of MetS in Korean men during the 5-year follow-up period.
- The prevalence of metabolic syndrome (MetS) is increasing worldwide, and in the Republic of Korea (hereafter, Korea) has been substantial since the late 1990s [1]. MetS is a clustering of metabolic disturbances such as abdominal obesity, high blood pressure (BP), increased blood glucose level, and dyslipidemia, all of which increases the risk of cardiovascular disease (CVD) and type 2 diabetes mellitus (DM) [2]. In 2012, heart disease and DM were the second and the fifth leading causes of death in Korea, respectively. Several biomarkers, such as alanine aminotransferase (ALT), white blood cell count, and uric acid (UA), have been reported to play an important role in the development of MetS in Korean adults [3]. Moreover, associations with apolipoprotein B, serum ferritin, urine albumin, and non-alcoholic fatty liver disease have been observed in our prior studies.
- UA is the metabolic end-product of purine metabolism in humans, and hyperuricemia has been linked with hypertension, insulin resistance, DM, and atherosclerosis [4]. Although it is still unclear if UA is a biomarker for concurrent lifestyle habits or is involved in the causal pathways leading to metabolic disturbances, UA is a potential target for preventing decreases in insulin sensitivity and other adverse prognosis associated with MetS [5]. In Korea, three cohort studies showed that elevated serum UA level is a strong and independent risk factor of MetS incidence [6-8], but two of these cohorts had a short follow-up period (1-3 years), small cohort (1437-4779 men), and lacked data on serum insulin level, the homeostasis model assessment of insulin resistance (HOMA-IR), and renal function in their data analyses. The remaining cohort study observed the incidence of MetS in a relatively large sample (10 802 men) for up to seven years, but only specific risk factors for MetS were assessed among the 2496 incident cases of hyperuricemia.
- Therefore, we performed a follow-up study on a large number of initially MetS-free, healthy middle-aged Korean men (n=14 906), to evaluate the longitudinal effects of baseline serum UA levels on the development of MetS.
INTRODUCTION
- Study Design
- A prospective cohort study was conducted to investigate the association between serum UA levels and the development of MetS. Study participants consisted of Korean men undergoing a medical health check-up program at the health promotion center of a hospital in Seoul, Korea. The purpose of the medical health check-up program is to promote the health of the employees and to enhance the early detection of existing diseases. All employees participate in either an annual or biennial health check-up, as required by Korea’s Industrial Safety and Health Law. Most of the study population is comprised of employees and their family members who work at various companies within Korea. Their employers pay for the majority of the costs of the medical examinations. We took advantage of this opportunity to conduct a prospective study.
- Participants
- In total, 28 426 men who had been examined for all of the components of MetS during a medical check-up in 2005 were eligible for participation in this study. Among the 28 426 participants, 7013 were excluded. Subjects were excluded because they had already been diagnosed at baseline (the initial examination) with MetS (n=5353), had a history of CVD (n=226), had a history of malignancy (n=149), or were already taking lipid-lowering agents (n=2107), therefore leaving 21 413 eligible participants. We further excluded 6507 participants who did not attend any follow-up visits between 2006 and 2010. After exclusion, 14 906 participants were enrolled in the final analysis and observed for the development of MetS. The total follow-up period was 52 466.1 person-years, and the mean±standard deviation follow-up period was 3.52±1.49 person-years. Ethical approval for the study protocol and analysis of the data were obtained from the institutional review board of the hospital.
- Clinical and Laboratory Measurements
- Data were collected via the participant’s medical history, a physical examination, a questionnaire, anthropometric measurements, and laboratory measurements. The medical and drug prescription history were assessed by the examining physicians. All participants were asked to respond to a health-related behavior questionnaire, which included questions on alcohol consumption, smoking, and exercise. Alcohol intake was recorded as the frequency of alcohol consumption per week and the typical amount that was consumed per day (≥20 g/d). Participants who reported that they smoked at the time of the questionnaire were classified as current smokers. In addition, participants were asked how frequently they engaged in physical activities each week that lasted long enough to produce perspiration, such as jogging, bicycling, and swimming (≥1 time/wk). DM was defined as a fasting serum glucose level ≥126 mg/dL or the current use of blood glucose-lowering agents. Hypertension was defined either as the current use of antihypertensive medication or having a measured BP ≥140/90 mmHg at the initial examination. Trained nurses obtained sitting BP levels using a standard mercury sphygmomanometer. The first and fifth Korotkoff sounds were utilized in order to estimate the systolic and diastolic BP.
- Blood samples were collected after more than 12 hours of fasting and were drawn from an antecubital vein. Serum levels of aspartate aminotransferase (AST), ALT, and γ-glutamyltransferase (GGT) were measured using the Bayer Reagent Packs (Bayer HealthCare, Tarrytown, NY, USA) on an automated chemistry analyzer (Advia 1650 auto analyzer; Bayer Diagnostics, Leverkusen, Germany). Serum UA was measured using the Fossati enzymatic reaction using uricase with a Trinder-like endpoint (Advia 1650 auto analyzer). High-sensitivity C-reactive protein (hsCRP) was analyzed by performing particle-enhanced immunonephelometry using the BN System (Dade Behring, Marburg, Germany). Insulin levels were measured with immunoradiometric assays (Biosource, Nivelles, Belgium). Insulin resistance was calculated using the HOMA-IR as described by Matthews et al. [9]: fasting serum insulin (μU/mL) × fasting serum glucose (mmol/L) / 22.5.
- Serum creatinine (SCr) was measured using the alkaline picrate (Jaffe) method. Renal function was estimated using the glomerular filtration rate (eGFR), which was calculated using the Chronic Kidney Disease Epidemiology Collaboration equation: eGFR = 141 × min (SCr/K, 1)a × max (SCr/K, 1)−1.209 × 0.993age × 1.018 [if female] × 1.159 [if black], where SCr is serum creatinine, K is 0.7 for females and 0.9 for males, a is -0.329 for females and -0.411 for males, min indicates the minimum of SCr/K or 1 and max indicates the maximum of SCr/K or 1 [10].
- Fasting serum glucose was measured using the hexokinase method. Total cholesterol and triglyceride were measured using enzymatic colorimetric tests, low-density lipoprotein (LDL) cholesterol was measured using the homogeneous enzymatic colorimetric test, and high-density lipoprotein (HDL) cholesterol was measured using the selective inhibition method (Bayer Diagnostics).
- Body mass index was calculated as the weight (kg) divided by the height squared (m2). A single examiner measured waist circumference (WC) in the standing position and at the level of umbilicus. Height and weight were measured after an overnight fast with the shoeless participants wearing a lightweight hospital gown.
- The Joint Interim Statement of the International Diabetes Federation Task Force on Epidemiology and Prevention was used to define MetS in participants with three or more of the following variables [11]. Elevated BP was defined as a systolic or diastolic BP of 130/85 mmHg or higher, elevated fasting serum glucose level was defined as 100 mg/dL or greater, high serum triglyceride level was defined as 150 mg/dL or higher, low HDL-cholesterol level was defined as less than 40 mg/dL (men only), and elevated WC was defined as more than 90 cm (men only) [11].
- Statistical Analysis
- Data were expressed as means (standard error) or medians (minimum, maximum) for continuous variables and percentages (standard error) for categorical variables. One-way ANOVA and χ2-tests were used to analyze the statistical differences among the characteristics of the study participants at the time of enrollment in relation to the quartile groups of serum UA levels. Serum UA was categorized into the following quartiles: <5.2, 5.3-6.0, 6.1-6.7, and ≥6.8 mg/dL. We stratified our study population by 5-year age groups (from 20-24 to ≥80) and quartile groups of serum UA levels and created standardization weights equal to the size of each stratum. Then, we estimated age-standardized means and proportions for the quartile serum UA level groups using the observed distribution of the stratum as the standard. The p for trend was tested using multiple linear regression models for continuous variables and multiple logistic regression models for categorical variables after adjusting for the 5-year age groups. The distributions of the continuous variables were evaluated, and log transformations were used in the analysis as required.
- For incident MetS cases, the time of MetS occurrence was assumed to be the midpoint between the visit at which MetS was first diagnosed and the baseline visit (2005). The person-years were calculated as the sum of follow-up times from baseline until the assumed time of MetS development or until the final examination of each individual, whichever came first. We used Cox proportional hazards models to estimate adjusted hazard ratios (HR) and 95% confidence intervals (CI) for incident MetS comparing the highest three quartiles of baseline serum UA to the lowest quartile (reference). The data were adjusted for the multiple covariates. In the multivariate models, we included variables that might confound the relationship between serum UA and MetS, which included age, total cholesterol, log log(hsCRP), HOMA-IR, eGFR, the number of MetS components at baseline, smoking status, alcohol intake, regular exercise, hypertension, and DM. For the linear trends of risk, the number of quartiles was used as a continuous variable and tested in each model. Cox proportional hazards models were used to check the validity of the proportional hazards assumption. Two approaches were used to assess the validity of the proportional hazards assumption. First, the assumption was assessed by the log-minus-log survival function until it was found to graphically hold. Second, to confirm the validity of the proportional hazards assumption, time-dependent covariate analysis was used. The time-dependent covariate was not statistically significant, suggesting that the proportional hazards assumption was not violated (p=0.145). A p-value <0.05 was considered statistically significant. Statistical analyses were performed using PASW Statistics version 18.0 (SPSS Inc., Chicago, IL, USA).
METHODS
- During 52 466.1 person-years of follow-up, 2428 (16.3%) incident cases of MetS developed between 2006 and 2010. Compared with those who were included in final study population (n=14 906), those who were excluded (n=6507) were 1.4 years older (46.0 vs. 44.6) and had less favorable metabolic profiles at baseline (Supplemental Table 1). In contrast to participants without incident MetS, those with incident MetS tended to be slightly older (44.5 vs. 44.6) and had less favorable metabolic profiles at baseline. As expected, all clinical variables were statistically significant between those who did and did not develop MetS (all p<0.001) (Supplemental Table 2).
- The baseline characteristics of the study participants in relation to the quartile groups of serum UA are presented in Table 1. At baseline, the mean (standard error) age and serum UA levels (minimum, maximum) of study participants were 44.6 (0.01) years and 6.0 (0.3, 12.7) mg/dL, respectively. There were clear dose-response relationships between all of the listed variables and quartile groups of serum UA levels except for hsCRP, current smoking status, alcohol intake, and regular exercise. Body mass index, WC, total cholesterol, triglycerides, LDL-cholesterol, HOMA-IR, insulin, SCr, AST, ALT, GGT, hypertension, and the development of MetS were significantly and positively associated with the quartile groups of serum UA levels. However, average person-years, age, HDL-cholesterol, fasting serum glucose, eGFR, and DM were significantly and negatively associated with quartile groups of serum UA levels in our study participants.
- Table 2 shows the HRs and 95% CI for MetS according to the quartile groups of serum UA levels. In the unadjusted model, the HRs (95% CI) for MetS comparing the second, the third, and the fourth quartile to the first quartile of serum UA levels were 1.13 (1.00-1.28), 1.45 (1.28-1.65), and 2.01 (1.79-2.25), respectively (p for trend <0.001). These associations were apparent even after further adjustments for covariates in models 1 and 2, even though the incidence of the recently updated MetS in the second quartile of serum UA was not significant. In the fully adjusted Cox proportional hazards models (adjusted for age, total cholesterol, log(hsCRP), HOMA-IR, eGFR, the number of MetS components at baseline, smoking status, alcohol intake, regular exercise, hypertension and DM), the adjusted HRs (95% CI) for MetS across the baseline quartile groups of serum UA levels were 1.09 (0.92-1.29), 1.22 (1.04-1.44) and 1.48 (1.26-1.73), respectively (p for trend <0.001).
RESULTS
- In this prospective study of initially MetS-free, healthy middle-aged Korean men, high serum UA level was significantly and independently associated with a high risk of MetS. During 52 466.1 person-years of follow-up, 2428 incident cases of MetS developed between 2006 and 2010, and the incidence density was 46.3 cases per 1000 person-years. After adjusting for multiple covariates, the HRs (95% CI) for incident MetS comparing the second, the third, and the fourth quartile to the first quartile of serum UA levels were 1.09 (0.92-1.29), 1.22 (1.04-1.44), and 1.48 (1.26-1.73), respectively (p for trend <0.001). Previous prospective studies showed that increased serum UA levels at baseline were associated with a high risk of MetS [6,12-15], and the findings of our study are in accordance with theirs. Moreover, another 3-year follow-up health screening study in Japan demonstrated very similar results to ours; their HRs (95% CI) of MetS was significant only in the fourth quartile of serum UA levels (9.9-10.6 mg/dL) when compared to the first quartile (1.1-5.2 mg/dL) and the HR (95% CI) was 2.206 (1.344-3.620) (p=0.002) after adjusting for relevant multiple covariates [16].
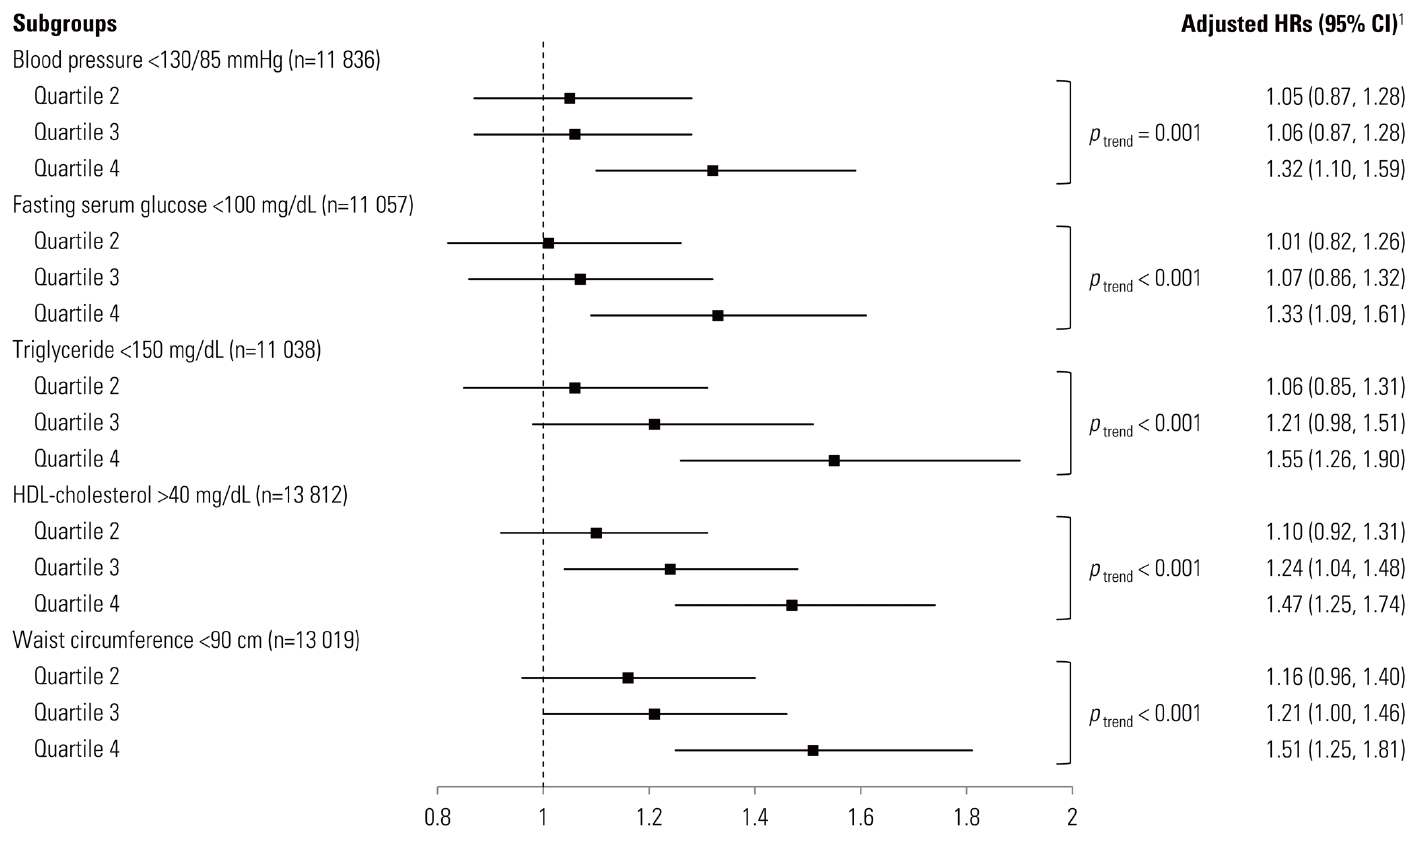
- UA is the end-product of purine metabolism in humans that is generated during the metabolism of nucleotides and adenosine triphosphate by the action of xanthine oxidase [17]. Parallel to the findings of previous studies that claimed hyperuricemia might be a new component of MetS, the adjusted HRs (95% CI) for participants with only one component and two components of MetS compared to those with none at baseline were 3.43 (2.79-4.02) and 8.05 (6.57-9.87), respectively. These associations were apparent in the clinically relevant subgroup analysis of our study participants, with BP <130/85 mmHg, fasting serum glucose <100 mg/dL, triglyceride <150 mg/dL, HDL-cholesterol >40 mg/dL and waist circumference <90 cm (Figure 1). A recent review describes the possible mechanism that UA influences the development of CVD by inducing oxidative stress, endothelial dysfunction, inflammation, and vasoconstriction; they also suggest that UA may have a causal role in the development of MetS [18]. UA is a potent antioxidant in extracellular fluid but it also exerts prooxidative effects in the intracellular environment, and it has been demonstrated that serum UA is a circulating marker of oxidant damage in some metabolic disturbances [19]. Increased serum UA levels have been previously reported to be closely associated with hypertension [20-23], DM [23,24], dyslipidemia [25], and abdominal obesity [20], but the HRs of each component of MetS were comparable in the present study.
- Even though a positive linear association was observed in our analysis, no significant risk for incident MetS was found in the second quartile (5.3-6.0 mg/dL) of serum UA level. This finding might indicate that the cutoff value of elevated serum UA level that initiates metabolic abnormalities might be within the second quartile; however, the current definition of hyperuricemia for men is 7.0 mg/dL. The optimal cutoff value of serum UA for men as a component of MetS was previously reported as 6.3 mg/dL from a recent 3-year follow-up study of 2957 MetS-free men in China [26], but this value had a low discriminatory power for MetS (area under the curve, 0.601). Thus, further studies are warranted to establish a scientifically proven strategy for use in the clinical setting.
- The major strength of our study was that we used a large sample size and excluded for the presence of MetS, CVD, malignancy, and medication use for lipid-lowering agents at baseline. However, when interpreting our results, some limitations should be considered. First, bias from follow-up loss may have affected our results. Participants not included in our analysis (n=6507) tended to be older and had less favorable metabolic profiles at baseline than those in the analytic cohort did. Loss to follow-up is expected, especially in those who are in poor health. However, loss to follow-up of high-risk people would probably lead to a conservative bias and subsequent underestimation of risk. Second, participants were self-selected, so this study may show volunteer bias. Third, our study population was comprised of healthy, middle-aged males, so the findings are unlikely to be generalizable to Korean adults. Fourth, we were not able to include some important confounders in this study, such as the presence of or use of medication to treat gout and any dietary habits.
- Additionally, all clinical variables except regular exercise showed statistically significant differences between the groups for the baseline characteristics according to the number of the MetS components they had at baseline (Supplemental Table 3). We believe that this lack of significance for regular exercise might have been caused by a lack of knowledge about the definition of a regular exercise in the health-related behavior questionnaire that was used at the health promotion center. The American College of Sports Medicine and American Heart Association define regular exercise as moderate-intensity daily physical activity for 30 minutes per session five days a week [27], and the US Department of Health and Human Services guidelines focus on completing 150 minutes a week of moderate-intensity aerobic physical activity [28].
- In conclusion, our findings, which were obtained from large cohort of Korean men, indicated that serum UA may be a predictor for the development of MetS in a 5-year follow-up period, and this association was significant after adjustment for baseline covariates.
DISCUSSION
| Characteristic | Total population | Total with characteristic |
Uric acid (mg/dL) |
p for trend1 | |||
|---|---|---|---|---|---|---|---|
| Quartile 1 (n=3508) | Quartile 2 (n=4162) | Quartile 3 (n=3496) | Quartile 4 (n=3740) | ||||
| Uric acid (mg/dL) | 14 906 | 6.0 (0.3,12.7) | 4.7 (0.3, 5.2) | 5.7 (5.3, 6.0) | 6.4 (6.1, 6.7) | 7.3 (6.8,12.7) | |
| Age (y) | 14 906 | 44.6 (0.01) | 44.6 (0.02) | 44.6 (0.02) | 44.5 (0.02) | 44.5 (0.02) | <0.001 |
| Body mass index (kg/m2) | 14 906 | 23.9 (0.02) | 23.2 (0.04) | 23.6 (0.04) | 24.0 (0.04) | 24.7 (0.04) | <0.001 |
| Waist circumference (cm) | 14 906 | 82.7 (0.06) | 81.0 (0.12) | 81.9 (0.10) | 83.2 (0.11) | 84.6 (0.11) | <0.001 |
| Systolic BP (mmHg) | 14 906 | 111.6 (0.11) | 110.8 (0.22) | 111.2 (0.20) | 111.7 (0.22) | 112.6 (0.22) | <0.001 |
| Diastolic BP (mmHg) | 14 906 | 77.0 (0.07) | 76.0 (0.15) | 76.5 (0.14) | 77.2 (0.15) | 78.2 (0.15) | <0.001 |
| Total choleste「이 (mg/dL) | 14 906 | 193.3 (0.25) | 188.5 (0.52) | 190.4 (0.47) | 194.6 (0.51) | 199.4 (0.51) | <0.001 |
| Triglyceride (mg/dL) | 14 906 | 128.6 (0.55) | 114.4 (1.04) | 121.9 (0.93) | 132.6 (1.16) | 145.1 (1.26) | <0.001 |
| HDL-cholesterol (mg/dL) | 14 906 | 51.9 (0.08) | 53.2 (0.19) | 52.0 (0.16) | 51.7 (0.17) | 50.9 (0.16) | <0.001 |
| LDL-cholesterol (mg/dL) | 14 597 | 113.8 (0.22) | 110.0 (0.45) | 111.9 (0.40) | 114.9 (0.45) | 118.3 (0.44) | <0.001 |
| Fasting serum glucose (mg/dL) | 14 906 | 96.4 (0.11) | 97.7 (0.33) | 95.8 (0.18) | 96.0 (0.19) | 96.0 (0.17) | <0.001 |
| HOMA-IR | 14 597 | 2.03 (0.01) | 1.95 (0.01) | 1.96 (0.01) | 2.05 (0.01) | 2.16 (0.02) | <0.001 |
| Insulin (μU/dL) | 14 597 | 8.5 (0.03) | 8.1 (0.05) | 8.3 (0.05) | 8.6 (0.05) | 9.1 (0.06) | <0.001 |
| Serum creatinine (mg/dL) | 14 906 | 1.13 (0.001) | 1.09 (0.002) | 1.12 (0.002) | 1.13 (0.002) | 1.17 (0.004) | <0.001 |
| eGFR (mL/min per 1.73 m2) | 14 906 | 79.5 (0.07) | 82.4 (0.15) | 80.3 (0.13) | 79.1 (0.14) | 76.4 (0.15) | <0.001 |
| Aspartate aminotransferase (U/L) | 14 906 | 25.2 (0.13) | 24.2 (0.30) | 24.8 (0.32) | 25.2 (0.17) | 26.8 (0.24) | <0.001 |
| Alanine aminotransferase (U/L) | 14 906 | 28.5 (0.19) | 25.6 (0.30) | 27.4 (0.49) | 28.9 (0.33) | 31.7 (0.32) | <0.001 |
| GGT (U/L) | 14 906 | 38.0 (0.30) | 32.4 (0.52) | 35.0 (0.51) | 39.5 (0.66) | 45.5 (0.74) | <0.001 |
| hsCRP (mg/L) | 9203 | 0.13 (0.004) | 0.15 (0.01) | 0.12 (0.01) | 0.12 (0.01) | 0.13 (0.01) | 0.24 |
| Current smoker (%) | 14 624 | 39.4 (0.4) | 38.9 (0.8) | 39.9 (0.8) | 39.4 (0.8) | 39.2 (0.8) | 0.89 |
| Alcohol intake (%) | 14 677 | 13.2 (0.3) | 12.5 (0.6) | 12.5 (0.5) | 14.0 (0.6) | 14.2 (0.6) | 0.11 |
| Regular exercise (%) | 14 589 | 19.4 (0.3) | 18.5 (0.6) | 18.8 (0.6) | 20.0 (0.7) | 20.2 (0.7) | 0.001 |
| Diabetes mellitus (%) | 14 906 | 2.9 (0.1) | 4.8 (0.3) | 2.5 (0.2) | 2.5 (0.3) | 1.8 (0.2) | <0.001 |
| Hypertension (%) | 14 906 | 14.3 (0.3) | 12.0 (0.5) | 13.0 (0.5) | 15.0 (0.6) | 17.6 (0.6) | <0.001 |
| Total person-years2 | 52 466.1 | 12 676.4 | 14 935.3 | 12 135.9 | 12 718.4 | ||
| Average person-years2 | 3.52±1.49 | 3.61±1.48 | 3.59±1.47 | 3.47±1.49 | 3.40±1.50 | ||
| Development of MetS (%)2 | 14 906 | 16.3 (0.3) | 11.8(0.5) | 13.6 (0.5) | 17.0 (0.6) | 22.9 (0.7) | <0.001 |
Data were expressed as medians (minimum, maximum), means±standard deviation, means (standard error), or percentages (standard error).
BP, blood pressure; HDL, high-density lipoprotein; LDL, low-density lipoprotein; HOMA-IR, homeostasis model assessment of insulin resistance; eGFR, estimated glomerular filtration rate; GGT, γ-glutamyltransferase; hsCRP, high-sensitivity C-reactive protein; MetS, metabolic syndrome.
1 p for trend was tested by multiple linear regression models for continuous variables and multiple logistic regression models for categorical variables after adjusting for the 5-year age groups.
2 Relevant longitudinal characteristics by baseline serum uric acid levels after a 5-year follow-up.
| Characteristics |
Hazard ratios (95% confidence interval) |
||
|---|---|---|---|
| Unadjusted | Model 11 | Model 22 | |
| Uric acid | |||
| Quartile 1 | 1.00 (reference) | 1.00 (reference) | 1.00 (reference) |
| Quartile 2 | 1.13 (1.00, 1.28) | 1.14 (0.97, 1.34) | 1.09 (0.92, 1.29) |
| Quartile 3 | 1.45 (1.28, 1.65) | 1.34 (1.14, 1.58) | 1.22 (1.04, 1.44) |
| Quartile 4 | 2.01 (1.79, 2.25) | 1.78 (1.53, 2.08) | 1.48 (1.26, 1.73) |
| p fior trend | <0.001 | <0.001 | <0.001 |
| Age | 1.02 (1.01, 1.03) | 1.01 (1.00, 1.02) | |
| Total chiolesterol | 1.01 (1.01, 1.01) | 1.00 (1.00, 1.01) | |
| Log(hsCRP) | 1.23 (1.17, 1.29) | 1.15 (1.09, 1.21) | |
| HOMA-IR | 1.27 (1.24, 1.30) | 1.17 (1.13, 1.22) | |
| Estimated glomerular filtration rate | 0.99 (0.99, 1.00) | 0.99 (0.99, 1.01) | |
| Number of MetS components at baseline | |||
| 1 (vs. 0) | 3.40 (2.77, 4.18) | ||
| 2 (vs. 0) | 8.00 (6.53, 9.80) | ||
| Smoking status | |||
| Current (vs. non-smoker) | 1.26 (1.11, 1.43) | ||
| Regular exercise | |||
| ≥1 time/wk (vs. <1 time/wk) | 0.82 (0.72, 0.94) | ||
| Alcohol intake | |||
| ≥20 g/d (vs. <20 g/d) | 0.99 (0.87, 1.15) | ||
| Hypertension | |||
| Present (vs. absent) | 1.26 (1.11, 1.43) | ||
| Diabetes mellitus | |||
| Present (vs. absent) | 1.23 (0.97, 1.56) | ||
hsCRP, high-sensitivity C-reactive protein; HOMA-IR, homeostasis model assessment of insulin resistance.
1 Model 1 was adjusted for age, total cholesterol, log(hsCRP), HOMA-IR, and estimated glomerular filtration rate.
2 Model 2 was adjusted for model 1 plus number of baseline MetS component, current smoking status, regular exercise, alcohol intake, hypertension and diabetes mellitus.
Supplementary Material
| Characteristics | Excluded (n=6507) | Included (n=14 906) | p-value1 |
|---|---|---|---|
| Age (y) | 46.0±10.1 | 44.6±7.7 | <0.001 |
| Body mass index (kg/m2) | 23.8±2.5 | 23.9±2.5 | 0.001 |
| Waist circumference (cm) | 82.7±7.3 | 82.7±6.9 | 0.75 |
| Systolic BP (mmHg) | 112.9±13.9 | 111.6±13.3 | <0.001 |
| Diastolic BP (mmHg) | 77.4±9.2 | 76.9±9.0 | 0.003 |
| Total cholesterol (mg/dL) | 192.9±31.8 | 193.3±30.9 | 0.49 |
| Triglyceride (mg/dL) | 130.2±76.1 | 128.6±67.8 | 0.13 |
| HDL-cholesterol (mg/dL) | 52.1±10.5 | 51.9±10.4 | 0.13 |
| LDL-cholesterol (mg/dL) | 113.3±26.9 | 113.8±26.3 | 0.17 |
| Fasting serum glucose (mg/dL) | 97.5±17.5 | 96.4±13.9 | <0.001 |
| HOMA-IR | 2.03±0.91 | 2.03±0.84 | 0.96 |
| Insulin (μU/dL) | 8.4±3.4 | 8.5±3.1 | 0.07 |
| Serum creatinine (mg/dL) | 1.12±0.16 | 1.13±0.15 | 0.01 |
| eGFR (mL/min per 1.73 m2) | 79.4±10.6 | 79.5±9.8 | 0.42 |
| Aspartate aminotransferase (U/L) | 25.4±12.1 | 25.2±15.6 | 0.55 |
| Alanine aminotransferase (U/L) | 28.2±19.0 | 28.5±23.3 | 0.47 |
| γ-glutamyltransferase | 39.8±47.4 | 38.0±36.9 | 0.008 |
| hsCRP (mg/L) | 0.14±0.41 | 1.13±0.38 | 0.06 |
| Current smoker (%) | 44.0 | 39.5 | <0.001 |
| Alcohol intake (%) | 17.4 | 13.2 | <0.001 |
| Regular exercise (%) | 18.5 | 19.4 | 0.14 |
| Diabetes mellitus (%) | 4.1 | 2.9 | <0.001 |
| Hypertension (%) | 17.3 | 14.3 | < 0.001 |
Values are presented as means±standard deviation, or percentages.
BP, blood pressure; HDL, high-density lipoprotein; LDL, low-density lipoprotein; HOMA-IR, homeostasis model assessment of insulin resistance; eGFR, estimated glomerular filtration rate; hsCRP, high-sensitivity C-reactive protein.
1 p-value by ANOVA-test for continuous variables and chi square test for categorical variables.
| Characteristics | Without incident MetS (n=12 478) | With incident MetS (n=2428) | p-value1 |
|---|---|---|---|
| Uric acid | 6.0 (0.01) | 6.3 (0.02) | <0.001 |
| Age (y) | 44.5 (0.01) | 44.6 (0.03) | 0.001 |
| Body mass index (kg/m2) | 23.6 (0.02) | 25.6 (0.05) | <0.001 |
| Waist circumference (cm) | 81.8 (0.06) | 87.2 (0.13) | <0.001 |
| Systolic BP (mmHg) | 110.8 (0.12) | 115.8 (0.28) | <0.001 |
| Diastolic BP (mmHg) | 76.4 (0.08) | 79.9 (0.18) | <0.001 |
| Total cholesterol (mg/dL) | 191.8 (0.27) | 201.4 (0.63) | <0.001 |
| Triglyceride (mg/dL) | 121.2 (0.55) | 167.4 (1.73) | <0.001 |
| HDL-cholesterol (mg/dL) | 52.7 (0.09) | 47.9 (0.18) | <0.001 |
| LDL-cholesterol (mg/dL) | 112.7 (0.24) | 120.1 (0.53) | <0.001 |
| Fasting serum glucose (mg/dL) | 95.5 (0.11) | 101.0 (0.37) | <0.001 |
| HOMA-IR | 1.95 (0.01) | 2.47 (0.02) | <0.001 |
| Insulin (μU/dL) | 8.2 (0.03) | 9.9 (0.07) | <0.001 |
| Serum creatinine (mg/dL) | 1.13 (0.001) | 1.14 (0.002) | <0.001 |
| eGFR (mL/min per 1.73 m2) | 79.8 (0.08) | 78.2 (0.18) | <0.001 |
| Aspartate aminotransferase (U/L) | 24.9 (0.14) | 26.9 (0.24) | <0.001 |
| Alanine aminotransferase (U/L) | 27.5 (0.21) | 34.1 (0.42) | <0.001 |
| γ-glutamyltransferase (U/L) | 35.7 (0.30) | 50.7 (0.99) | <0.001 |
| hsCRP (mg/L) | 0.12 (0.004) | 0.15 (0.009) | 0.02 |
| Current smoker (%) | 38.4 (0.4) | 45.0 (1.0) | 0.02 |
| Alcohol intake (%) | 12.7 (0.3) | 15.9 (0.7) | 0.03 |
| Regular exercise (%) | 19.2 (0.3) | 21.0 (0.8) | 0.03 |
| Diabetes mellitus (%) | 2.3 (0.1) | 5.7 (0.5) | 0.06 |
| Hypertension (%) | 12.5 (0.3) | 23.5 (0.9) | <0.001 |
Values are presented as means (standard error), or percentages (standard error).
MetS, metabolic syndrome; BP, blood pressure; HDL, high-density lipoprotein; LDL, low-density lipoprotein; HOMA-IR, homeostasis model assessment of insulin resistance; eGFR, estimated glomerular filtration rate; hsCRP, high-sensitivity C-reactive protein.
1 p-value was tested by multiple logistic regression models after adjusting for 5 year-age group.
| Characteristics |
Number of baseline MetS components |
p for trend1 | ||
|---|---|---|---|---|
| Zero (n=5234) | One (n=5576) | Two (n=4096) | ||
| Total person-years | 19 880.2 | 19 883.3 | 12 702.6 | |
| Average person-years | 3.80±1.39 | 3.57±1.48 | 3.10±1.53 | |
| Uric acid | 5.8 (0.02) | 6.1 (0.02) | 6.3 (0.02) | <0.001 |
| Age (y) | 44.5 (0.02) | 44.6 (0.02) | 44.6 (0.02) | 0.001 |
| Body mass index (kg/m2) | 22.8 (0.03) | 24.0 (0.03) | 25.2 (0.04) | <0.001 |
| Waist circumference (cm) | 79.6 (0.08) | 83.0 (0.09) | 86.4 (0.11) | <0.001 |
| Systolic BP (mmHg) | 105.9 (0.13) | 112.0 (0.17) | 118.0 (0.23) | <0.001 |
| Diastolic BP (mmHg) | 73.0 (0.09) | 77.4 (0.11) | 81.3 (0.15) | <0.001 |
| Total cholesterol (mg/dL) | 186.7 (0.40) | 195.0 (0.42) | 200.1 (0.50) | <0.001 |
| Triglyceride (mg/dL) | 93.0 (0.38) | 131.6 (0.84) | 172.1 (1.33) | <0.001 |
| HDL-cholesterol (mg/dL) | 54.8 (0.14) | 51.4 (0.14) | 48.7 (0.15) | <0.001 |
| LDL-cholesterol (mg/dL) | 109.8 (0.36) | 115.4 (0.36) | 117.4 (0.43) | <0.001 |
| Fasting serum glucose (mg/dL) | 91.1 (0.08) | 97.0 (0.18) | 101.8 (0.28) | <0.001 |
| HOMA-IR | 1.69 (0.008) | 2.06 (0.01) | 2.44 (0.02) | <0.001 |
| Insulin (μU/dL) | 7.5 (0.04) | 8.6 (0.04) | 9.8 (0.06) | <0.001 |
| Serum creatinine (mg/dL) | 1.12 (0.002) | 1.13 (0.003) | 1.14 (0.002) | <0.001 |
| eGFR (mL/min per 1.73 m2) | 80.3 (0.12) | 79.5 (0.12) | 78.5 (0.14) | <0.001 |
| Aspartate aminotransferase (U/L) | 24.5 (0.33) | 24.9 (0.12) | 26.8 (0.17) | <0.001 |
| Alanine aminotransferase (U/L) | 25.0 (0.44) | 28.5 (0.23) | 33.6 (0.32) | <0.001 |
| γ-glutamyltransferase (U/L) | 29.1 (0.38) | 38.8 (0.47) | 48.9 (0.71) | <0.001 |
| hsCRP (mg/L) | 0.11 (0.008) | 0.13 (0.007) | 0.14 (0.006) | 0.003 |
| Current smoker (%) | 36.8 (0.7) | 39.9 (0.7) | 42.7 (0.8) | <0.001 |
| Alcohol intake (%) | 10.1 (0.4) | 13.7 (0.5) | 16.2 (0.6) | <0.001 |
| Regular exercise (%) | 20.8 (0.6) | 19.4 (0.5) | 17.8 (0.6) | <0.001 |
| Diabetes mellitus (%) | 0.3 (0.08) | 2.6 (0.2) | 6.1 (0.4) | <0.001 |
| Hypertension (%) | 1.8 (0.2) | 14.2 (0.5) | 29.2 (0.7) | <0.001 |
| Development of MetS (%) | 3.6 (0.3) | 14.2 (0.5) | 35.2 (0.8) | <0.001 |
Values are presented as means (standard error), or percentages (standard error).
MetS, metabolic syndrome; BP, blood pressure; HDL, high-density lipoprotein; LDL, low-density lipoprotein; HOMA-IR, homeostasis model assessment of insulin resistance; eGFR, estimated glomerular filtration rate; hsCRP, high-sensitivity C-reactive protein.
1 p-value was tested by multiple linear regression models for continuous variables and multiple logistic regression models for categorical variables after adjusting for 5 year-age group.
- 1. Suh S, Lee MK. Metabolic syndrome and cardiovascular diseases in Korea. J Atheroscler Thromb 2014;21 Suppl 1: S31-S35Article
- 2. Expert Panel on Detection, Evaluation, and Treatment of High Blood Cholesterol in Adults. Executive summary of the third report of the National Cholesterol Education Program (NCEP) expert panel on detection, evaluation, and treatment of high blood cholesterol in adults (Adult Treatment Panel III). JAMA 2001;285(19):2486-2497ArticlePubMed
- 3. Kang YH, Min HG, Kim IJ, Kim YK, Son SM. Comparison of alanine aminotransferase, white blood cell count, and uric acid in their association with metabolic syndrome: a study of Korean adults. Endocr J 2008;55(6):1093-1102ArticlePubMed
- 4. So A, Thorens B. Uric acid transport and disease. J Clin Invest 2010;120(6):1791-1799ArticlePubMedPMC
- 5. Osgood K, Krakoff J, Thearle M. Serum uric acid predicts both current and future components of the metabolic syndrome. Metab Syndr Relat Disord 2013;11(3):157-162ArticlePubMedPMC
- 6. Ryu S, Song J, Choi BY, Lee SJ, Kim WS, Chang Y, et al. Incidence and risk factors for metabolic syndrome in Korean male workers, ages 30 to 39. Ann Epidemiol 2007;17(4):245-252ArticlePubMed
- 7. Choe JY, Park SH, Kim JY, Shin IH, Kim SK. Change in serum uric acid between baseline and 1-year follow-up and its associated factors in male subjects. Clin Rheumatol 2008;27(4):483-489ArticlePubMed
- 8. Ryu S, Chang Y, Zhang Y, Kim SG, Cho J, Son HJ, et al. A cohort study of hyperuricemia in middle-aged South Korean men. Am J Epidemiol 2012;175(2):133-143ArticlePubMed
- 9. Matthews DR, Hosker JP, Rudenski AS, Naylor BA, Treacher DF, Turner RC. Homeostasis model assessment: insulin resistance and beta-cell function from fasting plasma glucose and insulin concentrations in man. Diabetologia 1985;28(7):412-419ArticlePubMed
- 10. Levey AS, Stevens LA, Schmid CH, Zhang YL, Castro AF 3rd, Feldman HI, et al. A new equation to estimate glomerular filtration rate. Ann Intern Med 2009;150(9):604-612ArticlePubMedPMC
- 11. Alberti KG, Eckel RH, Grundy SM, Zimmet PZ, Cleeman JI, Donato KA, et al. Harmonizing the metabolic syndrome: a joint interim statement of the International Diabetes Federation Task Force on Epidemiology and Prevention; National Heart, Lung, and Blood Institute; American Heart Association; World Heart Federation; International Atherosclerosis Society; and International Association for the Study of Obesity. Circulation 2009;120(16):1640-1645ArticlePubMed
- 12. Hara S, Tsuji H, Ohmoto Y, Amakawa K, Hsieh SD, Arase Y, et al. High serum uric acid level and low urine pH as predictors of metabolic syndrome: a retrospective cohort study in a Japanese urban population. Metabolism 2012;61(2):281-288ArticlePubMed
- 13. Yang T, Chu CH, Bai CH, You SL, Chou YC, Chou WY, et al. Uric acid level as a risk marker for metabolic syndrome: a Chinese cohort study. Atherosclerosis 2012;220(2):525-531ArticlePubMed
- 14. Goncalves JP, Oliveira A, Severo M, Santos AC, Lopes C. Cross-sectional and longitudinal associations between serum uric acid and metabolic syndrome. Endocrine 2012;41(3):450-457ArticlePubMed
- 15. Zhang Q, Zhang C, Song X, Lin H, Zhang D, Meng W, et al. A longitudinal cohort based association study between uric acid level and metabolic syndrome in Chinese Han urban male population. BMC Public Health 2012;12: 419ArticlePubMedPMC
- 16. Oda E. Serum uric acid is an independent predictor of metabolic syndrome in a Japanese health screening population. Heart Vessels 2014;29(4):496-503ArticlePubMed
- 17. Wu XW, Muzny DM, Lee CC, Caskey CT. Two independent mutational events in the loss of urate oxidase during hominoid evolution. J Mol Evol 1992;34(1):78-84ArticlePubMed
- 18. Kanbay M, Segal M, Afsar B, Kang DH, Rodriguez-Iturbe B, Johnson RJ. The role of uric acid in the pathogenesis of human cardiovascular disease. Heart 2013;99(11):759-766ArticlePubMed
- 19. Billiet L, Doaty S, Katz JD, Velasquez MT. Review of hyperuricemia as new marker for metabolic syndrome. ISRN Rheumatol 2014;2014: 852954ArticlePubMedPMCPDF
- 20. Masuo K, Kawaguchi H, Mikami H, Ogihara T, Tuck ML. Serum uric acid and plasma norepinephrine concentrations predict subsequent weight gain and blood pressure elevation. Hypertension 2003;42(4):474-480ArticlePubMed
- 21. Nakanishi N, Okamoto M, Yoshida H, Matsuo Y, Suzuki K, Tatara K. Serum uric acid and risk for development of hypertension and impaired fasting glucose or type II diabetes in Japanese male office workers. Eur J Epidemiol 2003;18(6):523-530ArticlePubMed
- 22. Shankar A, Klein R, Klein BE, Nieto FJ. The association between serum uric acid level and long-term incidence of hypertension: population-based cohort study. J Hum Hypertens 2006;20(12):937-945ArticlePubMed
- 23. Perlstein TS, Gumieniak O, Williams GH, Sparrow D, Vokonas PS, Gaziano M, et al. Uric acid and the development of hypertension: the normative aging study. Hypertension 2006;48(6):1031-1036ArticlePubMed
- 24. Dehghan A, van Hoek M, Sijbrands EJ, Hofman A, Witteman JC. High serum uric acid as a novel risk factor for type 2 diabetes. Diabetes Care 2008;31(2):361-362ArticlePubMed
- 25. Rathmann W, Funkhouser E, Dyer AR, Roseman JM. Relations of hyperuricemia with the various components of the insulin resistance syndrome in young black and white adults: the CARDIA study: coronary artery risk development in young adults. Ann Epidemiol 1998;8(4):250-261ArticlePubMed
- 26. Zhang ML, Gao YX, Wang X, Chang H, Huang GW. Serum uric acid and appropriate cutoff value for prediction of metabolic syndrome among Chinese adults. J Clin Biochem Nutr 2013;52(1):38-42ArticlePubMedPMC
- 27. Garber CE, Blissmer B, Deschenes MR, Franklin BA, Lamonte MJ, Lee IM, et al. American College of Sports Medicine position stand. Quantity and quality of exercise for developing and maintaining cardiorespiratory, musculoskeletal, and neuromotor fitness in apparently healthy adults: guidance for prescribing exercise. Med Sci Sports Exerc 2011;43(7):1334-1359ArticlePubMed
- 28. US Department of Health and Human Services. 2008 Physical activity guidelines for Americans; 2008 [cited 2014 Jun 30]. Available from: http://www.health.gov/paguidelines
REFERENCES
Figure & Data
References
Citations
- Which Clusters of Metabolic Syndrome Are the Most Associated with Serum Uric Acid?
Jurgita Mikolaitytė, Jolita Badarienė, Roma Puronaitė, Alma Čypienė, Irma Rutkauskienė, Jolanta Dadonienė, Aleksandras Laucevičius
Medicina.2022; 58(2): 297. CrossRef - Association between serum uric acid and metabolic syndrome: a cross-sectional study in Bangladeshi adults
Nurshad Ali, Rakib Miah, Mahmudul Hasan, Zitu Barman, Ananya Dutta Mou, Jaasia Momtahena Hafsa, Aporajita Das Trisha, Akibul Hasan, Farjana Islam
Scientific Reports.2020;[Epub] CrossRef - Association between uric acid and metabolic syndrome in elderly women
Hui-Juan Wang, Lei-Zhi Shi, Cun-Fei Liu, Shi-Min Liu, Song-Tao Shi
Open Medicine.2018; 13(1): 172. CrossRef - The Associations of Serum Uric Acid with Obesity-Related Acanthosis nigricans and Related Metabolic Indices
Cuiling Zhu, Ran Cui, Mingming Gao, Sharvan Rampersad, Hui You, Chunjun Sheng, Peng Yang, Hui Sheng, Xiaoyun Cheng, Le Bu, Shen Qu
International Journal of Endocrinology.2017; 2017: 1. CrossRef - Association between Serum Uric Acid and Mortality among Chinese Patients with Coronary Artery Disease
Qing Li, Yuan Zhang, Ding Ding, Yunou Yang, Qian Chen, Chaoqun Liu, Xinrui Li, Changjiang Hong, Wenhua Ling
Cardiology.2016; 134(3): 347. CrossRef
 PubReader
 ePub Link
 Cite
Cite

