
Articles
- Page Path
- HOME > J Prev Med Public Health > Volume 46(6); 2013 > Article
-
Original Article
Determinants of Health Care Expenditures and the Contribution of Associated Factors: 16 Cities and Provinces in Korea, 2003-2010 - Kimyoung Han1, Minho Cho2, Kihong Chun1,2
-
Journal of Preventive Medicine and Public Health 2013;46(6):300-308.
DOI: https://doi.org/10.3961/jpmph.2013.46.6.300
Published online: November 28, 2013
1Department of Preventive Medicine and Public Health, Ajou University School of Medicine, Suwon, Korea.
2Graduate School of Public Health, Ajou University, Suwon, Korea.
- Corresponding author: Kihong Chun, MD, PhD. 206 World cup-ro, Yeongtong-gu, Suwon 443-721, Korea. Tel: +82-31-219-5082, Fax: +82-31-219-5084, ajoujkh@ajou.ac.kr
Copyright © 2013 The Korean Society for Preventive Medicine
This is an Open Access article distributed under the terms of the Creative Commons Attribution Non-Commercial License (http://creativecommons.org/licenses/by-nc/3.0/) which permits unrestricted non-commercial use, distribution, and reproduction in any medium, provided the original work is properly cited.
ABSTRACT
-
Objectives
- The purpose of this study was to classify determinants of cost increases into two categories, negotiable factors and non-negotiable factors, in order to identify the determinants of health care expenditure increases and to clarify the contribution of associated factors selected based on a literature review.
-
Methods
- The data in this analysis was from the statistical yearbooks of National Health Insurance Service, the Economic Index from Statistics Korea and regional statistical yearbooks. The unit of analysis was the annual growth rate of variables of 16 cities and provinces from 2003 to 2010. First, multiple regression was used to identify the determinants of health care expenditures. We then used hierarchical multiple regression to calculate the contribution of associated factors. The changes of coefficients (R2) of predictors, which were entered into this analysis step by step based on the empirical evidence of the investigator could explain the contribution of predictors to increased medical cost.
-
Results
- Health spending was mainly associated with the proportion of the elderly population, but the Medicare Economic Index (MEI) showed an inverse association. The contribution of predictors was as follows: the proportion of elderly in the population (22.4%), gross domestic product (GDP) per capita (4.5%), MEI (-12%), and other predictors (less than 1%).
-
Conclusions
- As Baby Boomers enter retirement, an increasing proportion of the population aged 65 and over and the GDP will continue to increase, thus accelerating the inflation of health care expenditures and precipitating a crisis in the health insurance system. Policy makers should consider providing comprehensive health services by an accountable care organization to achieve cost savings while ensuring high-quality care.
- Since the introduction of the National Health Insurance system 20 years ago, health care expenditures in Korea have been drastically increasing every year. Medical expenses covered by health insurance, which were about 13 trillion won in 2001, had jumped 2.6-fold by 2010, reaching around 34 trillion Korean won. This was an average increase of over 11% annually in the first decade of the 21st century. Such a trend raises concerns over the sustainability of health insurance finance following the increase in health care expenditures.
- Medical costs can be explained by determinant factors that are produced by multiplying the volume of health services by the unit cost per service. According to the fee-for-service system used in Korea, the unit cost is determined by multiplying relative value units per service by a conversion factor. The conversion factor is determined through negotiation between the National Health Insurance Service and supplier groups every year. The only mechanism by which insurers can control medical expenditures is this conversion factor. Although the Korean government controlled the conversion factor in order to keep down medical expenses in health insurance for over ten years beginning 2001, under the current circumstances in which there is no mechanism to control the frequency or intensity of health services, health care expenditures continue to increase.
- Keeping down health care expenditures is the most crucial health care policy challenge for almost all Organization for Economic Cooperation and Development countries worldwide. Research on the causes of health care expenditure increases has been conducted consistently in order to identify effective policy measures to control health care expenditures. In Korea also, many studies on the factors causing the increase in health expenditures have been performed since that of Kim and Chun [1], including Lee and Jung [2], Tchoe et al. [3], and Ryu [4].
- To date, studies on determinant factors of health care expenditures have mostly used approaches focusing on the use of health services (based on the volume and price of health services) or an economic approach using demand and supply factors of health services. Factors such as gross domestic product (GDP), population size, composition of the elderly population, number of physicians, number of medical institutions, and unit costs of services have been a major focus in such studies. According to many previous studies, variables including GDP per capita and the proportion of the population aged 65 and over had a significant influence on national health care expenditure increases [5-11].
- This study, unlike previous studies, classified factors that increase health care expenditures into non-negotiable factors-ones that increase health care expenditures by natural or macroeconomic causes-and negotiable factors. Such a classification will contribute to choosing approaches to addressing modifiable and non-modifiable factors when discussing policies for controlling health care expenditure increases.
- Therefore, in this study, we categorized health care expenditure determinants into non-negotiable factors and negotiable factors and determined an alternative index of each factor to analyze the annual trend of these indicators. We also examined the association between the rates of increase of health expenditures and that of each factor, and finally identified how much the selected main factors contributed to the health expenditure increases.
INTRODUCTION
- Research Model
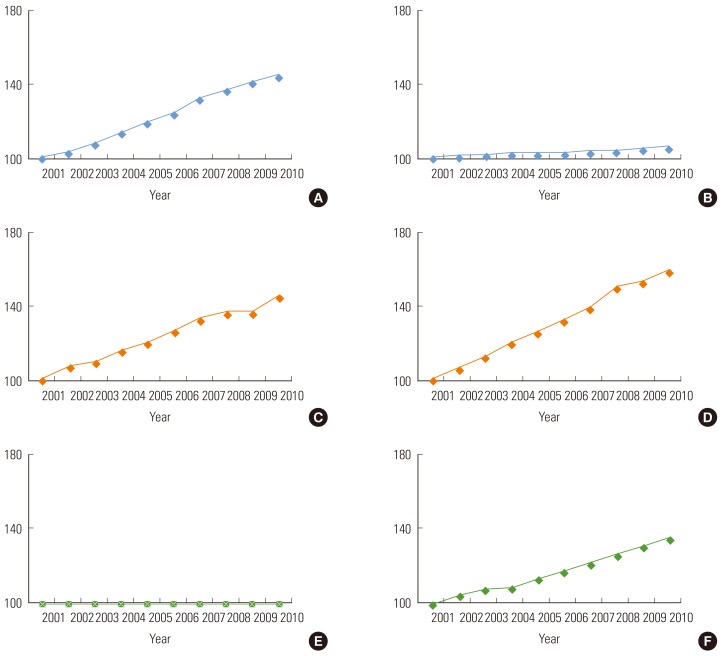
- The health care expenditure increase factor model used in this study is shown in Table 1. This model classified determinants of health expenditure increases into 1) macro-environmental factors, such as population increase, GDP, and Price Index; 2) health policy factors, such as expansion of insurance coverage by insurer (government); and 3) induced demand factors determined by suppliers and consumers. We then classified each factor into non-negotiable factors and negotiable factors, and categorized the mechanisms by which each factor influences health care expenditures into price, frequency, and service intensity. Figure 1 demonstrates trends for the major factors classified as described in the health expenditures accumulated for ten years (from 2001 to 2010).
- Data and Variables
- In this study, we computed the year-on-year increase and decrease rates of each factor by city and province, of 16 cities and provinces in Korea, using data from nine years from 2002 to 2010. The annual rate of increase of health insurance medical expenses per city and province was considered a dependent variable. The data was collected from the statistical yearbooks of the National Health Insurance Service, the Consumer Price Index and Producer Price Index from Statistics Korea, and regional statistical yearbooks of the cities and provinces.
- The overall Medicare Economic Index (MEI) and regional MEI were calculated using the Consumer Price Index and Producer Price Index of 16 cities and provinces. The total rates of increase in health insurance medical expenses and annual rates of change in the number of health insurance beneficiaries and beneficiaries older than 65 years old were computed using National Health Insurance statistical yearbooks. For example, the annual growth rate of the GDP per capita was produced by dividing the difference between the GDP per capita of year t and GDP per capita of year t-1 by the GDP per capita in year t-1.
- The MEI was devised to estimate the total cost increase needed for physicians to perform clinical activities in the US Medicare system, and serves as a medical price index [12]. The critical point here is to calculate the most optimal MEI by reevaluating the cost components of the MEI and weight of the components, and the Price/Wage Index. In this study, we used the cost component items of primary level long-term care facilities (local clinics) based on 2005 joint research and cost component items by types of hospitals (based on research on hospital conversion factors in 2006) to apply them as MEI cost components, weight per component, and macroeconomic indicators for each item. The components and weights of the MEI are shown in Table 2 [13].
- The factors contributing to the health care expenditure increases that were used in the final analysis are demonstrated in Table 3. These factors include the annual growth rate of each of the following: GDP per capita; population aged 65 and over; MEI; factors caused by polices (the growth rate of medical expenses in health insurance caused by the expansion of health insurance benefits); the number of physicians; the number of tertiary hospitals; the number of hospitals; the number of local clinics; expenditure per hospitalization; and expenditure per ambulatory care visit.
- Analysis Method
- The annual rates of increase or decrease of each factor in the last eight years are presented in a graph with the same units and scale and can be compared to each other. The degree of association between the rate of increase or decrease in medical costs and the annual rate of increase or decrease in each factor was identified while controlling other factors contributing to the increase in health care expenditures, using multiple linear regression analysis. Hierarchical multiple regression analysis was conducted to identify how much each factor contributes to the increase in medical costs. The coefficient of determination (R2) signifies the contribution of the changes explained by a regression line in explaining the total changes.
- Hierarchical multiple regression analysis evaluates the relationships between independent variable groups and dependent variables while considering that one independent variable group-one or multiple independent variables-influences dependent variables or controls such influences. When evaluating variables in the model hierarchically, entering the independent variables in sequential order is crucial. The sequence for including independent variables in the model is generally decided by the analysts' empirical evidence, that is, theoretical or reasonable evidence from previous studies [14].
- For instance, suppose that we have to explain a case of a dependent variable y by four independent variables x1, x2, x3, and x4. We signify the coefficient of determination as R2y.1 in a model that has only one independent variable, x1. Then, when an additional independent variable x2 is included in the model where x1 was given, we signify the coefficient of determination as R2y.12 in a model that has two independent variables, x1 and x2. In the same way, when x3 is added, the coefficient of determination would be R2y.123, and lastly, when x4 is added, the coefficient of determination would be R2y.1234. Eventually, the coefficient of determination would become the same coefficient of determination of the multiple linear regression analysis model that has x1, x2, x3, and x4 as explanatory variables.
- R2y.1234 is broken down as follows:
- In the above formula, R2y.12-R2y.1 becomes the variation of the coefficient of determination that is produced by adding x2 to the model, considering the independent variable x1 only [15].
METHODS
- According to the annual rates of increase or decrease in health expenditures of 16 cities and provinces from 2003 to 2010, health expenditures increased every year during the period analyzed all across Korea. For four years between 2003 and 2006, the rate of increase did not change greatly, staying at around 10% on average. However, in 2007, pronounced differences appeared among the 16 cities and provinces. The gap seemed to stabilize in 2008, but increasingly widened as the years passed, reaching 20% in 2010. In 2008 and 2009, Chungnam province, specifically, showed a year-on-year change in medical expenses of over 60%.
- Table 3 is the result of multiple linear regression analysis, which shows the association between factors causing an increase in health insurance medical expenses and the increase in health care expenditures. As the proportion of the elderly in the total population increases, total medical expenses in health insurance rose in a statistically significant fashion. The variation in the MEI demonstrated a statistically significant negative association with that of total health insurance medical expenses.
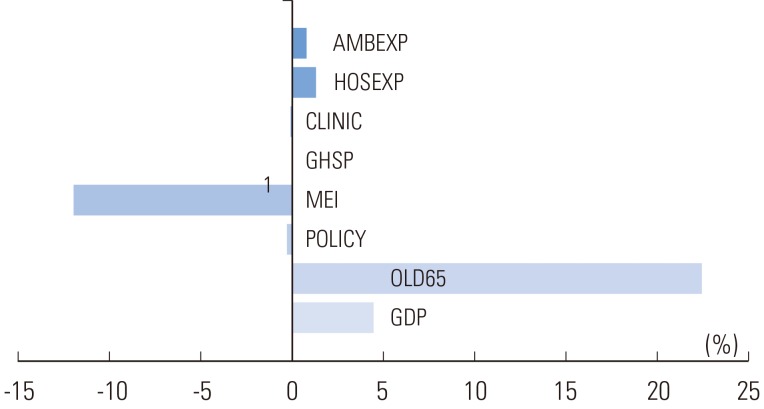
- Figure 2 shows the contribution of determinants to changes in total health insurance medical expenses. The increase in the proportion of the elderly population was the biggest contributor (contribution: 22.4%), followed by the increase in the GDP per capita, contributing 4.5%. Average medical costs per discharge case and average cost per outpatient visit contributed about 1%-to be specific, 1.3% and 0.8%, respectively. On the other hand, the annual growth rate in the number of tertiary hospitals showed a very low contribution of 0.01%. The MEI was found to negatively contribute to the increase in health insurance medical costs. Factors caused by policy changes and the number of medical institutions including local clinics barely contributed to the increase in health insurance medical expenses.
RESULTS
- Among the determinants of health care expenditures categorized into non-negotiable and negotiable factors, population size, application of new medical technologies, and medical fee variables were excluded from the analysis. The reasons for these exclusions were as follows: Population size used total medical cost per capita as an outcome variable; there was no method to measure the application of new medical technologies; the conversion factor. Medical fees, is determined consistently by the type of medical institution, regardless of region. However, as the variables in this study were analyzed by city and province, ecological bias could occur, and thus we excluded medical fees.
- The annual growth rates of the health insurance medical expenses of 16 cities and provinces from 2003 to 2010 show that the medical expenditures rose consistently every year. More specifically, the rate of increase in medical expenditures in Seoul was lowest beginning in 2008, and those of Jeonnam and Jeonbuk were highest. This contradicts the expectation that Seoul would show the highest rate of increase in medical expenditures because it has the largest number of tertiary hospitals and clinics and highest population density. Instead, Jeonbuk and Jeonnam, which provide low accessibility to medical services and have a small population, demonstrated the highest rate of increase in health care expenditures.
- Notably, Chungnam showed pronounced differences from other regions in the changes in health care expenditures in 2008 and 2009. In 2007, the elderly population fell drastically in Chungnam, which led to the drop in both inpatients and outpatients, resulting in large reductions in medical expenditures in 2008. In contrast, in 2009, the number of inpatients and outpatients increased drastically, causing a huge rise in medical expenditures. Although Jeonnam and Jeonbuk also experienced a reduction in the elderly population, it did not result in a decrease in inpatients and outpatients as occurred in Chungnam. Regarding such differences in factors related to medical expenditures by region, more concrete research on the medical environment and factors increasing medical expenditures of the 16 cities and provinces needs to be conducted, with greater consideration for the characteristics of each region.
- In this study, the factors that showed a statistically significant association with the increase in health insurance medical expenses were the proportion of the elderly population and MEI, both non-negotiable factors. Particularly, a change in the proportion of the elderly population was found to have the greatest influence on the increase in health insurance medical expenses. The aging population is recognized as a huge social and economic burden globally and addressing this issue requires urgent action. What is known as the "baby boom generation" of Korea is 7.12 million, accounting for 14.6% of the total population. Over the period of ten years since 2010 when this generation goes into retirement, health care expenditures are projected to spike by an even larger margin, with a drastic increase in the elderly proportion of the population [16].
- As long as the elderly population and patients with chronic diseases continue to increase and an increase in service frequency continues, a way to keep down the rise of medical expenses in health insurance is unlikely to be found. It will not be possible to control increases in medical expenditures in health insurance by a fee control mechanism using a conversion factor as is currently done [17,18]. It is time to consider introducing policies that press suppliers by setting an affordable insurance fee level and total medical expenditures, and limiting medical expenditures within those boundaries. Possible solutions include diagnosis-related groups, global budgeting as is used in Taiwan, or a new payment system combining fee-for-service and population-based payment [19].
- Changes in the payment system to control medical expenses in health insurance are directly linked to the quality of health services. Therefore, transformation of the health service delivery system to control increases in health care expenditures while maintaining the quality of health services is also necessary. Currently, the Korean health care system has disconnections between the primary, secondary, and tertiary health service systems. This causes an increase in medical expenditures as wasteful, redundant, and unnecessary health services are provided, which makes it all the more important to reform the health service market [20].
- An organization that provides comprehensive health services is needed-such as an accountable care organization (ACO), based on the United States Patient Protection and Affordable Care Act (also known as "Obamacare"), which signaled the health care reform of the US in late 2010. An ACO pursues the three objectives of better care for individuals, better health for the population, and slower growth in costs through improvements in care, and is now being implemented in the US [20,21]. In many advanced countries, ACOs are already evolving to be optimal organizations that take responsibility for and provide care to patients who belong to the organization, through collaboration among hospitals, doctors, and other health care providers [22,23].
- Although the increase in the elderly population, GDP, and MEI are non-negotiable and inevitable factors, they should not go unaddressed. In order to limit the increase in medical expenditures caused by these factors, the Korean government should expand investment and policy measures to improve the health of baby boomers, so that the increases in health care expenditures following the aging of the population can be minimized.
- The MEI, serving as a medical price index, was expected to cause increases in health care expenditures due to the increase of physician practice expenses. Squires [11] noted that the combination of pervasive medical technology and high-priced medical services drove the increase of US health spending, and a possible explanation for the outsized share of resources he dedicates to health care relative to the rest of the world. However, the result of the present study showed that the MEI had a negative association with the increase in health expenditures.
- This is speculated to be due to the influence of complex political and economic factors-for example, the financial crisis and issues with North Korea's nuclear program-on the variables used in computing the MEI including the Price Index and Wage Index, during the period of focus of the study from 2002 to 2010. This can be interpreted to have occurred because the actual annual growth rate of the MEI decreased every year by small margins, from 6.3% in 2003 to 3.6% in 2010, while the actual increase in total medical expenditures showed upward trends every year.
- The GDP per capita is known to be a very significant statistical factor in health care expenditures [5,6]. Previous studies have demonstrated that the GDP had a positive association with the total increase in medical expenditures. However, no significant relationship was demonstrated in this study. Health insurance medical expenses are known to be more influenced by the GDPs of the past five years, not by the current GDP [24].
- In this study, the annual growth rate of the GDP and medical expenses were analyzed per year, and the economic slowdown of three to four years caused by the global financial crisis that occurred during the period of time studied appeared to have influenced the GDP and health spending. In fact, the annual growth rate of the GDP decreased in 2003 and 2004, rather than increased, and there was no change in 2005. In addition, as the growth rate of medical expenses in the same period of time increased continuously, the relationship between GDP per capita and medical expenses was not statistically significant.
- Although the contribution of the GDP was not statistically significant, it was the second largest contributor to the annual growth rate of medical expenses with a 4.5% contribution, followed by the proportion of the elderly population, the highest contributor, at 24.4%. The result for the MEI was contrary to what was predicted, due to the continuous reduction of its annual growth rate since 2003. Furthermore, the MEI was not measured based on the actual production cost of resources put into the health services of hospitals and clinics; instead, the MEI was produced by using the Price Index, which represented the input resources.
- The Price Index chosen in this study was based on the MEI cost components studied in the US However, items that are not congruent with the Price Index of Korea were replaced with different Price Index items used in prior research. Among various non-negotiable factors, the MEI should be considered with top priority and requires more accurate measurement methods. Thus, relevant systems need to be overhauled to collect actual production cost data of hospitals and clinics systematically, and an acceptable MEI needs to be produced based on such a system.
- The limitations of this study are as follows: first, the study failed to consider external influences such as economic and social factors. It is possible that the macroeconomic indicators that were used in the analysis, including the GDP and MEI, have been influenced by the fluctuating global economic situation since 2000. For this reason, the total contribution of the factors used in the contribution analysis remained at about 40%. Second, there is a possibility that the ecological fallacy occurred, given that the unit of analysis was the population. However, as the variables were measured by their annual growth rate, this may not have affected the study results. Third, although each variable's annual growth rate by region was considered as a unit, the variables did not reflect structural differences between regions. As there was no way to estimate structural differences between regions and no indicator that could represent the differences, we could not produce weights between regions with regional yearbook data alone. Further studies are needed to produce weights according to various variables that reflect regional characteristics related to health services.
- In Korea, the stability of health insurance finance is being disturbed due to the spending burden caused by health care expenditure increases. Addressing the issue with myopic policy measures may result in losing both the health of the people and financial sustainability. A more fundamental approach to the issue is necessary.
- Since 2000, the increase in health care expenditures in Korea reached a level threatening the sustainability of insurance financing. It is time to establish policy measures to control the increase in health expenditures. In this study, the rate of increase of the proportion of the elderly aged 65 and over influenced the rise in medical expenses with statistical significance.
- As of 2011, baby boomers in Korea have started to go into retirement. It is evident that for the following ten years until they stop retiring, the proportion of the elderly population will increase even more, and thus the rise of health care expenditures will accelerate further. Therefore, health expenditure control policies would not be effective without considering the spike in the aging population. The transformation in the health service delivery system to both maintain the quality of health services and to limit health expenditure increases is necessary, as is an organization to provide comprehensive health services, such as an ACO.
DISCUSSION
- 1. Kim HJ, Chun KH. An analysis of determinants of medical cost inflation using both deterministic and stochastic models. Korean J Prev Med 1989;22(4):542-554. (Korean)
- 2. Lee KJ, Jung YH. The determinants of national health expenditure: a decision tree analysis. Korean J Health Policy Adm 2002;12(3):99-111. (Korean)Article
- 3. Tchoe B, Nam S, Shin Y. Determinants of the national health expenditures: panel study. Korean J Health Policy Adm 2004;14(2):99-116. (Korean)Article
- 4. Ruy GC. An analysis on determinants and appropriateness of Korea's national health expenditure increase through price-quantity decomposition of increase rate. Korean J Health Econ Policy 2007;13(1):1-17. (Korean)
- 5. Newhouse JP. Medical-care expenditure: a cross-national survey. J Hum Resour 1977;12(1):115-125. 404354ArticlePubMed
- 6. Gerdtham UG, Jönsson B, MacFarlan M, Oxley H. The determinants of health expenditure in the OECD countries: a pooled data analysis. Dev Health Econ Public Policy 1998;6: 113-134. 10662400ArticlePubMed
- 7. Hitiris T, Posnett J. The determinants and effects of health expenditure in developed countries. J Health Econ 1992;11(2):173-181. 10122977ArticlePubMed
- 8. Huang SL. Factors influencing healthcare spending in Singapore: a regression model. Int J Computer Internet Manag 2004;12(3):51-62
- 9. Schulz E. The influence of supply and demand factors on aggregate health care expenditure with a specific focus on age composition. Brussels: ENEPRI; 2005. p. 16
- 10. Sen A. Is health care a luxury? New evidence from OECD data. Int J Health Care Finance Econ 2005;5(2):147-164. 15912314ArticlePubMed
- 11. Squires DA. Explaining high health care spending in the United States: an international comparison of supply, utilization, prices, and quality. Issue Brief (Commonw Fund) 2012;10: 1-14
- 12. Kim HJ, Sohn M, Park EC, Choi KS, Park WS, Lim J, et al. The development of the Korean Medical Insurance Economic Index (MIEI). Korean J Health Policy Adm 1999;9(1):156-177. (Korean)
- 13. Ahn T. Study of converson factor, 2008. Seoul: Seoul National University Institute of Management Research; 2008. p. 58-63
- 14. Petrocelli JV. Hierarchical multiple regression in counseling research: common problems and possible remedies. Meas Eval Couns Dev 2003;36(1):9-22Article
- 15. Suh HS. SPSS PASW regression analysis. 3rd ed. Seoul: Hannarae Academy; 2009. p. 109-129 (Korean)
- 16. Di Matteo L. The macro determinants of health expenditure in the United States and Canada: assessing the impact of income, age distribution and time. Health Policy 2005;71(1):23-42. 15563991ArticlePubMed
- 17. Goodson JD, Bierman AS, Fein O, Rask K, Rich EC, Selker HP. The future of capitation: the physician role in managing change in practice. J Gen Intern Med 2001;16(4):250-256. 11318926ArticlePubMedPMC
- 18. Steinbrook R. The end of fee-for-service medicine? Proposals for payment reform in Massachusetts. N Engl J Med 2009;361(11):1036-1038. 19641192ArticlePubMed
- 19. Landon BE. Keeping score under a global payment system. N Engl J Med 2012;366(5):393-395. 22296073ArticlePubMed
- 20. Berwick DM. Launching accountable care organizations: the proposed rule for the Medicare Shared Savings Program. N Engl J Med 2011;364(16):e32. 21452999ArticlePubMed
- 21. Marcoux RM, Larrat EP, Vogenberg FR. Accountable care organizations: an improvement over HMOs? P T 2012;37(11):629-650. 23204817PubMedPMC
- 22. McWilliams JM, Song Z. Implications for ACOs of variations in spending growth. N Engl J Med 2012;366(19):e29. 22533535ArticlePubMedPMC
- 23. Stecker EC. The Oregon ACO experiment: bold design, challenging execution. N Engl J Med 2013;368(11):982-985. 23406006ArticlePubMed
- 24. Getzen TE. Forecasting health expenditures: short, medium, and long (long) term. J Health Care Finance 2000;26(3):56-72. 10728485PubMed
REFERENCES
Two variables, Medicare Economic Index and policy, were equally applied without regional difference, and each variable shows annual growth rate of the factor.
SE, standard error; GDP, gross domestic product per capita; OLD65, population aged 65 and over; POLICY, coverage expansion; MEI, Medicare Economic Index; PHY, numbers of physician; GHSP, numbers of general hospital; HSP, numbers of hospital; CLINIC, number of clinic; HOSEXP, expenditure per hospitalization; AMBEXP, expenditure per ambulatory care.
Figure & Data
References
Citations
- The Impact of Public Housing Investments on the Economic Development of Provinces: The Case of Turkey (TOKI)
Banu Tantan, Sevkiye Sence Turk
Journal of Urban Planning and Development.2024;[Epub] CrossRef - Yenilenebilir Enerji Tüketimi Sağlık Harcamaları Üzerinde Etkili Mi? AB Ülkeleri Örneği
Dilek Atılgan, Enver Günay
Hitit Sosyal Bilimler Dergisi.2024; 17(1): 39. CrossRef - SAĞLIK HARCAMALARININ BELİRLENMESİNDE SOSYO-EKONOMİK UNSURLARIN ETKİLERİ: TÜRKİYE VE SEÇİLMİŞ AB ÜLKELERİ ÜZERİNE PANEL VERİ ANALİZİ
Seyhan TAŞ, Dilek ATILGAN
Journal of Economics and Research.2023; 4(2): 47. CrossRef - The Granger Causality Between Health Expenditure and Gross Domestic Product in OECD Countries
Gülnur İlgün, Murat Konca, Seda Sönmez
Journal of Health Management.2022; 24(3): 356. CrossRef - Health expenditures, environmental quality, and economic development: State-of-the-art review and findings in the context of COP26
Zhenjiang Xing, Xia Liu
Frontiers in Public Health.2022;[Epub] CrossRef - Systematic review of factors determining health care expenditures
Mohammad Meskarpour Amiri, Mahmood Kazemian, Zahra Motaghed, Zhaleh Abdi
Health Policy and Technology.2021; 10(2): 100498. CrossRef - Determinants of health expenditure from global perspective: A panel data analysis
Muhammad Awais, Alam Khan, Muhammad Salman Ahmad
Liberal Arts and Social Sciences International Journal (LASSIJ).2021; 5(1): 481. CrossRef - An empirical study on the determinants of health care expenses in emerging economies
Lulin Zhou, Sabina Ampon-Wireko, Henry Asante Antwi, Xinglong Xu, Muhammad Salman, Maxwell Opuni Antwi, Tordzro Mary Norvienyo Afua
BMC Health Services Research.2020;[Epub] CrossRef - Association between Primary Healthcare and Medical Expenditures in a Context of Hospital-Oriented Healthcare System in China: A National Panel Dataset, 2012–2016
Mengping Zhou, Jingyi Liao, Nan Hu, Li Kuang
International Journal of Environmental Research and Public Health.2020; 17(18): 6917. CrossRef - Differentiation in Healthcare Financing in EU Countries
Tomasz Rokicki, Aleksandra Perkowska, Marcin Ratajczak
Sustainability.2020; 13(1): 251. CrossRef - GDP Growth and Health Care Expenditures Worldwide
Milos Stepovic
The Open Pharmacoeconomics & Health Economics Journal.2019; 7(1): 9. CrossRef - GDP Growth and Health Care Expenditures Worldwide
Milos Stepovic
The Open Pharmacoeconomics & Health Economics Journal.2019; 7(1): 21. CrossRef - Effect of Work on Medical Expenditures by Elderly: Findings From the Korean Health Panel 2008–2013
Min Kyung Hyun
Safety and Health at Work.2018; 9(4): 462. CrossRef - Towards Actualizing the Value Potential of Korea Health Insurance Review and Assessment (HIRA) Data as a Resource for Health Research: Strengths, Limitations, Applications, and Strategies for Optimal Use of HIRA Data
Jee-Ae Kim, Seokjun Yoon, Log-Young Kim, Dong-Sook Kim
Journal of Korean Medical Science.2017; 32(5): 718. CrossRef - Population Aging and Healthcare Expenditure in Korea
Kyung‐Rae Hyun, Sungwook Kang, Sunmi Lee
Health Economics.2016; 25(10): 1239. CrossRef - Do health care workforce, population, and service provision significantly contribute to the total health expenditure? An econometric analysis of Serbia
M. Santric-Milicevic, V. Vasic, Z. Terzic-Supic
Human Resources for Health.2016;[Epub] CrossRef - The failure of gastroenterologists to apply intestinal ultrasound in inflammatory bowel disease in the Asia‐Pacific: A need for action
Anil Kumar Asthana, Antony B Friedman, Giovanni Maconi, Christian Maaser, Torsten Kucharzik, Mamoru Watanabe, Peter R Gibson
Journal of Gastroenterology and Hepatology.2015; 30(3): 446. CrossRef - Economic Burden of Diabetes Mellitus on Patients with Respiratory Failure Requiring Mechanical Ventilation during Hospitalizations
Wei-Erh Cheng, Li-Ting Su, Shuo-Chueh Chen, Tsai-Chung Li, Hsiang-Wen Lin
Value in Health Regional Issues.2014; 3: 33. CrossRef - Changes in the epidemiology and burden of community-acquired pneumonia in Korea
Hyoung Kyu Yoon
The Korean Journal of Internal Medicine.2014; 29(6): 735. CrossRef
 PubReader
 ePub Link
 Cite
Cite


