Effects of Socio-demographic Factors on the Decreasing Trend in the Sex Ratio at Birth in Korea, 1997-2017
Article information

Abstract
Objectives
This study investigated the effects of socio-demographic factors on the decreasing trend in the sex ratio at birth from 1997 to 2017 in Korea.
Methods
Data from 10 349 602 live births registered with Statistics Korea from 1997 to 2017 were analyzed. The secondary sex ratio (SSR), defined as the ratio of male to female live births, during the study period (1997-1999 [phase I], 2000-2002 [phase II], 2003-2005 [phase III], 2006-2008 [phase IV], 2009-2011 [phase V], 2012-2014 [phase VI], and 2015-2017 [phase VII]) was calculated according to selected socio-demographic factors, such as parental age, education, occupation, and birth order. Logistic regression models were used to estimate odds ratios (ORs) and 95% confidence intervals for a male birth after adjusting for potential confounders.
Results
The SSR gradually decreased from 1.10 (in 1998-2000 and 2002) to 1.05 (in 2013-2016). While a decreasing trend in the SSR was not noted among first births, male-biased sex ratios were prominent among third and higher-order births, for which the highest SSR was 1.46 in 1998. Higher birth order was significantly associated with an excess of male births in phases I-VI (≥third vs. first, OR range, 1.03 to 1.35). Advanced maternal age was significantly associated with an excess of female births in phases II, III, and V (≥40 vs. 20-24 years, OR range, 0.92 to 0.95).
Conclusions
This study demonstrated that advanced maternal age and reduction of the artificially-biased SSR among third and higher-order births may partially explain the decreasing trend in the SSR from 1997 to 2017 in Korea.
INTRODUCTION
The sex ratio at birth, or the secondary sex ratio (SSR), is defined as the ratio of male to female live births. Not only has the SSR served as a population health indicator (e.g., for fertility), but it has also played an important role as a social indicator (e.g., for son preference, gender equity, and couples’ childbearing behavior) in many countries around the world, notably in Asia [1-3]. Korea is an Asian country that has undergone drastic changes in the SSR in the last few decades [4]. In Korea, the SSR began to increase abruptly in the mid-1980s, along with the use of ultrasound for prenatal sex determination [2,3,5]. The SSR then peaked in 1990, with a severely male-biased SSR of 1.165. Since the mid-1990s, the SSR has gradually decreased, reaching an average natural SSR of 1.050 in 2016.
The stability and variability of the SSR have been proposed to be influenced by a variety of endogenous and exogenous factors. It has been suggested that several biological factors, such as parental hormone levels around the time of conception [6-8], follicular phase length [9,10], timing of conception during the menstrual cycle [7,9], and sperm characteristics [11], may play a role in the natural SSR. In addition, the SSR observed at the population level has been reported to vary according to socio-demographic factors such as parental age [12-15], birth order [12-14,16,17], race/ethnicity [12,14,18], and socioeconomic status (SES) [5,12,15,19-22].
Despite the recent dramatic changes in the SSR observed in Korea, sparse previous research using nationally representative data has investigated the associations of socio-demographic factors with long-term temporal trends in the SSR. A study using national vital statistics data from 1981 to 2004 [5] assessed parental SES, as measured by education and occupation, in relation to the SSR, and suggested that maternal SES may be a more sensitive indicator of variations in the SSR than paternal SES. Of note, the aforementioned study reported that there had been changes in the association between parental SES and the SSR across three equidistant time periods (1981-1984, 1991-1994, and 2001-2004). Namely, before the mid-1980s, higher parental SES was associated with an increased SSR (i.e., an excess of male births). Since then, however, an inverse association between parental SES and the SSR was prominently noted in the early 1990s. With a more extensive evaluation of socio-demographic factors (e.g., parental age, education, occupation, and birth order) in relation to the SSR, the present study aimed to investigate the impact of socio-demographic factors on the decreasing trend in the SSR from 1997 to 2017 in Korea.
METHODS
Research Data
Data from all live births registered with Statistics Korea from 1997 to 2017 were obtained from the Microdata Integrated Service (MDIS) [4]. With no missing values for infant sex, a total of 10 349 602 live births were included in the final dataset. Nonetheless, missing values for independent variables (birth order, n=44 280 [0.4%]; maternal age, n=15 519 [0.1%]; paternal age, n=82 823 [0.8%]; maternal education, n=64 135 [0.6%]; paternal education, n=104 555 [1.0%]; maternal occupation, n=171 102 [1.7%]; and paternal occupation, n=324 730 [3.1%]) were excluded from the analysis of each variable.
Statistical Analysis
All live births, the proportions of male and female births and the SSR (among all live births and according to birth order [first, second, and third and higher-order births]) during the study period were calculated. The linear-by-linear association test was used to test the significance of trends in the proportions of male and female births during the study period. To evaluate changes in the SSR and its associations with sociodemographic factors over time, the study period was divided into 7 phases: 1997-1999 (phase I), 2000-2002 (phase II), 2003-2005 (phase III), 2006-2008 (phase IV), 2009-2011 (phase V), 2012-2014 (phase VI), and 2015-2017 (phase VII). Logistic regression models were used to estimate odds ratios (ORs) and 95% confidence intervals (CIs) for a male birth, after adjusting for parental age (≤19, 20-24, 25-29, 30-34, 35-39, and ≥40 years), education (primary, secondary, tertiary), occupation (non-manual, manual, and others [students, housewives, etc.]), and/or birth order (first, second, and third or higher). As birth order has been recognized as a factor responsible for imbalances in the SSR, a subgroup analysis was conducted according to birth order. A 2-sided significance level of 0.05 was used to assess statistical significance. Statistical analysis was performed using SPSS version 25 (IBM Corp., Armonk, NY, USA).
Ethics Statement
As all of the data used were de-identified, this study was classified as exempt research by the Institutional Review Board of Daegu Catholic University Medical Center.
RESULTS
Table 1 shows all live births, the proportions of male and female births, and the SSR from 1997 to 2017 in Korea. During the study period, the highest SSR (1.10) was observed in the late 1990s and the early 2000s. The SSR gradually decreased from 1.10 (in 1998-2000 and 2002) to 1.05 (in 2013-2016). When the SSR was calculated according to birth order, the decreasing trend in the SSR was not noticeable among first births. Among third and higher-order births, however, malebiased sex ratios were prominent in the late 1990s and the early 2000s (with the highest SSR being 1.46 in 1998), demonstrating a remarkable decrease in the SSR during the study period (Table 1).

All live births, the proportions of male and female births, and the secondary sex ratio (SSR), 1997-2017, Korea
The number of all live births and the SSR according to sociodemographic factors in phases I-VII are presented in Table 2. The proportion of mothers aged ≥35 years increased from 5.9% in phase I to 26.3% in phase VII; and that of fathers aged ≥35 years increased from 17.8% in phase I to 47.2% in phase VII. The distributions of parental education and occupation changed markedly during the same period. For instance, the proportion of college-educated mothers increased from 32.0% to 77.2%, and that of mothers with non-manual jobs increased from 10.1% to 32.4% (Table 2).

Number (%) of all live births and the secondary sex ratio (SSR) according to socio-demographic factors, phases I-VII (1997-2017), Korea
Table 3 presents the ORs and 95% CIs for a male birth according to socio-demographic factors among all live births. Higher birth order was significantly associated with an excess of male births in phases I-VI (≥third vs. first, OR range, 1.03 to 1.35), but not in phase VII. Adolescent mothers had higher odds of a male birth than did mothers aged 20-24 years in phase I (≤19 vs. 20-24 years, OR, 1.04; 95% CI, 1.00 to 1.07; p<0.05). However, older mothers had lower odds of a male birth than did mothers aged 20-24 years in phases II, III, and V (≥40 vs. 20-24 years, OR range, 0.92 to 0.95). Equivocal findings on the association of maternal SES with the SSR were noted. Namely, less-educated mothers had lower odds of a male birth than did college-educated mothers in phase II (primary vs. tertiary, OR, 0.94; 95% CI, 0.90 to 0.98). Meanwhile, compared with mothers with non-manual jobs, those with manual jobs (OR, 1.03; 95% CI, 1.01 to 1.05) and others (OR, 1.01; 95% CI, 1.00 to 1.02; p<0.05) had higher odds of a male birth in phase III.
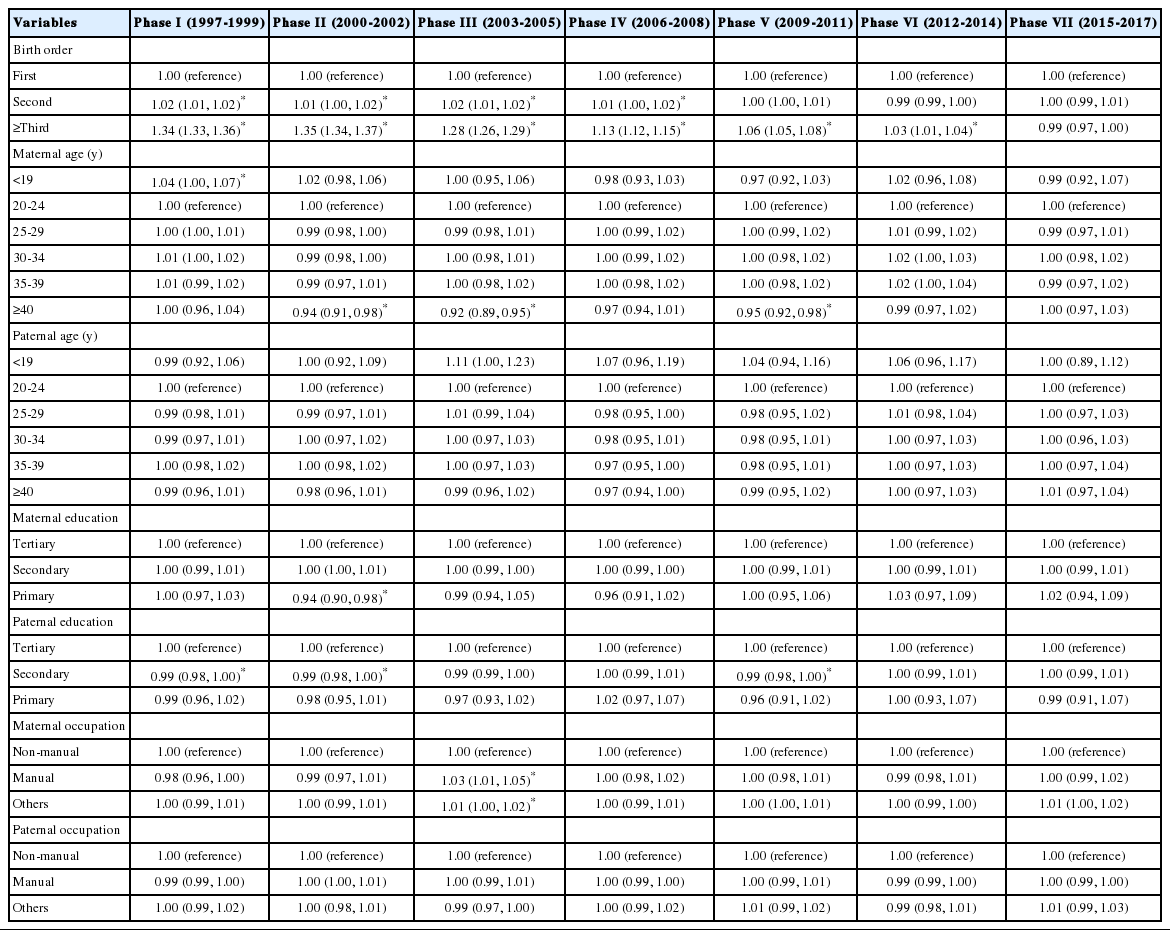
Odds ratios (ORs) and 95% confidence intervals (CIs) for a male birth according to socio-demographic factors among all live births, phases I-VII (1997-2017), Korea
The associations between socio-demographic factors and the SSR among first births, second births, and third and higher-order births are shown in Tables 4 and 5, Supplemental Material 1. Comparable findings on the association between maternal age and the SSR were noted among first births (in phase I, ≤19 vs. 20-24 years, OR, 1.04; 95% CI, 1.01 to 1.08; in phases II, III, and V, ≥40 vs. 20-24 years, OR range, 0.87 to 0.93) relative to the corresponding findings among all live births. Paternal age was also found to be significantly associated with the SSR among first births, indicative of similar opposing directions toward infant sex at both age extremes (i.e., ≤19 and ≥40 years) (Table 4). However, when the analysis was restricted to third and higher-order births, the findings on the associations between parental age and the SSR were in contrast with the corresponding findings among all live births or first births, indicating that advanced parental age was associated with an excess of male births in phase I (Table 5). In addition, among third and higher-order births, fathers with low SES, as measured by education and occupation, had lower odds of a male birth than did those with high SES, particularly in some early phases (phases I-III) (Table 5).

Odds ratios (ORs) and 95% confidence intervals (CIs) for a male birth according to socio-demographic factors among first births, phases I-VII (1997-2017), Korea
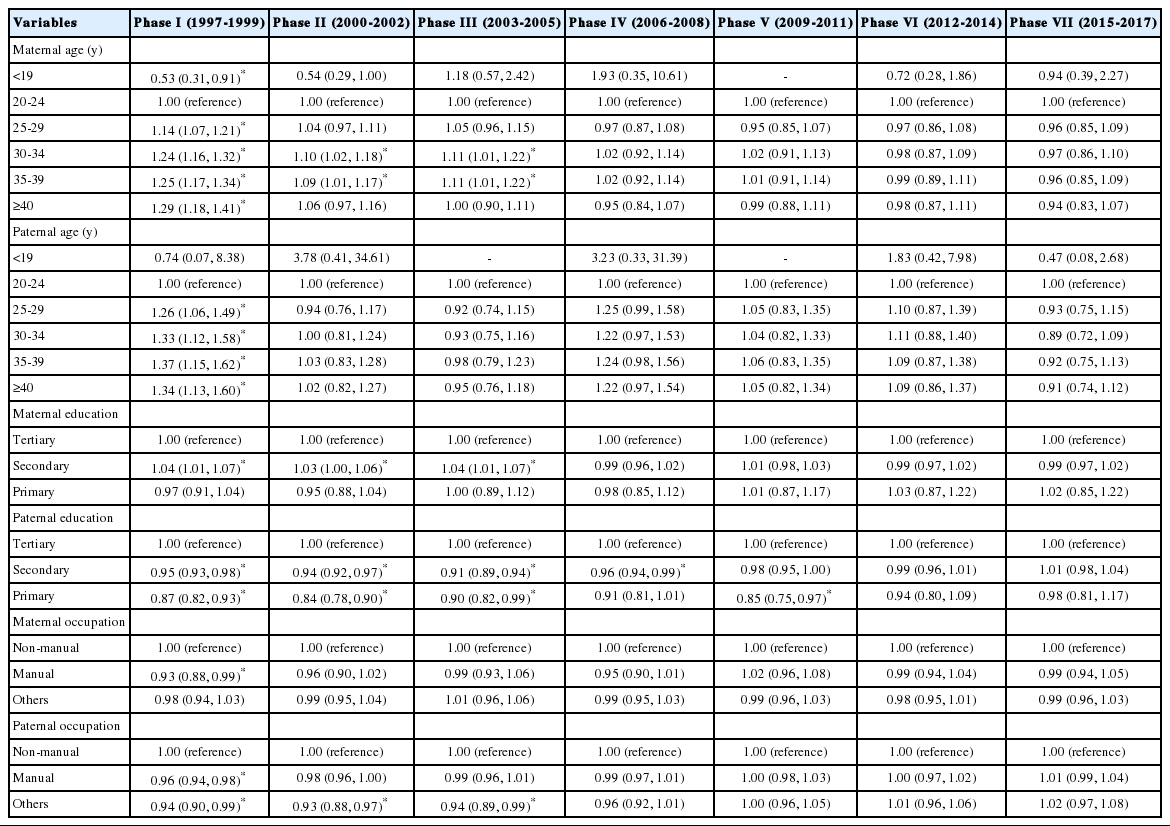
Odds ratios (ORs) and 95% confidence intervals (CIs) for a male birth according to socio-demographic factors among third and higher-order births, phases I-VII (1997-2017), Korea
DISCUSSION
The present study used data from the national birth registry to evaluate the effects of selected socio-demographic factors on the decreasing trend in the SSR from 1997 to 2017 in Korea. This study revealed that higher birth order was a strong predictor of an excess of male births in 1997-2014, but not in 2015-2017 (Table 3), possibly reflecting the reduction of an artificially-biased SSR among third and higher-order births over time [3]. In fact, the analysis according to birth order showed that changes in the SSR during the study period were not prominent among first births, but were noteworthy among third and higher-order births. Imbalances in the SSR observed in some Asian countries, such as China and India, are thought to be attributed to son preference and prenatal sex selection against females [2,3,5], which are social trends considered to be influenced by economics and cultural transmission [23,24]. As Korea has undergone drastic economic development and cultural changes during the last few decades, changes in sex selection practices, along with the implementation of policies against these practices, may have contributed to the rapid normalization of the artificially-biased SSR in Korea [24-26].
In addition, consistent with some—but not all—previous studies [12-15], the present study revealed that maternal age was significantly associated with differences in the SSR among all live births. Specifically, this study suggests that advanced maternal age (≥40 years) may be associated with a lower SSR, whereas young maternal age (≤19 years) may be associated with a higher SSR (Table 3). Similarly, in a study using data from the national birth registry from 1940 to 2002 in the United States, the 2 oldest maternal age groups (40-44 and ≥45 years) had the lowest SSR (both 1.04) [14]. Another study using United States linked birth-infant death data from 1983 to 2001 found that mothers aged 15-19 years were more likely to give birth to sons than mothers aged 20-34 years, whereas mothers aged ≥35 years were more likely to give birth to daughters [15]. Contrary to the present study, however, several studies, particularly those conducted in Western countries, have suggested that higher birth order may be associated with a decreased SSR, given that older age at childbearing tends to be associated with higher birth order [12,14]. For instance, the aforementioned study conducted in the United States showed that seventh and eighth and higher-order births had the lowest SSR (both 1.03) [14].
Of note, the present study revealed that the association of parental age with the SSR differed by birth order. This may have resulted from a mixture of the biological and artificial effects of this factor on the SSR (i.e., a mixture of naturally-varied and artificially-biased SSR), which may differ by birth order. The SSR among first births, which appeared to be within the natural range of variability, was found to be significantly associated with parental age at both extremes (≤19 and ≥40 years), reflecting the potential biological impact of this factor on infant sex (Table 4). Meanwhile, the SSR for third and higher-order births, which appeared to be severely male-biased, particularly in the late 1990s (phase I), showed opposite results in terms of its association with parental age compared with the corresponding results among first births (Table 5). Among third and higher-order births in the late 1990s, as parental age increased, the odds of a male birth increased, implying possible birth cohort effects on the magnitude of son preference and couples’ childbearing behavior [3,24,27].
Uncertain associations of parental SES with the SSR were noted among all live births and in the subgroup analysis according to birth order (Tables 3-5, and Supplemental Material 1). In comparison with a previous study using national vital statistics data from 1981 to 2004 [5], the present study did not clearly show that maternal SES was a more sensitive indicator of variation in the SSR than paternal SES during the study period. Instead, among third and higher-order births, low-SES fathers (SSR range, 1.21 to 1.32; data not shown) were found to have lower odds of a male birth than high-SES fathers (SSR range 1.37 to 1.49; data not shown), particularly in the late 1990s and early 2000s (phases I-III) (Table 5). This finding may be interpreted as reflecting the artificial effect of SES on the SSR, as high-SES fathers may have better access to sex selection techniques than low-SES fathers having a third and higher-order child.
In terms of the biological effect of SES on the SSR, the Trivers-Willard (TW) hypothesis, a long-established hypothesis regarding the SSR, theorizes that parents in good condition tend to produce more sons, whereas parents in poor condition tend to produce more daughters from the perspective of evolutionary biology [28]. According to the TW hypothesis, high-SES parents are more likely to have sons, while low-SES parents are more likely to have daughters, allegedly due to higher male mortality during the gestational period [12,19,20,22]. However, the existing evidence on the TW hypothesis is controversial, with inconsistent findings on the association between parental SES and the SSR [12,15,19-22]. For instance, in a study conducted in Sweden, more than 3 000 000 births between 1960 and 2007 were analyzed to examine various dimensions of parental SES (i.e., earnings, post-transfer income, wealth, parental wealth, education, and occupation) in relation to the SSR, and no substantive relationship was found between parental SES and the SSR [21]. In another study using Swedish national data for the years 1862 through 1991 [20], in contrast, economic contractions were found to be significantly associated with alterations in the SSR at the population level, implying a potential role of ambient social stressors such as economic stress in affecting the SSR [19,20,22,29].
Nonetheless, the biological mechanisms by which parental socio-demographic factors might influence the SSR are obscure. Another prevailing hypothesis regarding the SSR is the hormonal hypothesis proposed by James [6-8], who postulated that parental hormone levels around the time of conception are potential determinants of offspring sex. According to this hypothesis, high levels of estrogen (in the mother) and testosterone (in either parent) are associated with an excess of male births, whereas high levels of follicle-stimulating hormone and luteinizing hormone are associated with an excess of female births [6,7]. In light of age-related hormonal changes in humans, parental age may function as a biological determinant of the SSR. While the hormonal hypothesis applies to the determination of sex ratio at conception or the primary sex ratio, the economic stress hypothesis proposed by Catalano applies to subsequent adjustments to the primary sex ratio via sex-selective fetal loss [8,19,20]. Namely, since maternal economic stress around the time of conception causes increased testosterone secretion from the adrenal glands, it may increase the likelihood of conceiving a male according to the hormonal hypothesis. If maternal economic stress persists during the gestational period, however, it may increase the risk of spontaneous abortion, which disproportionately affects male embryos and fetuses according to the economic stress hypothesis. As such, prolonged economic stress experienced by mothers may compensate for the male-biased primary sex ratio, or could even result in an excess of female births [29].
The major limitations of the present study should be taken into account when interpreting the observed results. Although the present study utilized national birth registry data that covered nearly all births in the nation, the information regarding the parents, such as age and SES, may have been inaccurate. As for the information on infants, the SSR is not considered to be affected by recall bias. With sole dependence on information included in the national birth registry, various dimensions of parental SES (e.g., earnings, wealth, etc.) were not evaluated. For the same reason, further investigations of other potential determinants of temporal trend in the SSR (e.g., environmental factors such as exposure to endocrine disruptors [30]) were unfeasible. Normative changes related to the observed trend in the SSR were not quantitatively assessed, meaning that this study did not address how much normative changes have contributed to the decreasing trend in the SSR during the study period. Furthermore, although the study results were interpreted as reflecting a mixture of the biological and artificial effects of factors affecting the SSR, the SSR may not be an accurate indicator for evaluating changes in sex selection practices and policies targeting these practices within a population. As recently proposed, the sex selection propensity, which incorporates other relevant factors (e.g., family size and birth order) together with the SSR, may serve as a more accurate indicator of these changes [1].
In conclusion, the present study demonstrated that advanced maternal age and the reduction of the artificially-biased SSR among third and higher-order births may partially explain the decreasing trend in the SSR from 1997 to 2017 in Korea. The artificial effect of birth order on the SSR appeared to exceed the biological effect of birth order on the SSR from 1997 to 2014, but this was no longer the case starting in the mid-2010s (2015-2017; phase VII). The rapid normalization of the artificially-biased SSR in Korea in the last few decades is perceived to be a desirable phenomenon, with favorable social implications regarding gender equity and couples’ childbearing behavior. Along with various socio-demographic factors, potential environmental factors affecting the SSR at the population level need more research attention to ensure the stability of the SSR within its natural range of variability.
SUPPLEMENTAL MATERIALS
Supplemental material is available at https://doi.org/10.3961/jpmph.20.282.
Odds ratios (ORs) and 95% confidence intervals (CIs) for a male birth according to socio-demographic factors among second births, Phases I-VII (1997-2017), Korea
Notes
CONFLICT OF INTEREST
The author has no conflicts of interest associated with the material presented in this paper.
FUNDING
This work was supported by research grants from Daegu Catholic University in 2018.
ACKNOWLEDGEMENTS
None.
Notes
AUTHOR CONTRIBUTIONS
All work was done by JB.