Excess Deaths During the COVID-19 Pandemic in Southern Iran: Estimating the Absolute Count and Relative Risk Using Ecological Data
Article information

Abstract
Objectives:
The coronavirus disease 2019 (COVID-19) pandemic led to increased mortality rates. To assess this impact, this ecological study aimed to estimate the excess death counts in southern Iran.
Methods:
The study obtained weekly death counts by linking the National Death Registry and Medical Care Monitoring Center repositories. The P-score was initially estimated using a simple method that involved calculating the difference between the observed and expected death counts. The interrupted time series analysis was then used to calculate the mean relative risk (RR) of death during the first year of the pandemic.
Results:
Our study found that there were 5571 excess deaths from all causes (P-score=33.29%) during the first year of the COVID-19 pandemic, with 48.03% of these deaths directly related to COVID-19. The pandemic was found to increase the risk of death from all causes (RR, 1.26; 95% confidence interval [CI], 1.19 to 1.33), as well as in specific age groups such as those aged 35-49 (RR, 1.21; 95% CI, 1.12 to 1.32), 50-64 (RR, 1.38; 95% CI, 1.28 to 1.49), and ≥65 (RR, 1.29; 95% CI, 1.12 to 1.32) years old. Furthermore, there was an increased risk of death from cardiovascular diseases (RR, 1.17; 95% CI, 1.11 to 1.22).
Conclusions:
There was a 26% increase in the death count in southern Iran during the COVID-19 pandemic. More than half of these excess deaths were not directly related to COVID-19, but rather other causes, with cardiovascular diseases being a major contributor.
INTRODUCTION
The coronavirus disease 2019 (COVID-19) pandemic has been responsible for over 6 million deaths globally, as of March 6, 2023 [1]. COVID-19 is a multiorgan disease that affects the respiratory, cardiovascular, neurologic, and urinary systems [2,3]. In addition, it can cause various long-term sequelae; therefore, many post-infection deaths can be attributed to the infection itself [4]. The COVID-19 pandemic has had a significant psychological impact on the population, causing fear and uncertainty [5]. In Iran, specifically, there has been compounded by a concerning lack of trust in the healthcare system [6]. As a result, people are hesitant to visit healthcare facilities, which could lead to delayed visits to emergency departments and worse outcomes [7]. Moreover, there may be hidden deaths associated with COVID-19 that are not captured in reports from the World Health Organization, due to factors such as underdiagnosis from low-sensitivity tests and faulty testing strategies. The concept of excess death can be used to measure both the direct and indirect effects of a health crisis, such as the COVID19 pandemic, beyond regular death rate estimates that only account for deaths related to the underlying cause of the crisis [8,9]. In this study, we aimed to determine the number of excess deaths that occurred during the first year of the COVID-19 pandemic in southern Iran.
METHODS
Data Repositories
This ecological study aimed to determine the excess death count in southern Iran during the first year of the COVID-19 pandemic (February 20, 2020 to February 19, 2021) using 2 different methods. The study population consisted of around 5 000 000 individuals living in the regions under the coverage of the Shiraz University of Medical Sciences in Fars Province.
For this study, we collected weekly death counts by linking 2 data repositories, using the national identification number as the common identifier. The first repository used was the National Death Registry (NDR), from which we obtained individualized data on reported deaths, as well as their underlying cause (identified by International Classification of Diseases, 10th revision codes) and date. We retrieved weekly datasets from the NDR for the first year of the COVID-19 pandemic and the preceding 5 years, with a similar time frame. The study also utilized a second repository, the Medical Care Monitoring Center (MCMC), which is an administrative database that contains information on all hospitalizations, between-ward transfers, and between-hospital transfers due to suspected COVID-19. The purpose of this dataset was to recheck the causes of death during the first year of the COVID-19 pandemic since some deaths attributed to COVID-19 may have been misclassified as other causes of death in the NDR.
Initially, deaths that occurred in the hospital and were recorded in the MCMC repository were used to confirm COVID-19 as the cause of death for patients who had been linked to the NDR repository. Individuals who had been linked to the MCMC repository, discharged from COVID-19 wards, but died within 30 days (30-day COVID-19 deaths), were also considered COVID-19-related deaths, regardless of the cause of death reported in the NDR repository [10]. Lastly, the individualized data were converted into weekly data for all-cause death counts, which were then categorized by age group, sex, and the most common underlying causes such as COVID-19, cardiovascular diseases, endocrine/metabolic/nutritional diseases, infectious diseases, gastrointestinal diseases, chronic respiratory diseases, and unintentional accidents.
Statistical Analysis
The first model utilized to estimate excess death was the P-score, which is a simple measure of excess death, calculated based on the assumption that the expected number of deaths within a given time frame is equivalent to the average death count in the same time frame of the preceding years, usually with a 5-year rule of thumb [11,12]. Accordingly, the difference between the observed weekly death count during the first year of the COVID-19 pandemic and the expected weekly death count was used to calculate the weekly excess death count [13]. Then, the P-score was calculated as the ratio of the excess to the expected, expressed as a percentage, using the following formula [14]:
P-score=[(Cumulative observed deaths–Cumulative expected deaths)/Cumulative expected deaths]×100
Since the P-score implicitly considers both the population size and the age structure, to calculate excess deaths, there is an assumption that the population structure of the region should have a fixed rate of natural increase and invariable age and sex distributions—representing a stable population—during the last 5 years before and 1 year after the occurrence of a massive intervention or interruption (i.e., the COVID-19 pandemic in our study). By definition, such stable populations exhibit stable age-specific fertility and mortality rates over time. In this respect, Fars Province did not experience substantial population changes from 2015 to 2020 (from approximately 4 800 000 residents in 2015 to 5 000 000 residents in 2020, with an annual +0.98% population growth rate) or any prominent migratory exchanges [15].
The second model was an interrupted time series (ITS) quasi-Poisson regression model, which was utilized to estimate the mean relative risk (RR) with a 95% confidence interval (CI) of death during the first year of the pandemic. We utilized the “its_poisson()” function of the “its2es” R version 4.2.2 (R Foundation for Statistical Computing, Vienna, Austria). The ITS model compares the fitted, or observed, values with the predicted counterfactual values (expected values if the pandemic had not occurred) [16]. The counterfactual is predicted by extrapolating the pre-interruption trend into the post-interruption period. Each post-interruption time point in the counterfactual model is predicted using the regression equation (the dotted line, perpendicularly above the fitted model). The fitted model uses the actually observed post-interruption values (the regression line) [17]. Then, the pointwise RR can be calculated by dividing each post-interruption time point’s fitted value by the counterfactual value. Through averaging these RRs, the mean RR is obtained [16]. To account for overdispersion in the Poisson regression, the “over_dispersion” argument was included in the model. In addition, we included seasonal adjustment using Fourier terms. It is worth noting that Poisson regression tends to yield overestimates (i.e., overdispersion) [16]. Furthermore, we also performed 2 different sets of sensitivity analyses on sex and age groups (0-4, 5-19, 20-34, 35-49, 50-64, and ≥65 years old), which are known to have different mortality risks among COVID-19 patients, to avoid the problem of dimensionality.
Ethics Statement
In this study, the aggregated counts of deaths were acquired; that is, no individual data were involved in the design, conduct, or reporting, or dissemination plans of this research. Therefore, we believe that patient consent for publication is not applicable.
RESULTS
In the first year of the COVID-19 pandemic, the number of observed deaths was 22 307, and the expected death count was estimated at 16 736. Therefore, the all-cause excess death count during this period was 5571 (P-score=33.29%). The excess death P-score was higher among females (34.87%) and in older age groups (i.e., 42.59% in the 50-64-year-old age group and 46.27% in the ≥65-year-old age group). Out of the total excess deaths, 2676 (48.03%) could be directly attributed to COVID-19. The highest excess death P-scores were for infectious diseases other than COVID-19 (40.21%), endocrine/nutritional/metabolic diseases (33.27%), and cardiovascular diseases (16.22%) (Table 1). Figure 1 illustrates the weekly trends of observed and expected death counts, as well as the P-scores, during the first year of the COVID-19 pandemic.

Total, sex-stratified, and age-stratified estimated all-cause and disease-specific excess death counts using the averaged 5-year method and the interrupted time series model during the first year of the COVID-19 pandemic in southern Iran
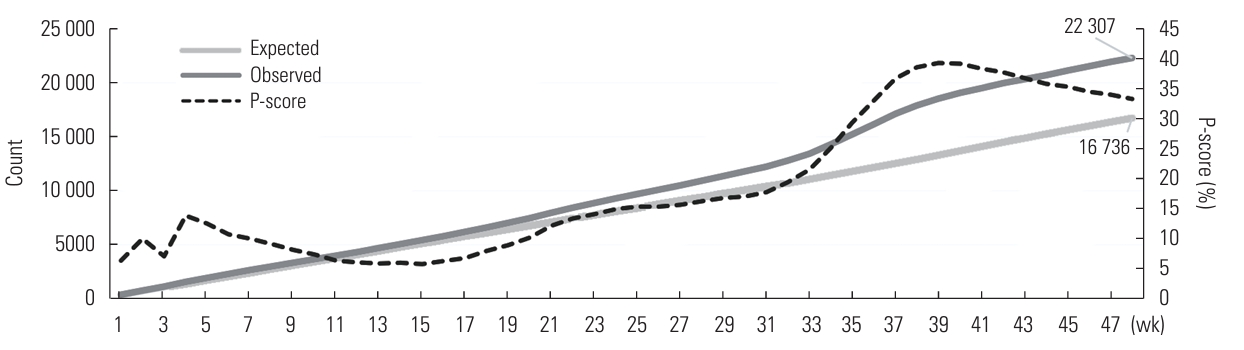
Expected and observed all-cause death counts during first year of the coronavirus disease 2019 pandemic.
The ITS analysis showed that the first year of exposure to the COVID-19 pandemic resulted in an increased all-cause death count (RR, 1.26; 95% CI, 1.19 to 1.33; p<0.001) (Figure 2A). This significant increase was observed in both males (RR, 1.28; 95% CI, 1.21 to 1.36; p<0.001) and females (RR, 1.23; 95% CI, 1.16 to 1.31; p<0.001), across all age groups, including the 35-49-year-old age group (RR, 1.21; 95% CI, 1.12 to 1.32; p<0.001), the 50-64-year-old age group (RR, 1.38; 95% CI, 1.28 to 1.49; p<0.001), and the ≥65-year-old age group (RR, 1.21; 95% CI, 1.16 to 1.37; p<0.001). Interestingly, during this period, the all-cause death count showed a significant decrease in the 0-4-year-old age group (RR, 0.74; 95% CI, 0.66 to 0.85; p<0.001) (Table 1, Supplementary Material 1 [Panel One]).
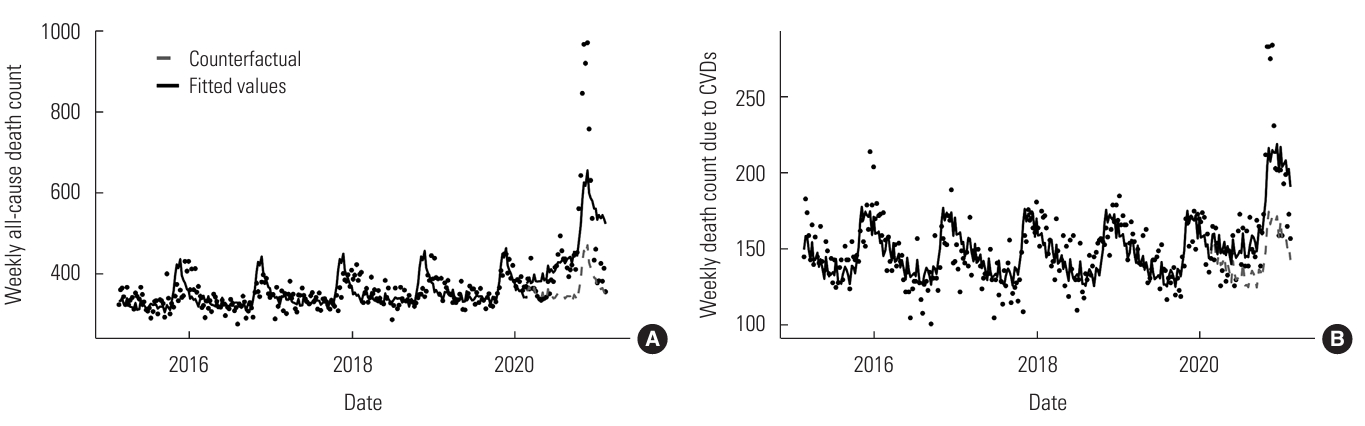
Interrupted time series plots of (A) the weekly all-cause death count and (B) the weekly death count due to cardiovascular diseases (CVDs) during the first year of the coronavirus disease 2019 pandemic and the preceding 5 years in southern Iran.
Furthermore, the number of excess deaths from cardiovascular diseases was significantly higher during the first year of the pandemic (RR, 1.17; 95% CI, 1.11 to 1.22; p<0.001; Figure 2B). Conversely, a significant decrease was observed in excess deaths from chronic respiratory diseases (RR, 0.72; 95% CI, 0.65 to 0.81; p<0.001) and cancers (RR, 0.85; 95% CI, 0.80 to 0.90; p<0.001). The ITS plots for underlying causes of death can be found in Table 1 (Supplementary Material 1 [Panel Two]).
DISCUSSION
This study found that there were 5571 excess deaths in southern Iran from February 20, 2020 to February 18, 2021, with a P-score of 33.29% using the 5-year method and a RR of 26% using ITS analysis. While there was little difference in the excess death count between males and females, the count increased significantly with age. Similar studies have also shown an increase in all-cause mortality during the same time period. For instance, Travis-Lumer et al. [16] used an ITS model to assess the change in all-cause mortality rate in Israel during the first 15 months of the pandemic and reported a smaller increase compared to our study (RR, 1.11 vs. 1.26). Scortichini et al. [18] conducted a 2-stage ITS analysis to estimate excess deaths during the initial 3 months of the COVID-19 pandemic in Italy. Their study found a 29.5% increase in expected mortality. Furthermore, their research showed a minor difference in the excess death count between males and females (32.1 vs. 27.7%), with a higher difference in the excess death count in older age groups. Similarly, Sandrini et al. [19] used the averaged 5-year method to calculate all-cause mortality during the first 4 months of the COVID-19 pandemic in Milan and Lodi Provinces, Italy, in the same calendar period. They found a significant increase in excess deaths, with an increasing trend with age (48.8%; RR, 1.49). This substantial increase in all-cause mortality could be attributed to COVID-19 and other diseases that may have been influenced by the pandemic, such as disease complications (e.g., myocarditis, myocardial infarction, and exacerbated heart failure) [4,20], late referral to the hospital, reluctance to be admitted by patients or their caregivers [7], increased burden on medical facilities and healthcare workers in COVID-19 units and wards, neglect of routine care delivery by the surveillance system provided before the pandemic, psychological distress due to the disease [21], and the impact of lockdowns, fears, rumors, and misinformation regarding the pandemic that spread in the society and social media [22]. Korea’s approach to the COVID-19 pandemic has been successful in preventing an increase in the excess death count. This success may be attributed to the country’s early and extensive testing, comprehensive epidemiological investigations, and the implementation of high levels of mitigating actions, such as lockdowns, social distancing, personal hygiene, and mask-wearing [23].
We found that fewer than half (48.03%) of all excess deaths due to COVID-19 could be directly linked to the disease. This suggests that there was a significant number of non-COVID-19-related excess deaths, which are just as important as the confirmed COVID-19 deaths. Essentially, for each registered COVID-19 death, we estimated that there were 1.08 additional excess deaths in comparison to what would be expected under normal circumstances. The “COVID-19 Excess Mortality Collaborators” [24] also reported a similar finding that 48.18% of excess deaths in Iran between January 1, 2020 and December 31, 2021, could be linked to COVID-19. The proportion of registered COVID-19 deaths to all-cause excess deaths varied widely across countries, ranging from 30% to 197% [25]. We believe that these discrepancies could be attributed to differences in healthcare systems, policies, internal affairs, geopolitical crises, freedom of journalism, and the level of transparency in reporting. This highlights the importance of considering the indirect effects of a health crisis alongside the direct effects. An important lesson that should be learned from the early-era COVID-19 strategies is that the influx of patients into healthcare facilities should not lead to neglect of routine care delivery.
We observed a significant 17% increase in deaths due to cardiovascular diseases during the first year of the COVID-19 pandemic, and cardiovascular diseases constituted the most prevalent non-COVID-19 cause of excess deaths. Han et al. [26] used a negative binomial log-linear regression model to estimate excess cardiovascular deaths in the United States during the first 2 years of the pandemic and found a lower excess death rate of 4.9% than that of our study. A similar finding was also reported by Mountantonakis et al. [27] in New York, United States. The difference in findings could be attributed to 2 main reasons. Firstly, the indirect health effects of COVID-19, such as fear, beliefs, delayed lockdowns, disruption of cardiovascular services, and shortages, may cause cardiovascular symptoms, resulting in patients ignoring or delaying visits to healthcare providers and being neglected by the health system. Secondly, cardiovascular events related to COVID-19, particularly acute events such as ischemic heart disease, hypertensive disease, cerebrovascular disease, and myocarditis [25], are possible during the course of the disease or after recovery.
Furthermore, we found that there was a significant reduction in the risk of excess deaths for chronic respiratory diseases and cancers, with a decrease of 28% and 15%, respectively. Similarly, Oh et al. [23] conducted a 2-stage ITS analysis in Korea and reported a decrease of 12.8% in excess deaths due to respiratory diseases during the first 11 months of the COVID-19 pandemic. Interestingly, we observed a 26% decrease in the all-cause death count in the 0-4-year-old age group. Negative excess mortality among under-5 children has been reported in data analyses of 80 countries, according to civil registration and vital statistic systems and health management information systems, indicating no significant changes or fewer observed deaths for 2020 when compared with expected mortality for this age group using historical data [28]. Moreover, a population-based cohort study on all child deaths in England found an 11% reduction (RR, 0.89; 95% CI, 0.84 to 0.93) in all-cause mortality during the first year of the COVID-19 pandemic, compared with the expected mortality rate using the previous year’s data. This observation might be attributed to improvements in hand washing and a reduction in the expected “winter increase in deaths,” and the subsequent reduction in circulation and transmission of infections agents, in addition to the inherent rarity of COVID-19 deaths in this age group during the first year of the pandemic [29].
Limitation
Although the current study utilized both simple and robust time series models to estimate excess deaths, we were unable to explore the proportions of different mechanisms contributing to the excess deaths caused by the pandemic. Furthermore, our investigation only covered the first 12 months of the pandemic, limiting our ability to address the potential long-term direct and indirect effects on mortality.
Supplemental Materials
Supplemental material is available at https://doi.org/10.3961/jpmph.23.198.
Interrupted time series plots of the weekly all-cause death count in sexes and different age groups
Panel One; [A] males, [B] females, [C] 0-4 years old age group, [D] 5-19 years old age group, [E] 20-34 years old age group, [F] 35-49 years old age group, [G] 50-64 years old age group, and [H] ≥ 65 years old age group), and the weekly death count due to various causes of death
Panel Two; [I] chronic respiratory diseases, [J] cancers, [K] gastrointestinal diseases, [L] infectious diseases [COVID-19 excluded], [M] endocrine/nutritional/metabolic diseases, and [N] unintentional accidents) during the first year of COVID-19 pandemic and the preceding 5 years in Southern Iran
Notes
Data Availability
The data repositories generated during this study are not publicly available, but they can be obtained from the corresponding author upon reasonable request to the Vice Chancellor of Research at Shiraz University of Medical Sciences.
Conflict of Interest
The authors have no conflicts of interest associated with the material presented in this paper.
Funding
This research project received financial support from the Deputy of Research and Technology at Shiraz University of Medical Sciences, Iran, under grant No. 99-7848.
Author Contributions
Conceptualization: Zakeri M, Heiran A, Mirahmadizadeh A. Data curation: Azarbakhsh H, Janfada M, Moftakhar L. Formal analysis: Heiran A, Mirahmadizadeh A, Sharafi M. Funding acquisition: Zakeri M. Methodology: Heiran A, Mirahmadizadeh A, Sharafi M, Zakeri M. Project administration: Heiran A, Mirahmadizadeh A. Visualization: Heiran A, Mirahmadizadeh A, Sharafi M. Writing – original draft: Dehghani SS, Moradian MJ, Sharafi M, Janfada M, Azarbakhsh H. Writing – review & editing: Heiran A, Mirahmadizadeh A, Moftakhar L, Zakeri M.
Acknowledgements
None.