Associations of Socioeconomic Status With Depression and Quality of Life in Patients With Hypertension: An Analysis of Data From the 2019 Community Health Survey in Korea
Article information

Abstract
Objectives
We aimed to identify the factors related to depression and quality of life in patients with hypertension by using multilevel regression analysis.
Methods
In 2019, 229 043 participants in the Korean Community Health Survey were selected as the study group. Individual factors were identified using data from the 2019 Community Health Survey. Regional factors were identified using data from the National Statistical Office of Korea. Multilevel regression analysis was conducted to find individual and local factors affecting depression and quality of life in patients with hypertension and to determine any associated interactions.
Results
As individual factors in patients with hypertension, women, those with lower education-levels, recipients of basic livelihood benefits, and those with poor dietary conditions showed stronger associations with depression and quality of life. As regional factors and individual-level variables in patients with hypertension, lower gross regional personal income, fewer doctors at medical institutions, and lower rates of participation in volunteer activities presented stronger associations with depression and quality of life. In addition, the associations of depression with gross regional personal income, the number of doctors at medical institutions, and dietary conditions were significantly stronger in patients with hypertension than in patients without hypertension. The associations of gender and employment status with quality of life were also significantly greater.
Conclusions
Policy interventions are needed to adjust health behaviors, prevent depression, and improve quality of life for patients with hypertension, especially for those with the risk factors identified in this study.
INTRODUCTION
The prevalence of hypertension, a common chronic disease, among adults aged 30 or older increased from 24.6% in 2007 to 29.0% in 2012 [1] and is expected to continue increasing. According to the National Statistical Office, the prevalence of hypertension decreased from 29.8% in 1998 to 24.5% in 2007, after rising from 25% to 29%. Recent increases in chronic diseases are expected to increase the social and economic burden of disease [2], though little research on this has been conducted in Korea.
International studies have reported that socioeconomic determinants are associated with hypertension [3]. Furthermore, recent studies have also reported a close relationship between chronic diseases such as hypertension and the onset of depression. A recent meta-analysis by Li et al. [4] showed that 26.8% of patients with hypertension also had depression. In addition, hypertension, when compared to normal blood pressure, has been reported to be a major influencing factor that can lower health-related quality of life for patients with hypertension [5]. A comparison of the health-related quality of life in patients with hypertension to that of people with normal blood pressure found that the quality of life in patients with hypertension was significantly lower [6]. However, these studies were limited to the association between hypertension and other diseases. There is a lack of research on the associations of socioeconomic status (SES) with depression and quality of life in patients with hypertension.
Since individuals have relationships with their surroundings based on the area in which they reside, it is important to understand the effects of community characteristics on individual health and health behaviors [7]. Since it is known that regional social factors can affect health, it is important to accurately select the scope of the region and accurately conceptualize and measure the path by which regional factors can affect health by using multiplelevel analysis [8]. Logistic regression analysis was used for the their domestic study of the effects of hypertension on depression [9], and multiple regression analysis was used to identify the factors affecting health-related quality of life in patients with hypertension [10]. Moon et al. [11] conducted a multilevel analysis of the effect of individual and regional factors on depression, but did not focus on patients with hypertension. However, domestic studies continue to measure the differences between regions by analyzing regional and individual variables on the same level [12]. Few studies have utilized multilevel regression analysis; thus, most previous studies were limited because: (1) the effects of hypertension on depression and quality of life were analyzed on the same level, and (2) they lacked a multilevel analysis considering regional effects. If there are differences between regions that affect depression and quality of life, research on the factors that affect such differences is needed. A comprehensive analysis of both individual and regional factors that are associated with depression and quality of life is also warranted. In addition, it is necessary to study the associations of socioeconomic characteristics in patients with hypertension with depression and quality of life. Therefore, the aim of this study was to determine the association of socioeconomic factors and community factors in patients with hypertension with their depression and quality of life using multilevel analysis. The relationships of socioeconomic factors and hypertension with depression and quality of life were also examined.
METHODS
Study Population and Data
This study analyzed individual data and regional data. Data collected from a Community Health Survey performed in 2019 in Korea were used as individual data. Subjects answered “no” or “yes” to the question “Have you ever been diagnosed with high blood pressure by a doctor?”. The study sample included 65 601 people with hypertension and 163 442 people without hypertension. After excluding those with missing values, 229 043 respondents to the 2019 Community Health Survey were included in the final analysis of this study. For regional data, e-local indicators of statistical data provided by the Statistics Korea in Korea were used [13].
Dependent Variables
Depression was scored 0 for “no” and 1 for “yes” for the question, “Have you ever felt sad or hopeless enough that it interferes with your daily life for 2 consecutive weeks in the past year?”. The EuroQol-5 Dimention (EQ-5D) index is a tool developed by the EuroQol Group to assess general health levels. It consists of responses to 5 items: mobility, self-care, daily activities, pain/discomfort, and anxiety/depression at 3 levels: “no problem,” “some problems,” and “severe problems.” Weights were applied to each of these 5 items to obtain the EQ-5D index score, a health-related quality-of-life score distributed between full health (1 point) and the lowest level of health before death (−1 point). Death is scored as 0 points. Based on 25% of the total, the Quality of Life Index was categorized as 0 for “no” quality of life degradation (Quality of Life Index between 0.91 and 1.00) and 1 for a “yes” response regarding degradation (Quality of Life Index between-0.20 and 0.91).
Independent Variables
Individual variables were selected based on previous studies of their association with depression and quality of life [9,10,14–16]. Individual demographic and sociological factors included gender, age, and socioeconomic factors such as education-level, employment status, basic livelihood benefits (yes/no), and dietary conditions. Regional variables were the socioeconomic factors of 17 cities and provinces. These factors were based on regional impact factor studies using majority-level analysis and included gross regional personal income, number of doctors available at medical institutions (per 1000 people), financial autonomy ratio, rate of participation in volunteer activities, and single-person household ratio [11,17,18].
Statistical Analysis
To examine the association of socioeconomic factors to depression and quality of life in patients with hypertension, a weighted frequency analysis was conducted with individual and household weights applied to individual variables, and simple frequency analysis was conducted for regional variables. For the multilevel analysis of regional variables, 5 regional variables were added to increase the rigor of the research model. This was based on the fact that the average number of regional variables was 4.64 in a paper that systematically reviewed 128 documents using multilevel analysis in the healthcare field, and that if more regional variables than necessary were used, results might be distorted due to multicollinearity between variables. As an alternative to identifying multicollinearity problems between variables, we conducted Spearman correlation analysis for continuous variables. The correlation coefficient between the rate of participation in volunteer activities and the ratio of single-person households was the highest at 0.654. Thus, it was judged that the correlation coefficient between variables was not too high for a multilevel analysis. Using basic statistics from the regional factors, it was found that there were statistically significant differences in depression and quality of life for both the individual and regional factors of patients with hypertension. A multilevel analysis, which can consider the characteristics of individual-level and regional-level at the same time, consists of (1) a basic model, (2) a model containing only individual variables, and (3) a model containing both individual and regional variables. Intraclass correlation coefficients (ICCs) were analyzed to determine whether the research model was suitable for multilevel analysis. The ICC is an indicator of inter-regional heterogeneity or intra-regional homogeneity. It represents the proportion of regional variance to the total variance of dependent variables, which can also be understood as the variance explained by inter-regional differences [19]. A larger ICC suggests a higher explanatory power of individual and regional characteristics affecting the dependent variable [20]. Using the GLIMMIX procedure of the statistical program SAS version 9.4 (SAS Institute Inc., Cary, NC, USA), a multilevel logistic regression analysis that could simultaneously consider individual and regional characteristics was performed.
The independent variables included dietary conditions, gross regional personal income, the number of doctors available at medical institutions, and the rates of participation in volunteer activities, which were significantly correlated with depression, while gender and employment levels were significantly correlated with quality of life. Simple linear regression analysis was used to compare patients with hypertension to those without hypertension.
Ethics Statement
The Office of Research Integrity and Compliance Institutional Review Board at the Kangwon National University exempted the inspection of this study.
RESULTS
Prevalence of Depression and Quality of Life by Socioeconomic Status in Patients With Hypertension
To examine whether there were differences in the prevalence of depression and in quality of life according to the socioeconomic factors of patients with hypertension, a weighted frequency analysis was conducted with weights applied to individual socioeconomic factors. Simple frequency analysis was conducted without weights for regional variables (Table 1). Overall, the prevalence was higher in patients with hypertension than in patients without hypertension. The prevalence of depression was higher, and the quality of life was lower for those with lower education-levels, an employment status corresponding to non-economic activity, poor dietary conditions, and for those who received livelihood benefits.
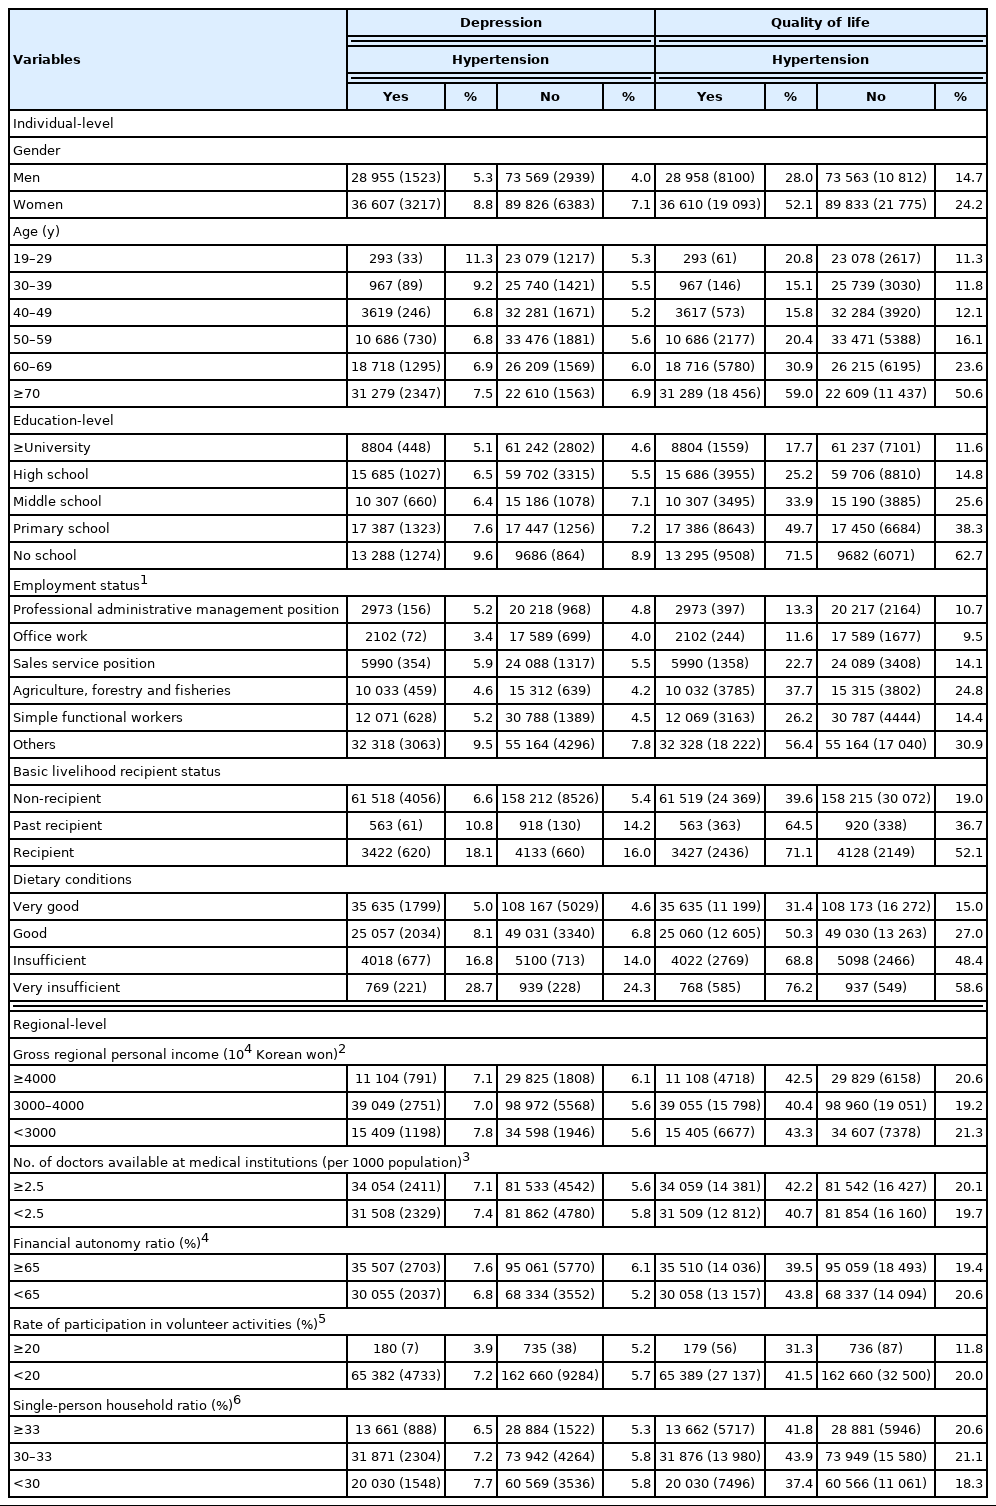
Prevalence of depression and quality of life by socioeconomic status in patients with hypertension
Association of Socioeconomic Status With Depression in the Multilevel Analysis
The results of the multilevel analysis to identify the association between SES and depression are presented in Table 2. In model 1, the associations of individual variables with depression were examined. The analysis showed that women, those with lower levels of education, benefit recipients, and those with poor dietary conditions had the highest depression scores. In model 2, the associations of both individual variables and regional variables with depression were analyzed. Regarding regional variables, lower gross regional personal income, a lower number of doctors available at medical institutions, and lower rates of participation in volunteer activities were significantly associated with higher levels of depression. Overall, dietary conditions, gross regional personal income, the number of doctors available at medical institutions, and the rate of participation in volunteer activities showed stronger associations with depression in patients with hypertension than in patients without hypertension.
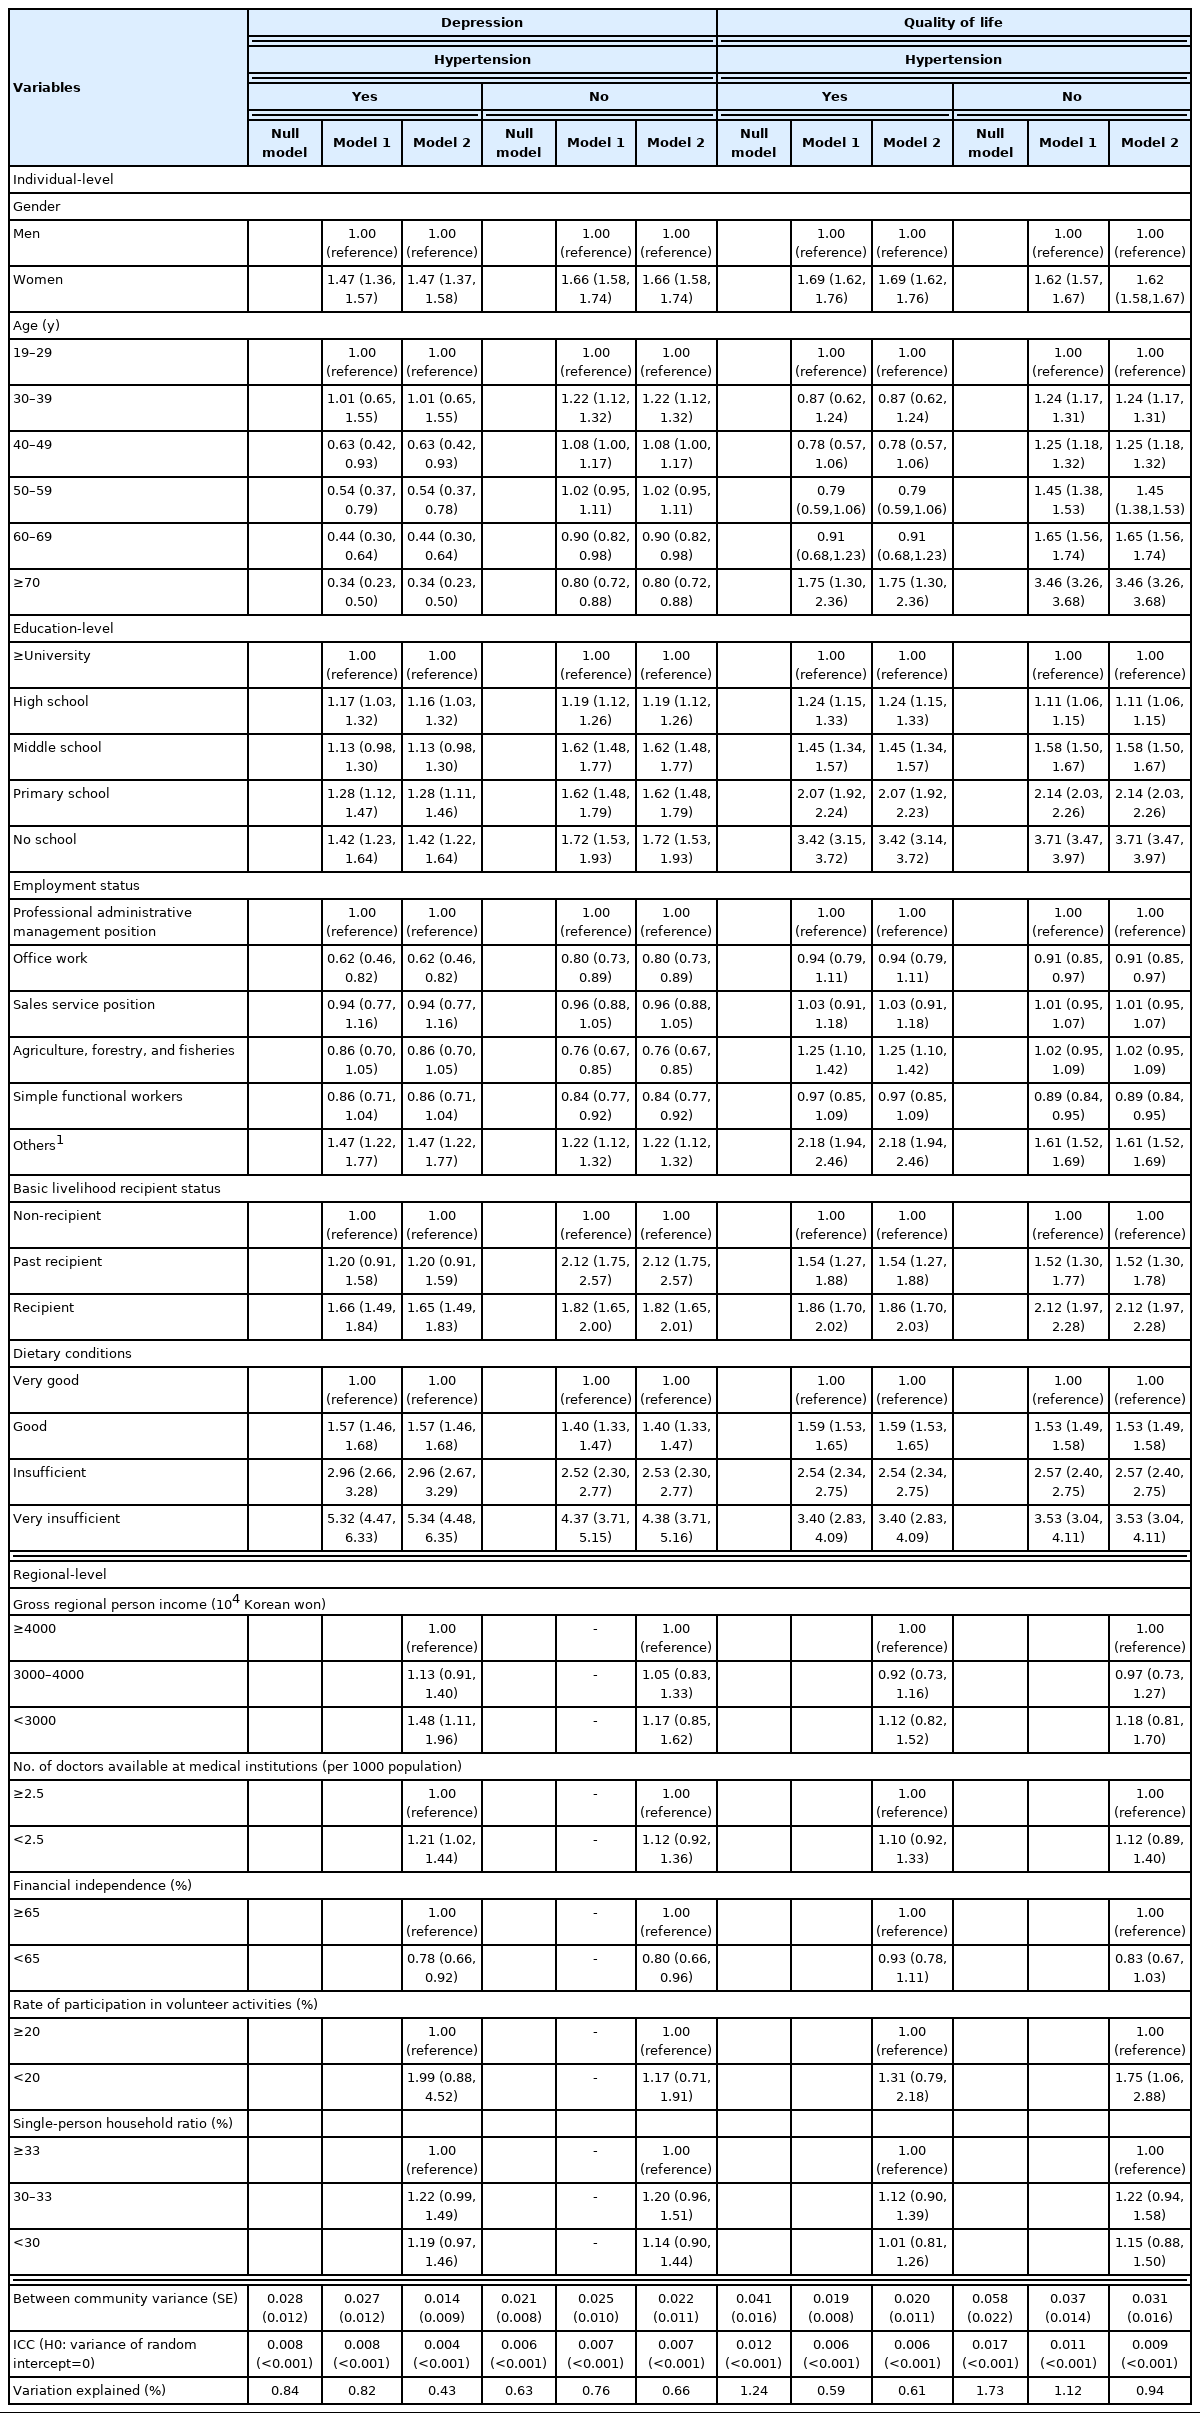
Multilevel analysis of socioeconomic status affecting depression in patients with and without hypertension
Association of Socioeconomic Status With Quality of Life in the Multilevel Analysis
The results of the multilevel analysis to determine the association between SES and quality of life are presented in Table 2. In model 1, the associations of all individual variables with diminished quality of life were examined. The results of our analysis showed that women, those with lower levels of education, benefit recipients, and those with poor dietary conditions had the highest reductions in quality of life. In model 2, the associations of both individual variables and regional variables with reduced quality of life were analyzed. Regarding regional variables, those with lower gross regional personal income, a lower number of doctors available at medical institutions, and lower rates of participation in volunteer activities were associated with the highest reductions in quality of life, although the decline was not statistically significant. Overall, gender and employment status showed stronger associations with quality of life in patients with hypertension than in patients without hypertension.
Interrelationships of Hypertension With Depression and Quality of Life
Table 3 shows the results of univariate logistic regression analysis to confirm the correlations of hypertension with SES, depression, and quality of life. The results revealed that the risk of depression was significantly higher in patients with hypertension with poor dietary conditions, those with lower gross regional personal income, a lower number of doctors available at medical institutions, and a lower rate of participation in volunteer activities. In other words, depression was closely related to SES and underlying diseases such as hypertension. Furthermore, the risk of deterioration in quality of life was significantly higher in patients with hypertension who were women and those with non-economic activities compared to groups without hypertension. In other words, quality of life was closely related to SES and the presence of underlying diseases, such as hypertension.
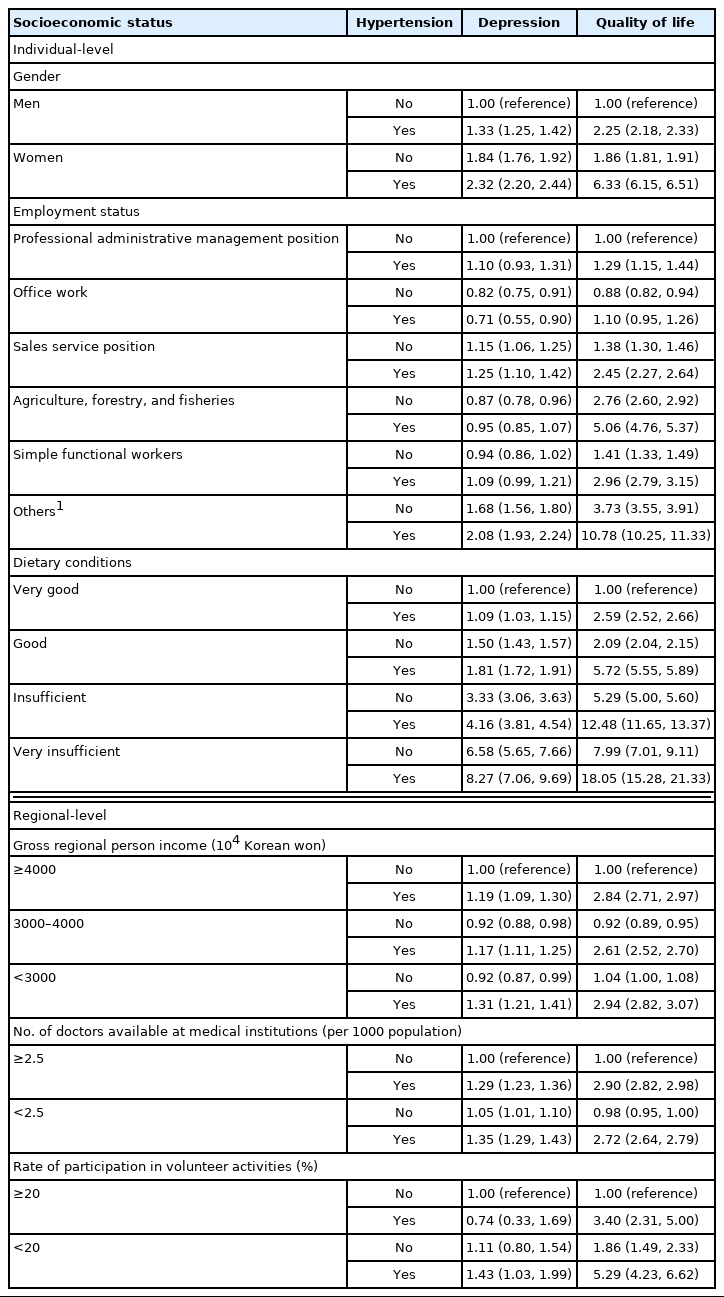
Interrelationships of depression and quality of life in patients with hypertension
DISCUSSION
In this study, the associations of SES at the individual and regional levels with depression and quality of life for patients with hypertension aged 19 years and over were investigated. The presence of interconnected relationships among depression, quality of life, SES, and hypertension was confirmed.
The regional variable basic model (null model) was used to estimate the ICC, as a measure of the ratio of variance at each regional-level to the total variance with respect to depression and quality of life, and it was confirmed that there was an interregional variation of 0.84% for depression and 1.24% for quality of life. The fit of the model was found to be significant, rejecting the hypothesis that the variance of the random intercept was zero.
The ICCs for individual variance and regional variance in the association with depression were 0.82% and 0.43%, respectively, and 0.59% and 0.61% respectively, in the association with quality of life. In general, social science studies consider an ICC value >5% to be a significant difference [21]. However, researchers believe that multilevel analysis is possible despite a low ICC [20]. In this study, a low explanatory power was found for individual and regional variables in patients with hypertension with respect to depression and quality of life. Despite these limitations, this study suggests that there are significant variables at the individual-level and regional-level for patients with hypertension based on the results of the multilevel analysis. Other studies have also reported that individual and regional variables in patients with hypertension were associated with depression and quality of life.
Previous studies on the association of patients’ depression and quality of life with hypertension have shown that patients with hypertension have twice the risk of developing depression [22]. Physical functions, including the daily activities of patients with hypertension, have been found to be highly related to the health-related quality of life [23–25]. According to a study on depression in patients with hypertension, a high quality diet was a protective factor for depression in patients with hypertension [26]. Unhealthy lifestyle habits such as poor quality diets were risk factors for both depression and hypertension [16], indicating that poor dietary conditions are related to higher degrees of depression in patients with hypertension. Local income inequality has also been shown to affect depression [17], and volunteer activities is associated with hypertension [27], and participation in volunteer activities has been confirmed to alleviate depression [18]. The present study also found a higher risk of depression among patients with hypertension who reported poor dietary conditions, low gross regional personal incomes, and low rates of participation in volunteer activities. According to a Swedish study on the quality of life in patients with hypertension, men had a higher quality of life than women [28]. In addition, those with high-status jobs [10] had a higher health-related quality of life. The present study also found lower quality of life for women patients with hypertension and those with a low employment status.
In our study, certain results were in conflict with the overall general results or were inconsistent with other research findings. Although it has been reported that, at the regional-level, a high number of doctors available at medical institutions is associated with high levels of depression in patients with hypertension [11], in this study, a low number of doctors available at medical institutions was associated with higher levels of depression. In addition, a study on the financial independence of patients with hypertension, found that lower financial independence was related to higher levels of depression [11]. However, in this study, lower financial independence was associated with lower levels of depression. The reason for this difference might be that depression and quality of life were subjectively evaluated by individuals, resulting in the answers being influenced by personal factors.
In terms of research methodology, Jeon et al. [29] conducted multiple logistic regression analysis to identify the factors related to depression in patients with hypertension, logistic regression analysis was used for the their domestic study of the effects of hypertension on depression [9], and multiple regression analysis was used to identify the factors affecting health-related quality of life in patients with hypertension [10]. Moon et al. [11] performed a multilevel analysis on the effect of depression, but did not focus on patients with hypertension.
While there are many individual-level studies on the association between patients with hypertension and depression or quality of life, few studies have conducted multilevel analysis at the regional-level, and further studies are needed. This study was based on the socioeconomic theory of community health determinants and the individual characteristics of depression and quality of life; therefore, it integrated and analyzed regional indicators as well as individual indicators. Both individual factors and regional factors were associated with depression and quality of life. An analysis of the interrelationship of hypertension with depression and quality of life confirmed that depression and quality of life were closely related to SES and underlying diseases such as hypertension.
This study had some limitations. First, this study was based on data from a specific year; therefore, subsequent changes at the individual or local socioeconomic level and changes in hypertension levels were not considered. Because there was no Community Health Survey or questionnaire on the Quality-of-Life Index in 2020, only 2019 data were analyzed. Second, the gross regional personal income variable was not distinguished by level (city, county, and district levels). Therefore, to provide overall uniformity, the analysis was done based on city-level incomes. Third, regional-level factors associated with depression and quality of life were reflected in the study to an insufficient extent. Thus, follow-up studies that supplement these limitations should be conducted in the future.
Despite these limitations, this study considered the association of SES in patients with hypertension with depression and quality of life. Based on the inclusion and analysis of regional variables, this study suggests that the establishment of regional policies is necessary. Therefore, this study makes a significant contribution. Future studies, with additional indicators that better reflect regional characteristics could provide a more detailed evaluation and reflect individuals’ period of residence in each city and province. In addition, attention at the local level as well as the individual-level is necessary for disease mitigation in the future. Through this study, it was confirmed that poor dietary conditions, low personal gross income by region, and a low number of doctors available at medical institutions in women patients with hypertension were associated with higher levels of depression. In addition, it was confirmed that women gender and low employment status were associated with a lower quality of life among patients with hypertension. Policy interventions are needed to adjust health behavior factors, prevent depression, and improve quality of life. Therefore, a policy intervention study needs to be conducted in the future to address these factors that affect patients with hypertension.
Notes
CONFLICT OF INTEREST
The authors have no conflicts of interest associated with the material presented in this paper.
FUNDING
This research was supported by a grant from the Korea Health Technology R&D Project through the Korea Health Industry Development Institute (KHIDI), funded by the Ministry of Health & Welfare, Republic of Korea (grant No. HI19C1320). This study was supported by a 2017 Research Grant from Kangwon National University (No.520170451).
ACKNOWLEDGEMENTS
We thank all participants who participated in the Community Health Survey organized by the Korea Disease Control and Prevention Agency.
Notes
AUTHOR CONTRIBUTIONS
Both authors contributed equally to conceiving the study, analyzing the data, and writing this paper.