The Primary Process and Key Concepts of Economic Evaluation in Healthcare
Article information

Abstract
Economic evaluations in the healthcare are used to assess economic efficiency of pharmaceuticals and medical interventions such as diagnoses and medical procedures. This study introduces the main concepts of economic evaluation across its key steps: planning, outcome and cost calculation, modeling, cost-effectiveness results, uncertainty analysis, and decision-making. When planning an economic evaluation, we determine the study population, intervention, comparators, perspectives, time horizon, discount rates, and type of economic evaluation. In healthcare economic evaluations, outcomes include changes in mortality, the survival rate, life years, and quality-adjusted life years, while costs include medical, non-medical, and productivity costs. Model-based economic evaluations, including decision tree and Markov models, are mainly used to calculate the total costs and total effects. In cost-effectiveness or cost-utility analyses, cost-effectiveness is evaluated using the incremental cost-effectiveness ratio, which is the additional cost per one additional unit of effectiveness gained by an intervention compared with a comparator. All outcomes have uncertainties owing to limited evidence, diverse methodologies, and unexplained variation. Thus, researchers should review these uncertainties and confirm their robustness. We hope to contribute to the establishment and dissemination of economic evaluation methodologies that reflect Korean clinical and research environment and ultimately improve the rationality of healthcare policies.
INTRODUCTION
Economic evaluation is the process of deciding which alternative will produce the best results within a specific budget by comparing and analyzing the costs and outcomes associated with each alternative.
After introducing the positive listing system for pharmaceuticals in 2006, pharmaceutical companies were required to submit economic evaluation results of new drugs for them to be included in National Health Insurance (NHI) benefits [1]. Thereafter, economic evaluations in healthcare have expanded beyond pharmaceuticals to medical interventions, such as diagnoses and procedures. Economic efficiency is also a critical criterion when introducing new items to the National Immunization Program or the National Health Screening Program. Furthermore, economic evaluations alongside clinical research for evidence-based medicine, are being increasingly conducted. Consequently, the requirement for objective and consistent economic evaluation is increasing.
The Health Insurance Review and Assessment Service (HIRA) recently revised the Guidelines for Economic Evaluation of Pharmaceuticals in 2021; however, these guidelines’ use is limited because they were prepared only for the appraisal of pharmaceuticals for NHI benefit registration [2]. Thus, a manual has been developed for economic evaluation in various healthcare fields, such as diagnosis, procedure, vaccination, and screening, with support from the National Evidence-based Healthcare Collaborating Agency (NECA). The purpose of this manual was to provide practical and specific techniques for economic evaluations. This study introduces the content of this manual dealing with the primary process and key concepts of economic evaluation in healthcare.
THE PROCESS FOR CONDUCTING AN ECONOMIC EVALUATION
The process for conducting an economic evaluation include economic evaluation planning, outcome and cost calculation, modeling, cost-effectiveness results, uncertainty analysis, and decision-making. Outcome and cost calculations can be performed iteratively, complementing each other. Next, we discuss each of these steps in detail.
Planning an Economic Evaluation
Before planning an economic evaluation, it is helpful to review previous studies with similar purposes or that have been conducted in the same clinical field.
Study population
The study population can be defined based on the epidemiological characteristics of patients with a given disease (sex, age, etc.), comorbidities, or risk factors. The costs and outcomes of medical interventions may differ depending on the study population. For example, the cost-effectiveness of a screening test may differ depending on whether the target population is an asymptomatic general population or a high-risk population.
Target intervention and comparator
It is essential to clarify the definitions of the target intervention and comparator. A target intervention is a medical intervention that researchers want to prove cost-effective; a comparator is an alternative that researchers wish to compare with the target intervention. When a target intervention is a new drug or medical intervention, the comparator is typically the most widely used treatment. However, when comparing various medical technologies already registered and used in the NHI, target interventions and comparators may not be distinguished.
Study perspective
The study perspective in an economic evaluation is the point of view adopted when deciding which types of outcomes and costs are to be included. This is important because it determines the scope of the costs and outcomes, and as a result, the study perspective may affect the results of the economic evaluation. Typical perspectives are those of the payer, healthcare system, and society. From the healthcare system’s perspective, only the costs incurred within the healthcare system are considered. From a societal perspective, regardless of which economic entity within society incurs the cost, as long as there is a net consumption of resources in society, it counts as a cost; likewise, if there is an effect in society as a whole, it counts as an effect. Previous economic evaluation guidelines have recommended the societal perspective as the most appropriate for the efficient allocation of resources in society; however, due to uncertainties, the recommendation has recently shifted to the healthcare system perspective [2–4].
Time horizon and discounting
It is generally recommended that the time horizon in the economic evaluation should be long enough to confirm major clinical outcomes, considering the study population and disease epidemiology. For acute diseases, the clinical chain of events from occurrence to treatment and recovery or failure ends relatively quickly; therefore, the time horizon can be the period during which the event’s outcome is directly observed. However, treatment outcomes for chronic diseases cannot be confirmed using only short-term observations. Then, one must decide whether to conduct the evaluation using only intermediate results observed over a relatively short period or estimate long-term results with a model [5,6].
It is necessary to apply a discount rate that converts future costs and outcomes into current values for a long time horizon. The discount rate varies by country and the choice of an appropriate discount rate remains a matter of debate [7,8]. This manual proposed applying the 4.5% social discount rate suggested by the Korea Development Institute to ensure policy consistency [2,6,9].
Types of economic evaluation
Both the costs and outcomes must be confirmed when performing an economic evaluation. Economic evaluations are generally divided into cost-minimization, cost-effectiveness, cost-utility, and cost-benefit analyses. A cost-minimization analysis involves finding the lowest-cost alternative by comparing only costs when the comparators’ outcomes are the same.
A cost-effectiveness or cost-utility analysis evaluates efficiency by simultaneously considering the differences in outcomes and costs when the magnitude of the outcomes varies. An outcome indicator in a cost-effectiveness analysis is based on a natural unit, such as changes in clinical indicators (e.g., blood pressure or extension of life years). In contrast, a cost-utility analysis uses quality-adjusted life years (QALYs), health-years equivalent, or disability-adjusted life years [10].
Finally, a cost-benefit analysis measures efficiency by estimating the outcome in monetary terms, similar to cost. However, this approach is not widely employed in healthcare because of limitations, such as psychological resistance to converting the value of human life into monetary value. Nonetheless, because this approach makes it possible to verify the efficiency of a single project, it is sometimes used to conduct economic evaluations of government-supported healthcare projects.
Calculating Outcomes
Outcome indicators
The benefits generated by medical interventions, namely improvements in health outcomes, can be divided into intermediate and final outcomes. Intermediate outcomes are related to final outcomes, but do not necessarily represent final improvements in health outcomes. Final outcomes refer to health outcomes that are ultimately sought through medical interventions, such as a decrease in mortality rate or an increase in the survival rate, life years, or QALYs. Researchers should choose appropriate outcome indicators to identify and measure improvements in health outcomes due to medical interventions.
Quality-adjusted life years
In assessing the improvement in health outcomes due to medical intervention, the QALY is an indicator that takes into account both life years and quality of life during the survival period [5,6]. Medical interventions result in prolonged life (decrease in death) and/or increased quality of life (decrease in disease morbidity). Here, quality of life is calculated based on a preference for a health state, with a perfect health state (state of death) represented by a quality weight of 1 (0).
Measuring the quality weight
The quality weight of a health state is required to calculate QALYs. There are numerous methods to estimate quality weights, including direct measurements, indirect measurements, mapping, and the existing literature.
Direct measurement involves directly measuring the quality weight of a health state. In valuation, a value is assigned according to peoples’ preferences and is quantified as a quality weight. Standard gambling, time trade-off, and the visual analog scale are commonly used valuation methods.
Indirect measurement refers to assessing the quality weight by measuring a subject’s health status with a preference-based health-related quality of life (HRQoL) measurement tool and then reflecting the general population’s preference for that health status. These HRQoL tools include the EuroQol 5 Dimension 3 Level (EQ-5D-3L), EuroQol 5 Dimension 5 Level (EQ-5D-5L), Health Utility Index Mark3, Health-related Quality of Life Instrument with 8 Items (HINT-8). Validation studies for only the EQ-5D-3L, EQ-5D-5L, and HINT-8 have been conducted in Korea, and there are valuation sets that reflect the general population’s preferences [11–14]. There are other methods of obtaining weights, such as mapping or importing from previous studies. However, it is generally recommended to use indirect measurement that incorporate overall health status, such as the EQ-5D, rather than direct measurements, based on specific conditions for economic evaluations in healthcare [2].
Calculating Costs
Cost items
In an economic evaluation of healthcare, the three main cost items are medical, non-medical, and productivity costs [5,15]. Besides these, there are costs that are dependent upon the disease. Other costs that pertain to, for example, exercise or smoking cessation, may also be considered. If these items constitute a large portion of costs, we need to estimate them.
Costs vary depending on the study’s perspective (Table 1). A payer’s perspective includes only the medical costs for NHI benefits paid by the National Health Insurance Service (NHIS). However, if necessary, one may include co-payments for NHI-covered items. From a healthcare system perspective, only medical costs arising directly from the healthcare system are included. From a societal perspective, costs include medical, non-medical, and productivity costs. Non-medical costs include transportation, caregiver costs, and long-term care service costs. Productivity costs include morbidity (economic losses caused by diseases that reduce productivity) and premature death costs (inability to participate in the labor market due to premature death). Morbidity costs include the patient’s time costs. Because of the uncertainty in data and calculation methods, the societal perspective sometimes includes medical and non-medical costs and only patient’s time costs as a type of productivity costs with relatively clear data sources. Naturally, the broad scope of costs included can lead to different results in terms of cost-effectiveness. A recent study showed that the inclusion of productivity losses/gains had a favorable impact on evaluations for many studies [16]. However, the details of productivity losses/gains are not covered in this review. This topic is described in more detail in the NECA manual, which can be referred to if necessary.
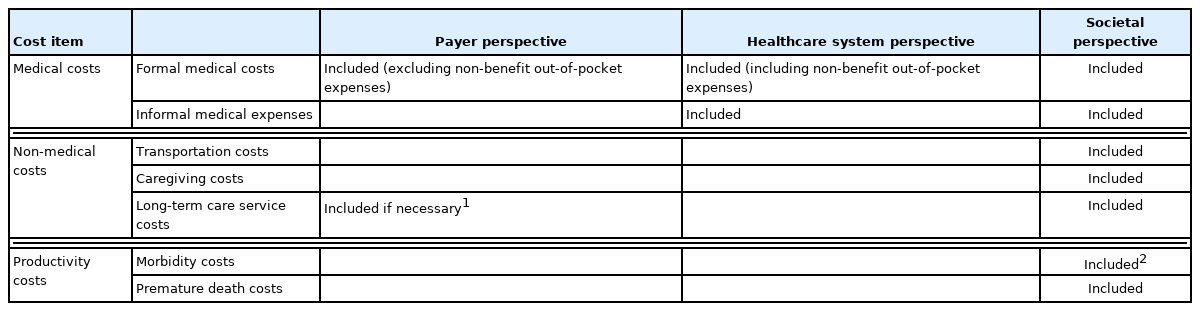
Cost item by analysis perspective
Calculating medical costs
Medical costs comprise formal and informal costs; however, many studies have focused only on formal costs. Formal medical costs consist of NHI benefits (paid by the NHIS) and co-payments (paid by the patient). Medical expenses are the sum of the NHI benefit and the co-payment for NHI-covered items. Co-payments include out-of-pocket expenses for NHI-covered items and NHI-non-covered items (Figure 1).
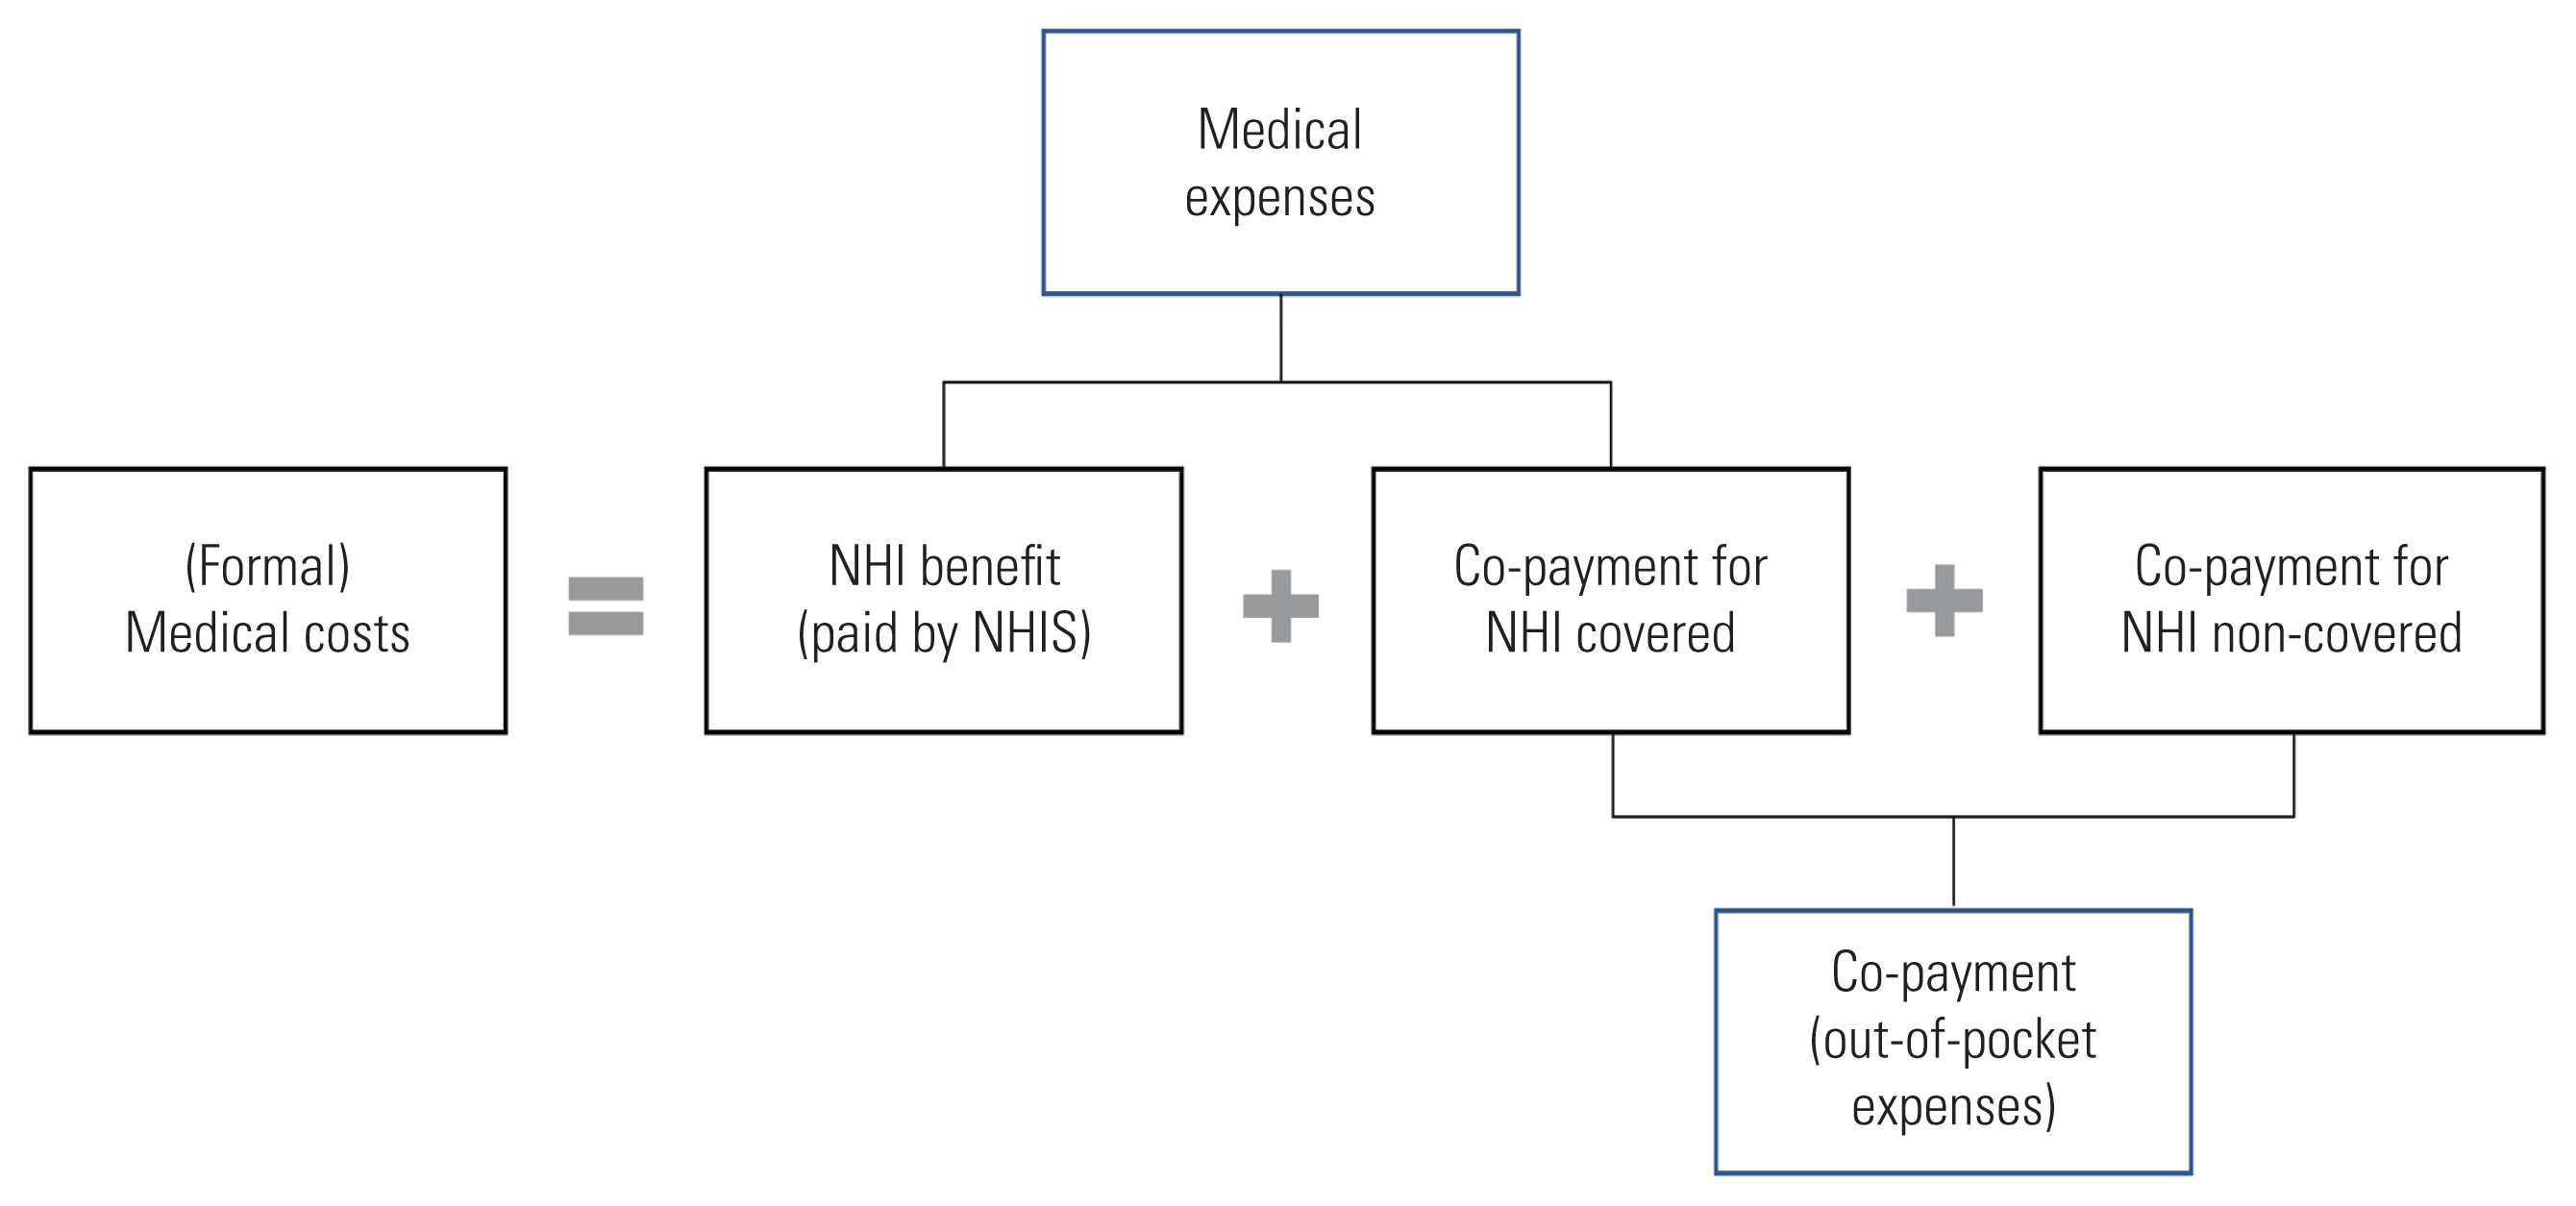
Composition of formal medical costs. NHI, National Health Insurance; NHIS, National Health Insurance Service.
There are two major methods of medical cost calculation: micro-costing and gross costing. Micro-costing involves calculating the total cost by listing all input elements and activities, determining resource consumption during the study period, and assigning a unit cost to each resource use. In gross costing, the overall items encompassing individual items, such as medical costs per patient, are selected to capture all costs incurred during the study period. Choosing a costing method is based on the level of precision and generalization required and data availability. Both methods can be used simultaneously [5,17].
For micro-costing, clinical practice guidelines or surveys at medical institutions serve as the primary data sources for identifying resource usage. Unit costs refer to the fee schedules related to medical procedures, therapeutic materials, and drugs provided by the HIRA.
Gross costing can utilize the sum of all medical approaches, a sum-diagnosis-specific approach, a matched control approach, and a regression method [18,19]. The data sources include NHI claims data, medical institution data, patient survey data, and the Korean Health Panel Survey. These resources can be used separately or together. For example, since co-payments for NHI non-covered benefits cannot be identified from NHI claims data, medical costs including these co-payments can be calculated using both NHI claims data and medical institution data.
Modeling
Types of models
According to the method for calculating each alternative’s total effect and cost, economic evaluations can be divided into trial-based and model-based economic evaluations [20]. The latter type uses decision-analytic models, which can be classified into several types based on whether the model is static or dynamic and whether the simulation is performed at the population-level or at the individual-level (Table 2).

Types of simulation-based decision analytic models used for economic evaluation
Type 1 is a static population-level model that simulates events according to predetermined probabilities at the population-level, without considering interactions between individuals (e.g., decision tree and Markov cohort models).
Type 2 is a dynamic population-level model that simulates the transmission patterns of infectious diseases within the population. These models divide the population into compartments consisting of susceptible, infected, and recovery groups, depending on the stages of infection and disease [21].
Type 3 is a static individual-level model that simulates events at an individual-level. Its basic structure may be the same as type 1. For example, a microsimulation model that performs a first-order Monte Carlo simulation (MCS) at the individual level based on a Markov model is a kind of static individual-level model.
Type 4, which is the most complex, is a dynamic individual-level model, such as agent-based model and discrete event simulation [20].
Partitioned survival analysis (PartSA) has recently been widely used in economic evaluations of interventions for irreversible and progressive diseases, such as anticancer medicines [22, 23]. It determines and analyzes the distribution of patients in each health state based on a non-mutually exclusive survival curve.
Decision trees
A decision tree is a model for making choices, where different decisions are assigned certain values. A tree is composed of decision nodes, chance nodes, terminal nodes, probabilities, and outcomes (Figure 2). A decision node (□) is used when the decision-maker chooses between two or more paths. At a chance node (○), all mutually exclusive events that may occur because of the selected alternative or previous event are presented with their probability of occurrence. At a terminal node (◃), the results associated with the selected alternative are assigned. A decision tree is analyzed by conducting an inverse calculation from the end of the branch; the final value represents the expected outcome of each decision-making option.
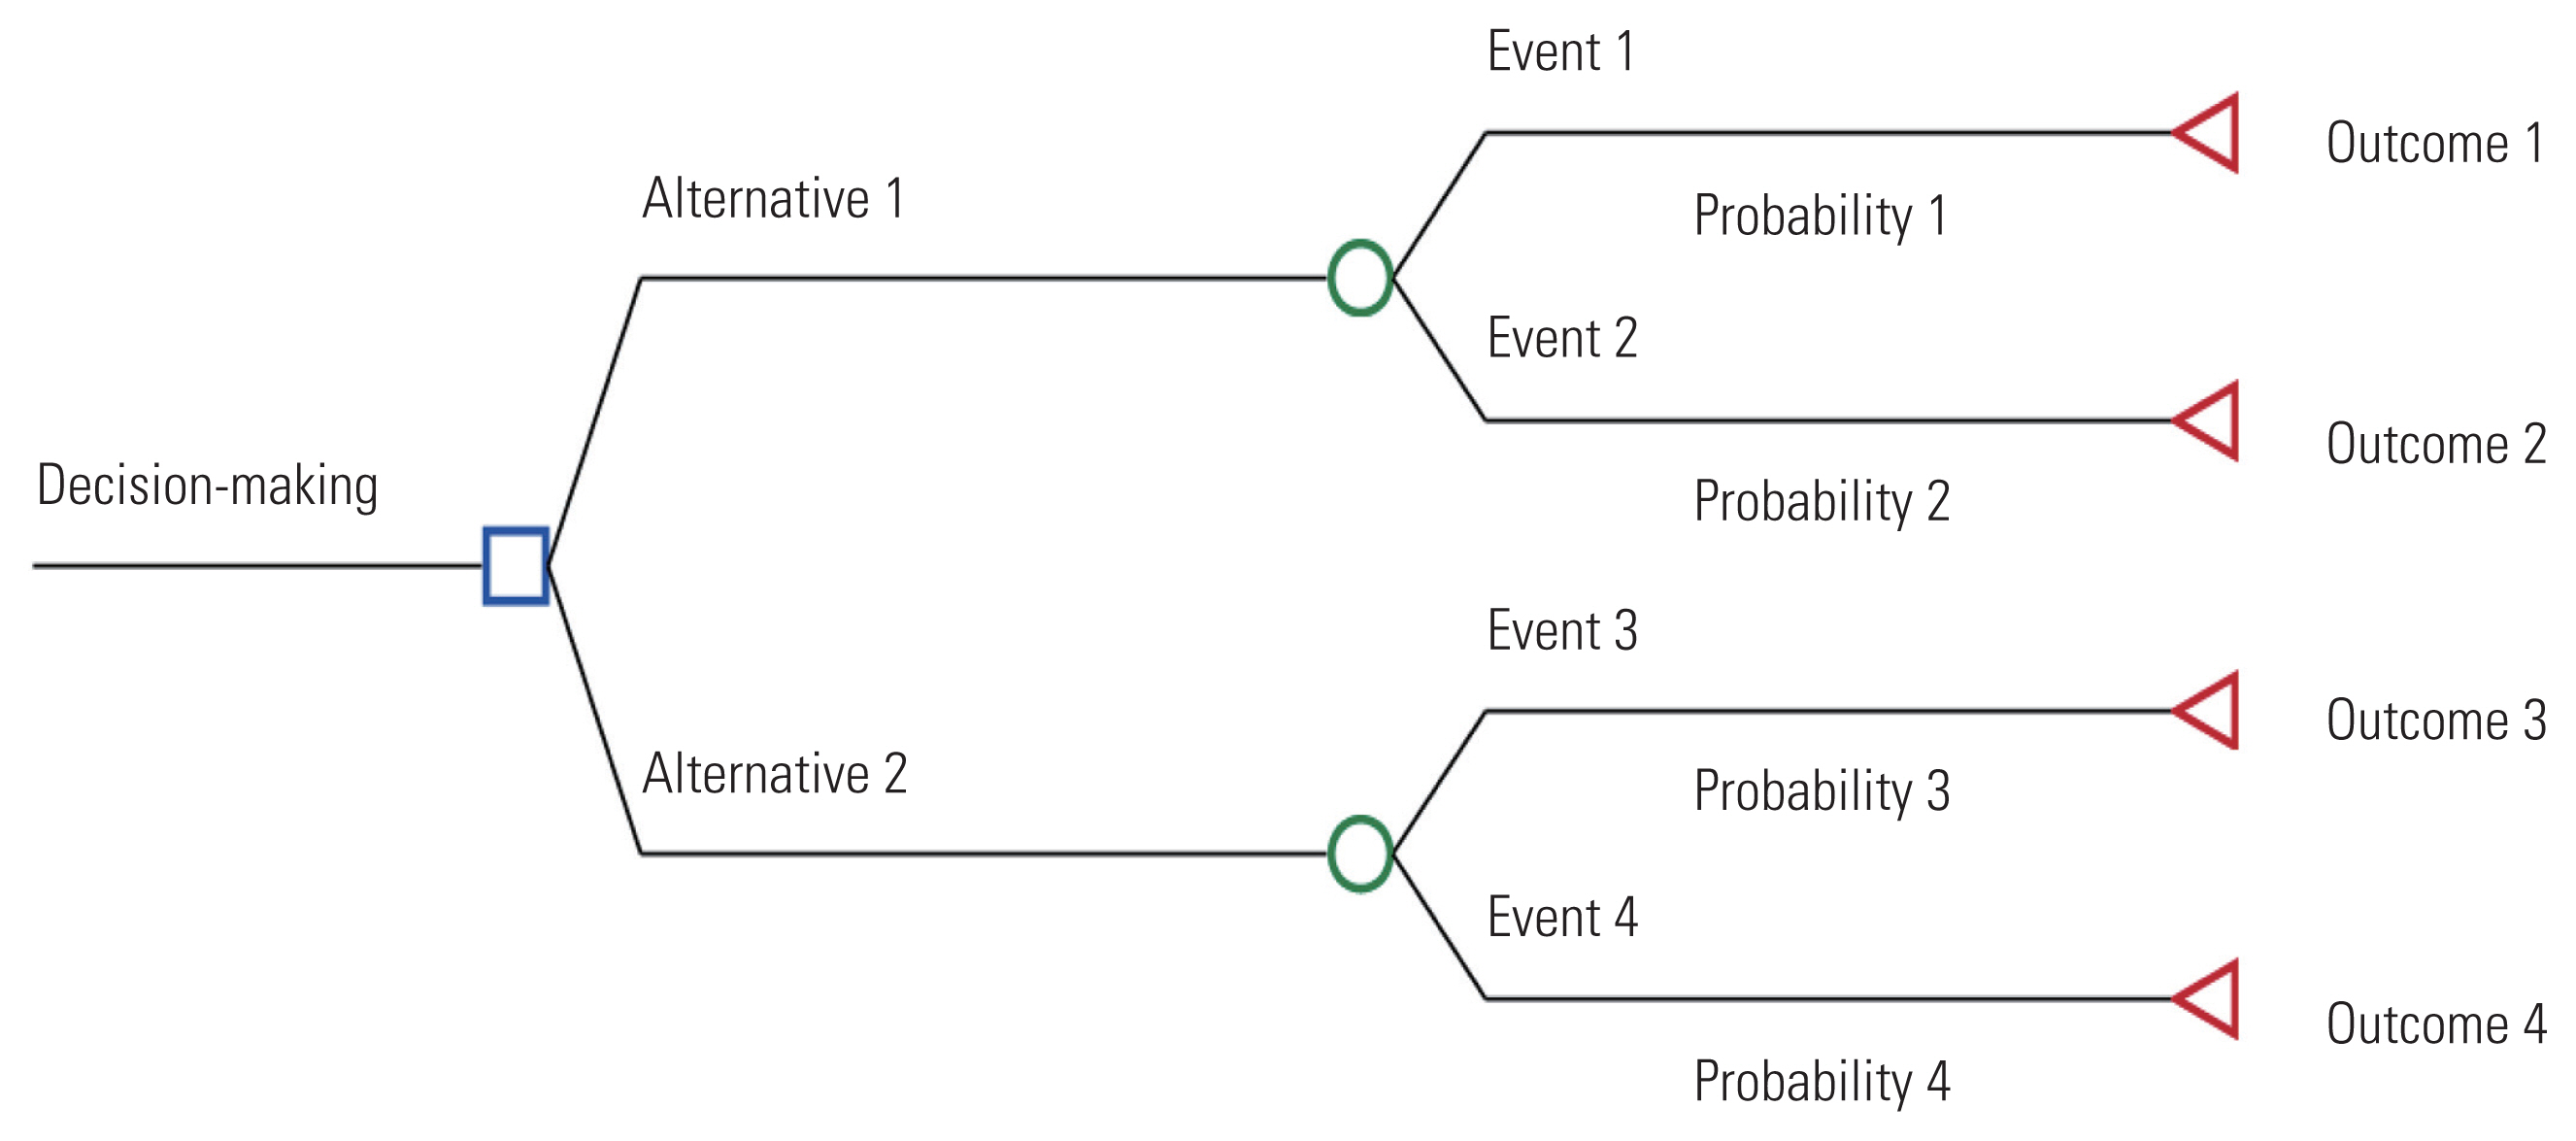
The structure of decision tree.
When the decision-making process is relatively straightforward and the events proceed in one direction, a decision tree can be useful. However, if events are repeated and the prognosis is complex, the number of health states that need to be considered increases, which can cause excessive complexity in the decision tree structure [24].
Markov models
Markov models can deal with a level of complexity that decision trees cannot handle and are commonly employed as decision-analytic models [20]. As a type of state transition model incorporating mutually exclusive health states (Markov states), this model represents the process of regularly changing from one Markov state to another based on a predetermined probabilities. That is, patients move to different health states with a constant probability over time, and the costs and quality of life incurred in each state accumulate over time. The Markov model more accurately represents repeated transfers among health states or complex processes with risks that change over time. Figure 3 illustrates the simplest representation of a Markov state-transition diagram. Each health state is represented by a circle, and the arrow indicates the direction of the transition from one health state to another after one cycle. This model includes three health states: well, sick, and dead. In each cycle, a patient remains in one of the three health states. A person who has been in a “well” or a “sick” state may remain in that state in the next cycle or may move to another state according to the transition probability. Each health state is assigned a cost and effect value per cycle. After collecting all the information required for the analysis, the model is analyzed to calculate the expected value of the entire cohort based on the number of people assigned to each health state and estimate the average cost and effect per person.
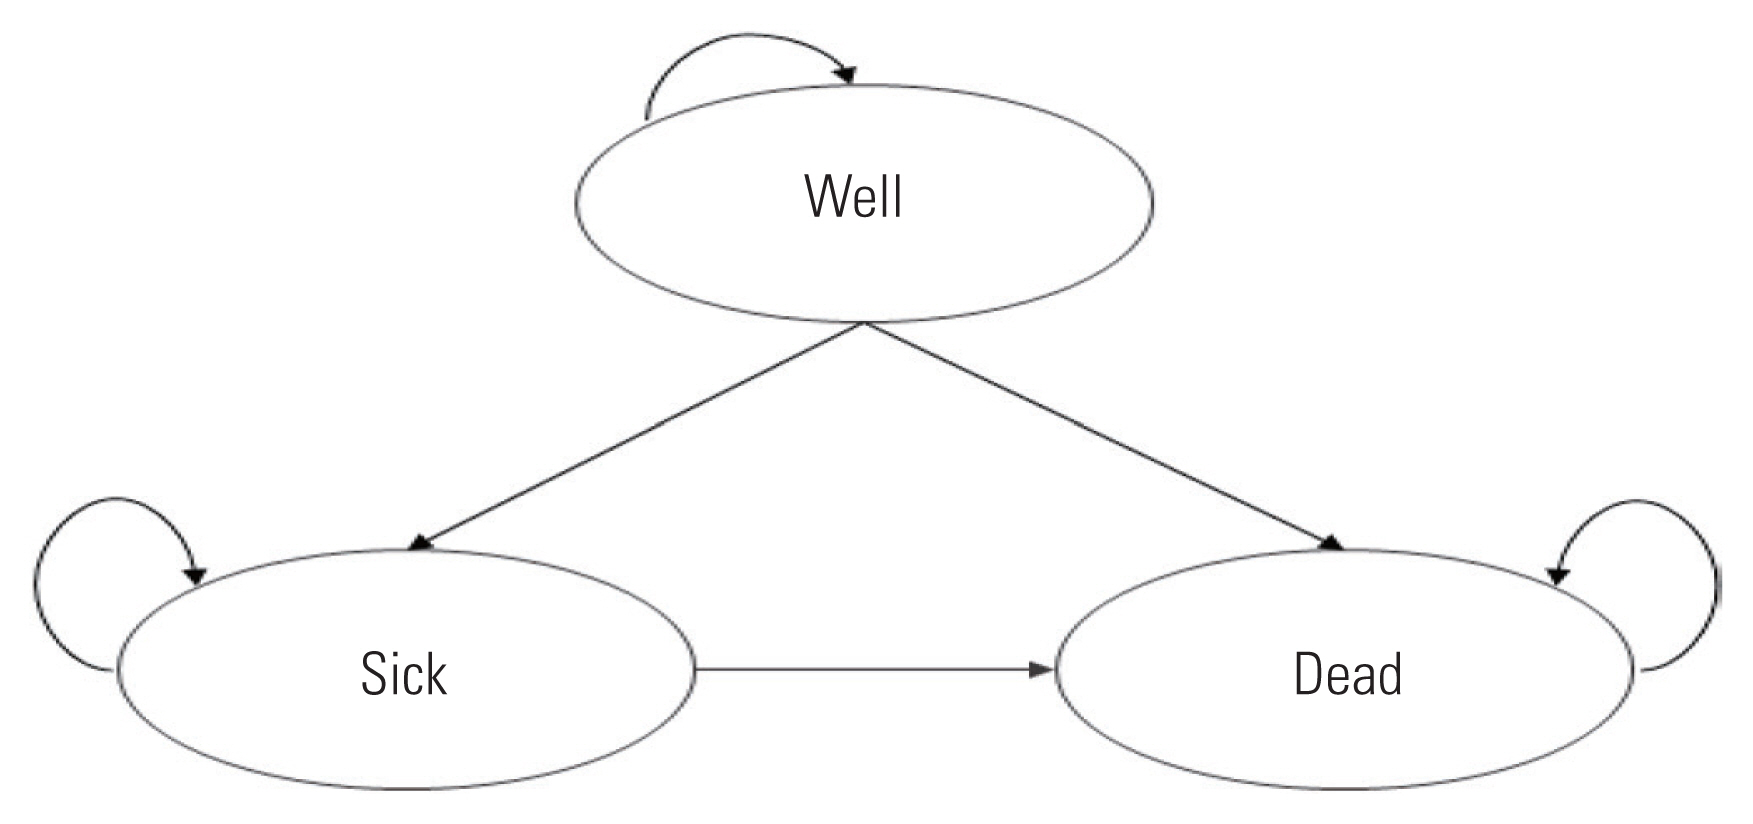
Markov state-transition diagram.
Calculating the transition probability
To conduct an analysis using a state transition model, such as a decision tree or Markov model, we must know the transition probability from one health state to another for each cycle. The natural history of diseases can be determined in terms of the prevalence rate, duration of morbidity, transition by health status, mortality rate, and so on, and we can estimate and apply treatment effects. Furthermore, if the model includes a process for diagnosing a disease in the study population, the diagnostic accuracy should also be accounted for.
The transition probabilities in the model can be derived from the published literature or secondary data source analyses, such as clinical trials data or NHI claims data. The effectiveness of medical interventions is generally evaluated using randomized clinical trials or systematic reviews. When multiple data sources are available, the base analysis is conducted using the most appropriate and reasonable source, while a sensitivity analysis is conducted using other data sources not used in the base analysis.
Analyzing Cost-effectiveness, Uncertainty, and Decision-making
Analyzing cost-effectiveness
A cost-benefit analysis directly compares outcomes with costs by converting them into monetary values. If the benefits exceed the costs, the intervention is considered efficient. Since cost-effectiveness and cost-utility analyses, which are mainly used in healthcare, do not convert outcomes into monetary values, a separate criterion for determining cost-effectiveness is necessary. Generally, when competing alternatives exist, cost-effectiveness is evaluated based on the incremental cost-effectiveness ratio (ICER), which represents the additional cost of improving the effectiveness of a target intervention relative to its comparators (Table 3). Interpreting the example in Table 3, the cost of treatment A is 18 455 753 Korean won (KRW) per person, which is 1 291 334 KRW higher than the cost of treatment B, and the effect of treatment A is 11.790 QALYs per person, which is 0.517 QALYs higher than that of treatment B. Therefore, treatment A costs 2 498 926 KRW more per a QALY than treatment B.

Example of how to present economic evaluation results
If one of the alternatives is more expensive, but the effectiveness is higher, then it is appropriate to evaluate cost-effectiveness by calculating the ICER. In this case, the ICER is positive. If an intervention is less costly and more effective, then it becomes the dominant strategy, whereas the comparator becomes the dominated strategy. In this case, the ICER has a negative value. However, an ICER with a negative value is not useful because it does not provide any insight into cost-effectiveness; instead, it simply describes that the relevant alternative is dominant or dominated. Cost-effectiveness can also be presented as the net health benefits or net monetary benefits using the net benefit framework.
Threshold for determining cost-effectiveness
When the ICER is less than a specific value, an intervention is regarded as cost-effective (efficient); if the ICER exceeds a specific value, an intervention is not considered cost-effective (inefficient). Here, the cut-off value that serves as a criterion for evaluating cost-effectiveness is called the threshold for the ICER. The threshold can be arbitrarily set based on a range that is acceptable to society. The threshold can also be derived from past decision-making or directly determined through surveys [25]. Research on the cost-effectiveness threshold in Korea remains insufficient.
HIRA’s “Detailed Assessment Criteria for New Drugs Subject to Negotiation” indicates that Korea does not use explicit thresholds for cost-effectiveness criteria for new drugs. Rather, it suggests a flexible application with consideration of disease severity, the social burden of disease, the impact on quality of life, and innovativeness [6]. While some researchers use the per capita gross domestic product (GDP) as a cost-effectiveness threshold, one must be cautious because there is no theoretical or empirical basis for using the annual GDP per capita [26].
A few studies from Korea have estimated the social value of a QALY through willingness to pay at the national level using EQ-5D scenarios [25,27]. Ahn et al. [27] undertook a survey of 1932 people and found that the value of a QALY varied depending on the severity of the disease, with 20.51 million KRW per QALY for mild symptoms, 30.72 million KRW for moderate symptoms, 40.28 million KRW for severe symptoms, 32.35 million KRW for severe terminal diseases, and 29.74 million KRW for immediate death. Song and Lee [28] reported that the value of a QALY varied according to the treatment characteristics, such that the value of a QALY was 15 million KRW per QALY in an incurable scenario and 35 million KRW per QALY in a curable scenario.
Uncertainty analysis
All economic evaluation outcomes have uncertainties owing to a lack of available evidence, diversity of methodologies, and unexplained variations. Therefore, it is extremely important to review uncertainty when conducting economic evaluations and confirm whether the ICER is robust. According to Briggs et al. [29], uncertainties can be classified as parameter uncertainty, structural uncertainty, stochastic uncertainty, and heterogeneity. Parameter uncertainty is the uncertainty of the true value of variables that serve as inputs in the model. It can be evaluated using deterministic or probabilistic sensitivity analyses (second-order MCS). Structural uncertainty (or the model’s uncertainty) refers to uncertainty about the assumptions underlying the model structure; it can be estimated through scenario analysis. Stochastic uncertainty is defined as the variability in unexplained outcomes among individuals within the same patient group; it can be assessed through a microsimulation (first-order MCS). Finally, heterogeneity is described as variability due to explainable factors among patients (patient characteristics, etc.), which can be examined by conducting subgroup analyses.
CONCLUSION
Economic evaluations are conducted using a set of highly analytical methods that assess efficiency but pay little attention to equity. As a result, economic evaluations rarely provide information about who gains and who loses from health interventions (i.e., they are equity-neutral). Therefore, decision-makers need to balance the priorities of efficiency and equity, and understand that an economic evaluation is just one of many criteria for decision-making. Nevertheless, economic evaluations offer an explicit scientific and social value judgment. To achieve this goal, the study process must be objective and consistent, regardless of who conducts the economic evaluation. We hope that this study will contribute to the establishment and dissemination of economic evaluation methodologies that are applicable to Korean clinical and research environment, as well as provide an opportunity to further rationalize healthcare policies.
Ethics Statement
This study was approved by the Institutional Review Board of the National Evidence-based Healthcare Collaborating Agency (NECA IRB 20-027).
Notes
CONFLICT OF INTEREST
The authors have no conflicts of interest associated with the material presented in this paper.
FUNDING
This study was supported by National Evidence-based Healthcare Collaborating Agency (NR20-001; NR21-001).
ACKNOWLEDGEMENTS
None.
Notes
AUTHOR CONTRIBUTIONS
Conceptualization: Kim YH, Shin S, Lee T, Ahn J. Funding acquisition: Shin S, Kim YJ. Project administration: Lee S, Kim YJ, Shin S. Writing – original draft: Kim YH, Kim YJ, Lee HJ, Park SY, Oh SH, Jang S, Shin S. Writing – review & editing: Kim YH, Shin S, Lee HJ, Park SY, Oh SH.