Decomposition of Socioeconomic Inequality in Cardiovascular Disease Prevalence in the Adult Population: A Cohort-based Cross-sectional Study in Northwest Iran
Article information

Abstract
Objectives
The incidence of cardiovascular disease (CVD) mortality is increasing in developing countries. This study aimed to decompose the socioeconomic inequality of CVD in Iran.
Methods
This cross-sectional population-based study was conducted on 20 519 adults who enrolled in the Ardabil Non-Communicable Disease cohort study. Principal component analysis and multivariable logistic regression were used, respectively, to estimate socioeconomic status and to describe the relationships between CVD prevalence and the explanatory variables. The relative concentration index, concentration curve, and Blinder-Oaxaca decomposition model were used to measure and decompose the socioeconomic inequality.
Results
The overall age-adjusted prevalence of CVD was 8.4% in northwest Iran. Multivariable logistic regression showed that older adults, overweight or obese adults, and people with hypertension and diabetes were more likely to have CVD. Moreover, people with low economic status were 38% more likely to have CVD than people with high economic status. The prevalence of CVD was mainly concentrated among the poor (concentration index, −0.077: 95% confidence interval, −0.103 to −0.060), and 78.66% of the gap between the poorest and richest groups was attributed to differences in the distribution of the explanatory variables included in the model.
Conclusions
The most important factors affecting inequality in CVD were old age, chronic illness (hypertension and diabetes), marital status, and socioeconomic status. This study documented stark inequality in the prevalence of CVD, wherein the poor were more affected than the rich. Therefore, it is necessary to implement policies to monitor, screen, and control CVD in poor people living in northwest Iran.
INTRODUCTION
Cardiovascular disease (CVD) is a leading cause of death in developing countries, and its incidence is rising every year [1]. Socioeconomic status (SES) has been inversely related to CVD and mortality [2]. In developed countries, the decline in CVD is more evident among individuals from higher socioeconomic groups, and the difference in the incidence of CVD compared to lower socioeconomic groups is widening [3]. There is ample evidence of an inverse relationship between SES and cardiovascular risk factors in developing countries [4]. Therefore, preventive activities to reduce CVD can have a major impact on the health of people from lower socioeconomic groups [5].
In Iran, despite a growing young population, the mortality rate for CVD is high, accounting for 25% of deaths, and it is the third leading cause of death after accidents and cancers [6]. In 2014, a community-based intervention program was launched in Iran with the aim of preventing and controlling CVD through changes in lifestyle and other primary risk factors. This was the first attempt to identify methods to prevent and control chronic CVD in Iran [7] by promoting a healthy lifestyle, including nutrition and daily physical activity [8].
A few studies have investigated the relationship between SES and cardiovascular risk factors in Iran, as a country with a high prevalence of catastrophic health expenditures [9]. Although the dimensions of SES are interrelated, they have individual impacts on the prevalence of CVD, depending on the culture and customs of people from different countries and regions. Several studies have shown inverse relationships between academic achievement and certain CVD risk factors such as lipid profile, blood pressure, and weight [10]. In contrast, numerous studies have shown positive associations between low education levels and the risk factors for CVD [11]. Rose and Marmot [12] reported that age, smoking, height, body mass index (BMI), systolic blood pressure, cholesterol, and blood glucose had only modest effects on reducing the inverse relationship between class and the risk of CVD. Najafi et al. [13] showed that the prevalence of obesity, a risk factor for CVD, was 26.7% among Iranian adults and was more concentrated among the rich. Since then, Franks et al. [14] have shown that the risks for SES-related diseases were less strongly reduced by improvements in traditional, biological, and behavioral risk factors.
It has been argued that SES can affect health, independent of known risk factors, and has important implications for public health research and policy [15].
It has also been shown that different environmental and socioeconomic risk factors, as well as inequalities in the social determinants of health, play a significant role in the distribution and regional variations in the prevalence of CVD. Few studies have explored the importance of socioeconomic variables (such as parental education/occupation and income) as key outcome predictors for non-communicable diseases (NCDs), which have a substantial effect on health and health inequalities, especially for CVD in Iran.
Identifying risk factors for CVD plays an important role in prevention, especially if risk factor control begins in adolescence and delays the onset of the disease and slows or reduces the progression of the disease in its early stages [16]. It has been shown that various environmental and socioeconomic risk factors, as well as inequalities in the social determinants of health, play an important role in the distribution of health [13,17]. However, few studies have examined the importance of socioeconomic variables (such as parental education/occupation and income) as major predictors of NCD outcomes, even though they have a significant impact on health and health inequalities, especially in relation to CVD in Iran. The prevalence of CVD is expected to sharply increase in Iran because of several factors including an aging population, and the anticipated increase in the burden of CVD will be about 45.4% to 72.0% in the near future [18,19]. However, the impact of socioeconomic inequality and its related factors on the prevalence of CVD is unclear. In this study, we measured the prevalence of CVD and used decomposition techniques to identify the factors related to socioeconomic differences in CVD. We decomposed the SES inequality of CVD and its risk factors in 20 519 men and women aged 35 years to 70 years in Ardabil, Iran.
METHODS
Study Setting
This study was conducted in Ardabil (the capital of Ardabil Province) in northwest Iran. Ardabil has a population of approximately 532 000 people. This study used data extracted from the Prospective Epidemiological Research Studies in IrAN (PERSIAN) cohort study.
Study Design
This was a cross-sectional study based on national-level cohort study data. In 2013, the Iranian Ministry of Health and Medical Education decided to conduct a national cohort study (i.e., PERSIAN) to develop the context needed to modify healthcare policies in the field of NCDs. The PERSIAN cohort consists of participants dwelling in various sites across Iran. The details of the sampling design can be found elsewhere [20].
The Ardabil Non-Communicable Disease (ArNCD) cohort study is 1 of the 18 geographically distinct study areas of the PERSIAN cohort study. The study participants are mainly of Azeri ethnicity. Based on the PERSIAN cohort study goals and its comprehensive protocol, 20 519 adult men and women between the ages of 35 years and 70 years, living in the city of Ardabil from May 2017 to February 2020, were enrolled. Exclusion criteria included non-Iranian citizens, those who were deaf or blind, and people with palsies, mental disorders, intellectual disabilities, or any acute psychiatric illnesses. Trained interviewers administered the cohort questionnaire. Excluding questionnaires with missing data, the final sample size of the study was 20 519 people.
Variables
Health outcomes
CVD was the dependent variable (health outcome) of this study. CVD within the past year was evaluated to determine its prevalence, and it was defined as a clinical diagnosis of or hospitalization for CVD (International Classification of Diseases, 10th revision codes I00–I99 and 9th revision codes 390-459). The outcome variable was determined by a self-reported diagnosis of CVD in response to the following question: “Has a doctor or other health professional ever told you that you had CVD, otherwise known as coronary artery disease such as angina and myocardial infarction (commonly known as a heart attack)?” The answer was scored 1 for “yes” and 0 for “no.”
Socioeconomic and social determinants of health inequalities
We used data from the PERSIAN cohort study, where all variables were defined in detail [20]. This study used principal component analysis (PCA) [21] to estimate the SES of the study participants. Filmer and Pritchett [22] popularized the use of PCA for estimating wealth levels using asset indicators to replace income or consumption data. The estimation of relative wealth using PCA is based on the first principal component. Formally, the wealth index for household i is the linear combination,
where, χ̄k and sk are the mean and standard deviation of asset xk, and α represents the weight for each variable xk for the first principal component. The first principal component variable across households or individuals has a mean of zero and a variance of λ, which corresponds to the largest eigenvalue of the correlation matrix of x. The first principal component or wealth index can take positive as well as negative values. Assets and housing characteristics (e.g., housing situation, number of bedrooms at home, family assets), education level, and job were the explanatory variables in the PCA. Based on the wealth score, samples were divided into 5 quintiles from the poorest to the richest (first quintile as the poorest and fifth quintile as the richest) SES.
Social determinants of inequality in CVD morbidity included factors with known or plausible links to CVD and to individual financial conditions. In several studies, different variable categories were used to analyze the socioeconomic inequality of NCDs such as CVD [17], including demographic variables (gender, age), socioeconomic conditions (SES quintiles, education), hypertension and diabetes as predictor variables of CVD, and health-related behaviors and status (smoking, obesity/BMI) [18]. All independent variables in this study were categorical and coded as follows: age (continuous from 35 to 70 years), gender (men/women, marital status (single/married/other), education status (illiterate/primary and secondary school/high school/academic degree), smoking status (yes/no), diabetes (yes/no), BMI (normal/overweight/obese), and SES (poorest/poor/middle/rich/richest).
Statistical Analysis
This study used PCA [21] to estimate the SES of the study participants. Assets and housing characteristics (e.g., housing situation, number of bedrooms in the home, family assets, foreign and domestic trips, number of books read, and owning a car, motorcycle, bicycle, personal computer, CD/DVD player, washing mashing, or microwave), education level, and job were the initial variables included in the PCA. Based on their SES score, study participants were divided into 5 quintiles from the poorest to the richest (first quintile as the poorest and fifth quintile as the richest).
Measuring socioeconomic inequality in CVD
Multivariable logistic regression was used to describe the relationship between CVD prevalence and each explanatory variable. We examined the socioeconomic differences in CVD prevalence among participants using the relative concentration index (RCI) and concentration curve (CC) [23]. The RCI was used to measure and decompose the socioeconomic inequality in CVD prevalence among Ardabil adults (35 to 70 years of age). In addition, the CC was used to investigate the socioeconomic inequality in CVD prevalence graphically. The CC plots the cumulative percentage of SES ranked participants on the x-axis and the cumulative percentage of a health interest variable (CVD prevalence score in our case) on the y-axis. The curve’s deviation from the line of equality indicates the severity of inequality. The RCI is equivalent to twice the area between the perfect equality line (45° line) and the CC. RCI values range from −1 to 1 and are positive when the CC lies below the line of perfect equality and vice versa. A positive value of the RCI indicates that the diabetes prevalence score is concentrated more among the richest. Following Wagstaff et al. [23], RCI was separated by
where xk describes the explanatory variables discussed in the previous section. Thus the RCI for diabetes prevalence has been decomposed as follows [24]:
Where RC is the relative concentration index of CVD prevalence, χ̄k the mean of xk determinants, Ck is the RC for explanatory variables, and
Multivariate regression was used to determine the marginal impact of the determinants in the decomposition analysis. Statistical research was performed using Stata version 12.0 (StataCorp., College Station, TX, USA). The variables were considered significant at p<0.05.
Ethics Statement
The Research and Ethics Committee of Ardabil University of Medical Sciences (ARUMS) approved the study protocol with reference number (IR.ARUMS.REC.1399.072).
RESULTS
Of the 20 519 participants in the study, 45.8% were men and 54.2% were women, and most (37.1%) were in the 46–55 years age group. The mean age of participants was 49.04 years (95% confidence interval [CI], 48.92 to 49.15) overall, 49.71 years (95% CI, 49.53 to 49.88) for men, and 48.47 years (95% CI, 48.31 to 48.63) for women. Of the total participants, 16.0% were smokers, 42.5% were obese, and 20.8% had hypertension (Table 1).

Descriptive characteristics and prevalence of cardiovascular disease in the ArNCD cohort study (n=20 519)
The overall prevalence of CVD was 8.5% (95% CI, 8.1 to 8.9). The age-adjusted prevalence of CVD was 8.4% (95% CI, 8.1 to 8.9) overall, 8.9% (95% CI, 8.4 to 9.4) for women and 8.1% (95% CI, 7.5 to 8.6) for men.
The results of multivariable logistic regression are presented in Table 2. Some included explanatory variables had a statistically significant relationship with CVD (p<0.05). The oldest age group (65 years and older) reported more CVD than those aged 35–44 years (adjusted odds ratio [aOR], 6.18; 95% CI, 3.31 to 11.54). Divorced people were 2.05 (95% CI, 1.94 to 4.46) as likely to have CVD than single people, and smokers were 51% more likely to have CVD than non-smokers. Obese people, people with hypertension, and people with diabetes were, respectively, 1.17 (95% CI, 1.01 to 1.25), 3.46 (95% CI, 3.10 to 3.87), and 1.61 (95% CI, 1.41 to 1.82) times more likely to have CVD. Additionally, people with poor economic status were 38% more likely to have CVD than rich people.

Association between explanatory variables and the prevalence of cardiovascular disease (logistic regression model)
Based on the study results, the concentration index for all participants was −0.077 (95% CI, −0.103 to −0.060) overall, −0.066 (95% CI, −0.104 to −0.020) for men, and −0.087 (95% CI, −0.121 to −0.050) for women, indicating no significant difference between men and women (Supplemental Material 1). Figures 1 and 2 show the CC for all participants (Figure 1) and separately for men and women (Figure 2).
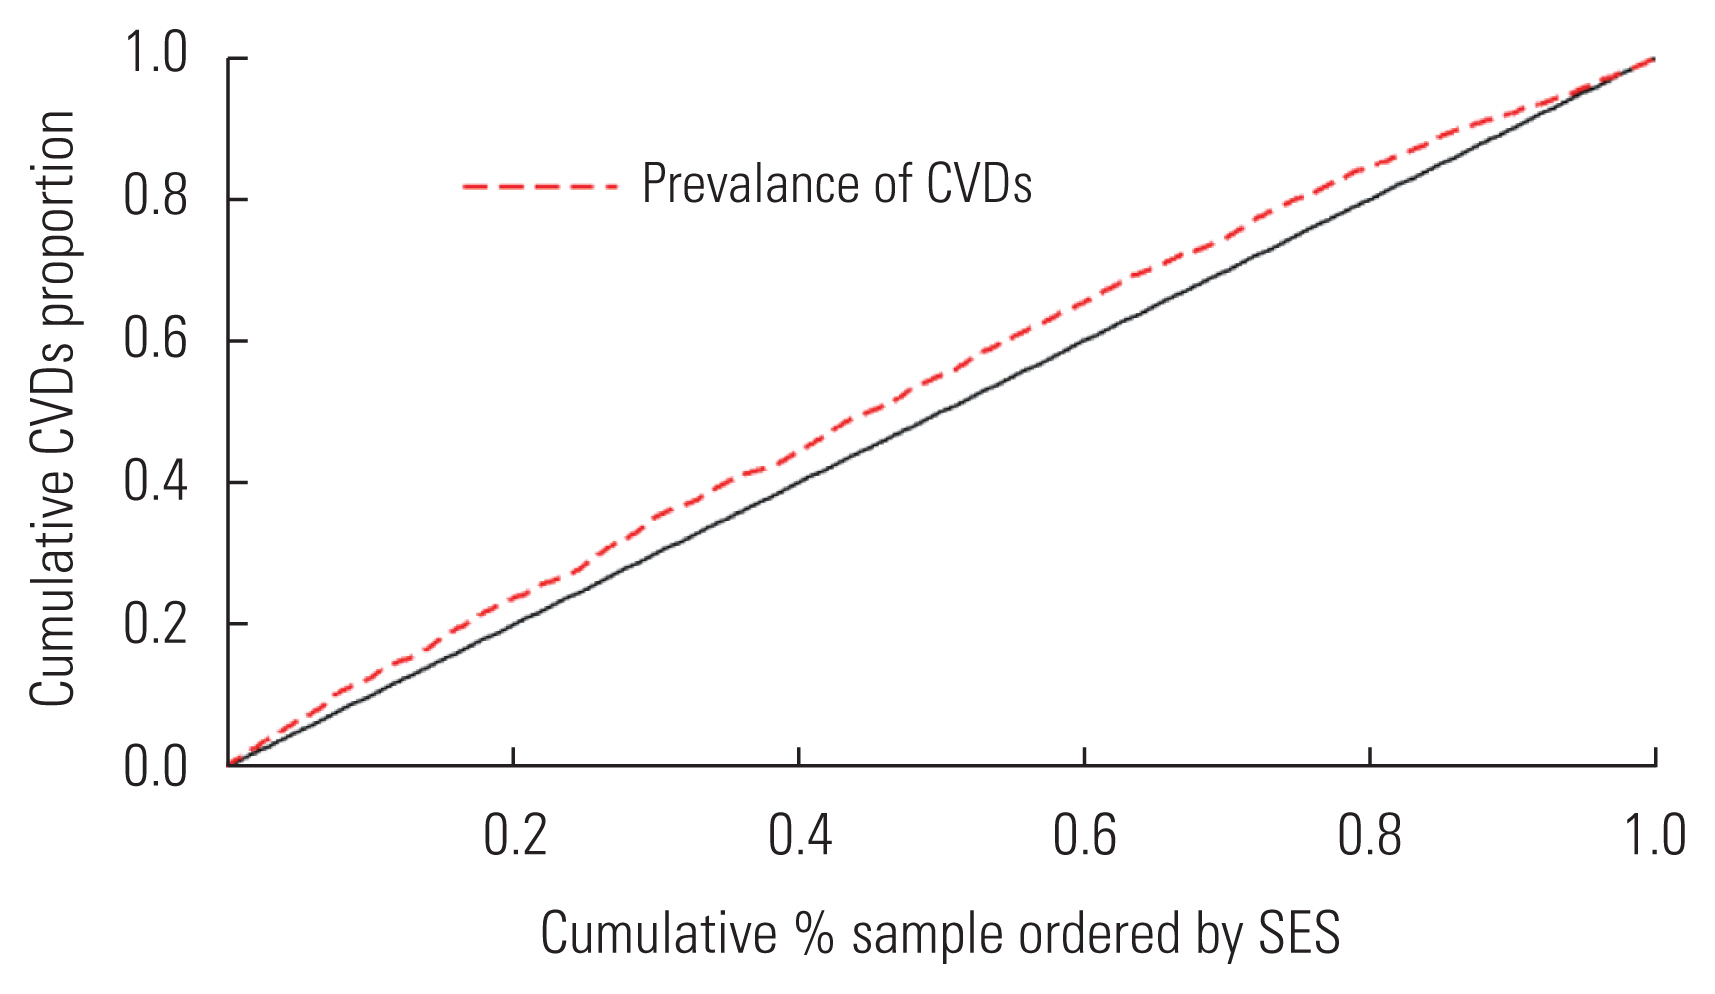
The concentration curve for the prevalence of CVD among adults in the Ardabil Non-Communicable Disease cohort, where the prevalence of CVD is pro-poor and unequally distributed among the poor. CVD, cardiovascular disease; SES, socioeconomic status.

The CC prevalence of CVDs among adults in Ardabil Non-Communicable Disease cohort, separately for men and women. CC, concentration curve; CVD, cardiovascular disease; SES, socioeconomic status.
The estimated value for the age-adjusted slope index of inequality (SII) was 0.11 (95% CI, 0.09 to 0.12) and the age-adjusted and sex-adjusted SII was 0.07 (95% CI, 0.06 to 0.11). The estimated value of the relative index of inequality was 1.64 (95% CI, 1.41 to 1.91) when it was adjusted for age and 1.45 (95% CI, 1.23 to 1.69) when adjusted for age and gender (Supplemental Material 2). These results suggested that the prevalence of CVD was mainly concentrated among poor people.
The results of the Blinder-Oaxaca decomposition analysis are provided in Table 3. The prevalence of CVD in the poorest group was 10.11% (95% CI, 9.22 to 11.07), while the corresponding figure for the richest group was 6.54% (95% CI, 5.82 to 7.34). The difference between the poorest and richest groups was 3.57% (95% CI, 6.99 to 9.93), and 78.66% of this gap between the 2 groups was attributed to differences in the distribution of the explanatory variables included in the model (i.e., age, gender, marital status, BMI, years of schooling, smoking status, and history of hypertension and/or diabetes). The most important factors affecting differences in the prevalence of CVD were age (78.31%), having chronic diseases such as hypertension (12.11%) and diabetes (11.75%), and marital status (8.38%). Additionally, the remaining 13.06% difference between the 2 groups was attributed to differences in the coefficient of variables (unexplained part) or other determinants that were not included in the study. The share of the interaction part in the total gap between the 2 groups was only 8.26%.

Decomposition of the gap between the low and high socioeconomic groups in the prevalence of CVD in the ArNCD cohort study by the Blinder-Oaxaca decomposition model
DISCUSSION
The present study revealed a significant relationship between the prevalence of CVD and the SES of adults aged 35–70 years old who lived in Ardabil, northwestern Iran. The prevalence of CVD in Iran, as a developing country, is generally higher in people with lower levels of education and income. The socioeconomic inequality of CVD, which has been shown in developed countries, is also evident in this study [25,26]. CVD is observed worldwide among low socioeconomic groups, which is consistent with the results of the present study [27]. There are a few studies that contradict the results of the present study. For example, Emadi et al. [28] showed that the CI of incidence, prevalence, years of life lost, years lived with disability, and disability-adjusted life years for CVD were pro-rich. The population and indicators studied by Emadi et al. [28] are different from those of this study, which may be one of the reasons for the difference in results.
Our study also found a significant association between CVD and its 4 risk factors: smoking, diabetes, high blood pressure, and obesity. Three of the risk factors (excluding obesity) were more common in low-education and low-income groups. In a 10-year cohort study of adults 25–64 years old in Russia, Malyutina et al. [29] found that the prevalence of CVD was higher in less-educated groups. Koch et al. [30]’s study also showed that increased levels of education acted as a protective factor against CVD. Various studies have shown that education levels impacted CVD, as was found in the present study. Chang et al. [31] blamed a lack of education and consequent lack of health information for the high incidence of low-income people with CVD. Patients with low levels of education are more likely to have CVD due to a lack of information on nutrition and physical activity. The existence of an inverse relationship between the level of education as a socioeconomic factor and the disease under study can be attributed to the higher level of awareness in individuals who adhere to a healthy lifestyle. As shown in McFadden et al. [32]’s study, increased levels of education frequently lead to improved economic and social status, with more desirable jobs that create greater feelings of satisfaction.
There is ample evidence of differences between men and women in the prevalence of health problems. In addition, health problems in men and women vary according to their economic and social status [33]. Our study found that CVD was more common in men than women. Various studies have shown a link between sex and disease, wherein men were more prone to disease [34]. This could be due to pressure at work and the economic problems in Iran, which more often affect men as heads of household [35]. Our study result showing that CVD was more prevalent in married people is in line with the findings of a similar study in Lebanon, which postulated that marital or parenting stress may be causing increased CVD [36].
The present study confirmed an association among the risk factors for CVD (smoking, hypertension, diabetes, and obesity), which have been widely studied in various combinations [17]. Studies by Western research groups have shown that economic and social inequalities form a major part of the socioeconomic slope of CVD [37]. The high prevalence of some risk factors in the population over 35 years old has also led to CVD in this group. Williams et al. [38] found that people who smoked for more than 25 days were 8 times more likely to have CVD than those who did not smoke at all. Kanitz et al. [39] found that smoking was the most important risk factor for developing CVD. Pourreza et al. [40] also showed that smoking was significantly more common in patients with heart disease. In our study, the prevalence of these risk factors in CVD patients was relatively high.
The present study had a few limitations. First, although the data were collected by experts in the PERSIAN cohort center, the data were self-reported. Another limitation was that all heart diseases were considered except myocardial infarction (MI), and data were not provided for MI. Finally, the findings of this study were based on the data of a cross-sectional study, thus preventing the inference of causation. Although the orientation of some of the reported associations was clear (e.g., age and heart disease), because of the cross-sectional nature of the study design, inverse causality could not be ruled out.
Despite its limitations, this was the first study to examine the socioeconomic inequalities in CVD in northwest Iran. The results suggest that people with lower education and income levels were more susceptible to developing CVD, independent of medical risk factors. They also suggest that other identified socioeconomic factors and mechanisms may mediate CVD. Clarifying these mechanisms and, more importantly, improving education while reducing poverty could be important steps toward establishing effective prevention strategies against CVD in developing countries. This study can serve as an incentive for future population-based group studies on the risk factors of CVD in developing countries.
Overall, the age-adjusted prevalence of CVD was higher in northwest Iran than in other developed and developing countries. In addition, the high prevalence was unequally distributed among the poor and the rich in such a way that the prevalence of CVD affected the poor more deeply than the rich. The most important factors affecting the prevalence of CVD were age, chronic diseases such as hypertension and diabetes, marital status, and SES. Therefore, health/medical/nutritional policies and interventions are needed to monitor, screen, and control this disease in the low-income groups of this region. More attention should be paid to inequality in the prevalence of CVD among socioeconomic groups, particularly during global economic crises. The benefits of CVD prevention and treatment should be available to all socioeconomic groups, not only to the rich. CVD prevention and treatment interventions should focus on health-related behaviors (smoking, diet, and physical activities) and healthcare effectiveness (e.g., access to health care services, early detection of hypertension, and prompt treatment). There also remains a need for more research on the impact of the many other specific factors of CVD.
SUPPLEMENTAL MATERIALS
Supplemental materials are available at https://doi.org/10.3961/jpmph.22.051.
ACKNOWLEDGEMENTS
The funders had no role in the study design, data analysis, decision to publish, or preparation of the manuscript.
Notes
CONFLICT OF INTEREST
The authors have no conflicts of interest associated with the material presented in this paper.
FUNDING
This project was financially supported by the National Institute for Medical Research Development (NIMAD: 962249). In addition, a part of this work was funded by the Ardabil University of Medical Sciences (ARUMS).
AUTHOR CONTRIBUTIONS
Conceptualization: Zahirian Moghadam T, Zandian H, Pourfarzi F. Data curation: Zandian H, Pourfarzi F. Formal analysis: Zahirian Moghadam T, Zandian H. Funding acquisition: Zahirian Moghadam T, Zandian H, Pourfarzi F. Methodology: Zandian H, Pourfarzi F. Project administration: Pourfarzi F, Zahirian Moghadam T. Visualization: Zandian H. Writing – original draft: Zahirian Moghadam T, Zandian H, Pourfarzi F. Writing – review & editing: Zahirian Moghadam T, Zandian H, Pourfarzi F.