Trends and Spatial Pattern Analysis of Dengue Cases in Northeast Malaysia
Article information

Abstract
Objectives
Dengue remains hyperendemic in Malaysia despite extensive vector control activities. With dynamic changes in land use, urbanisation and population movement, periodic updates on dengue transmission patterns are crucial to ensure the implementation of effective control strategies. We sought to assess shifts in the trends and spatial patterns of dengue in Kelantan, a north-eastern state of Malaysia (5°15’N 102°0’E).
Methods
This study incorporated data from the national dengue monitoring system (eDengue system). Confirmed dengue cases registered in Kelantan with disease onset between January 1, 2016 and December 31, 2018 were included in the study. Yearly changes in dengue incidence were mapped by using ArcGIS. Hotspot analysis was performed using Getis-Ord Gi to track changes in the trends of dengue spatial clustering.
Results
A total of 10 645 dengue cases were recorded in Kelantan between 2016 and 2018, with an average of 10 dengue cases reported daily (standard deviation, 11.02). Areas with persistently high dengue incidence were seen mainly in the coastal region for the 3-year period. However, the hotspots shifted over time with a gradual dispersion of hotspots to their adjacent districts.
Conclusions
A notable shift in the spatial patterns of dengue was observed. We were able to glimpse the shift of dengue from an urban to peri-urban disease with the possible effect of a state-wide population movement that affects dengue transmission.
INTRODUCTION
Dengue, a vector-borne viral illness transmitted by Aedes mosquitoes, has shown a dramatic global increase in recent years as its vectors have spread from their original habitat in Africa to other tropical and sub-tropical regions. The geographical spread of dengue has resulted from factors such as globalization, trade, urbanisation, inadequate domestic water supply, warming temperatures, and increased travel [1-3]. Currently, nearly half of the global population is at risk of contracting the disease.
The dengue trends in Malaysia show a cyclical pattern every 3-5 years, reflecting shifts in the local circulating dengue serotype. Every shift results in nationwide epidemics. A notable increase in the dengue incidence rate took place from 31 cases per 100 000 population in 2000 to 361 cases per 100 000 population in 2014 [4]. Conversely, the case fatality rate has dropped and has remained below 0.2% annually since 2013. All age groups in Malaysia are affected by dengue, and individuals of reproductive age (15-49 years), men, and urban dwellers are the most vulnerable [5-7].
Detecting the distribution and patterns of infectious diseases, identifying hotspots, and evaluating the association between disease incidence and climatic, ecological, socioeconomic, and demographic factors through spatial analysis has become the cornerstone of epidemiological studies since the 1980s [8-12]. The average nearest neighbour (ANN) method, global Moran’s I, and hotspot analysis (Getis-Ord Gi) are some examples of spatial analyses that have been performed [13]. Out of these, hotspot analysis is one of the most common techniques for measurements in spatial analysis as it visualises clusters that are statistically significant, as compared to a density analysis [14]. Cluster identification helps public health professionals to detect high-risk dengue areas to prioritise for prevention and control programmes [15,16].
Dengue remains endemic in Malaysia, with periodic epidemics despite extensive vector control activities. These epidemics place a constant strain on public health resources. With dynamic changes in causative factors promoting dengue transmission, frequent epidemiological monitoring of the spatial patterns of dengue is required for more effective dengue control activity. This study aimed to assess shifts in the trends and spatial patterns of dengue cases in Kelantan, Malaysia.
METHODS
This study was a state-wide retrospective secondary data review involving 3 years of quantitative data from 2016 to 2018. The dengue data were downloaded from the national dengue monitoring system, eDengue. Dengue cases in Kelantan with a confirmatory positive non-structural protein 1 antigen test or dengue immunoglobulin M test that were registered in the eDengue system with an onset of disease from January 2016 to December 2018 were enrolled in the study.
The study area was in Kelantan, a north-eastern state of Malaysia that is located on the east coast of peninsular Malaysia with the coordinates 5°15’N 102°0’E. It spans 17 100 km2 with 4 different landscapes: mountainous areas, hilly areas, plains areas, and coastal areas. The dominant land cover in Kelantan is forest, mostly inland, whereas the land use in the coastal region is mainly cities, towns, and paddy fields. Kelantan consists of 9 districts (Figure 1), which are further divided into 65 sub-districts. The capital city is in the Kota Bharu district. An estimated 1.89 million people populated Kelantan in 2019 (population density of 126/km2), with Kota Bharu being the most urbanised and populated district (population density of 1219/km2), whilst the semi-urban Gua Musang is the least populated (population density 10.96/km2).
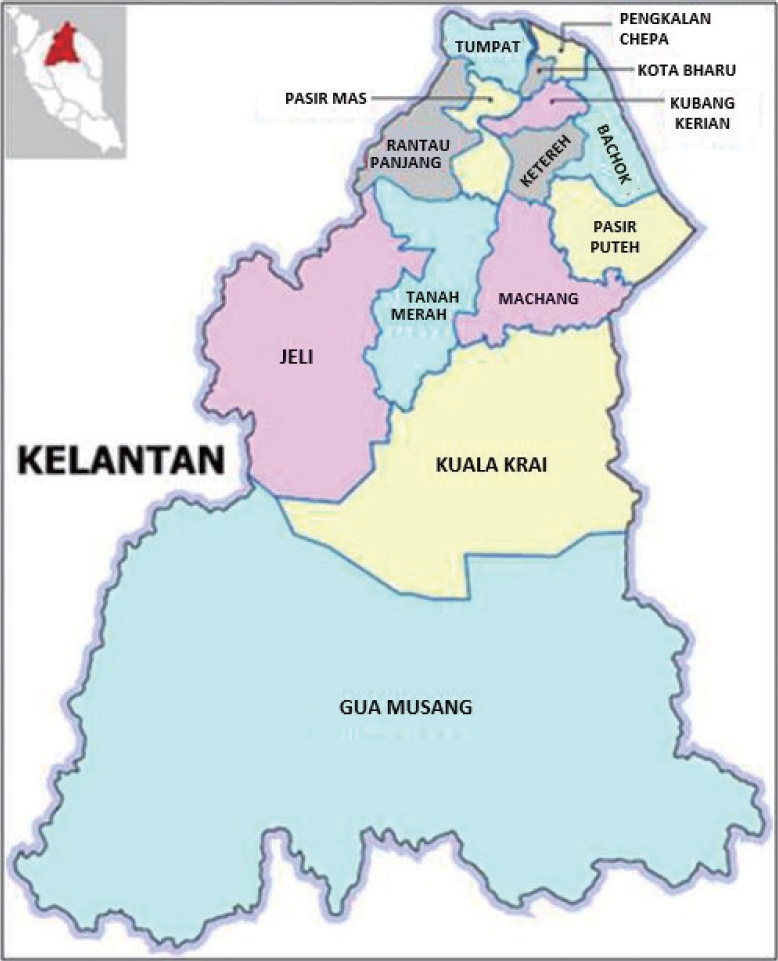
Map of Kelantan and its districts.
The sample size for the determination of dengue incidence in Kelantan was calculated with the single proportion formula (Z1-α22 P(1-P))/d2, where Z1-α/22 is 2.58, P (the expected proportion of dengue cases) is 0.024 [17], and d (precision) is set at 0.01. The sample size was calculated to be 1560. After adjustment for 10% missing data, the sample size required was 1716. However, as data were available for 10 635, all cases were included in the study.
Descriptive analysis was performed using SPSS version 24 (IBM Corp., Armonk, NY, USA), and ArcMap version 10.4 (Esri, Redlands, CA, USA) was used to map the incidence rates. The dengue incidence rate by year and district were presented as the number of cases per 100 000 population. ArcMap was also used to analyse the spatial autocorrelation and spatial clustering of dengue cases through the global Moran’s I and hotspot analysis, respectively. The coordinates of dengue cases’ residences were autocorrelated spatially to determine the typical trend of dengue cases. Then, the output was presented through a Getis-Ord Gi hotspot map, which colour-codes sub-districts based on group features when similar high (hot) or low (cold) values are found in a cluster. A hotspot is an area with a high z-score and small p-value, which indicates significant clustering of cases. Conversely, a cold spot refers to areas with a low negative z-score and small p-value, indicating no spatial clustering of dengue cases.
Ethics Statement
Ethical approval was obtained from the Human Research Ethics Committee of Universiti Sains Malaysia (JEPeM) and the National Medical Research Registry (NMMR), Ministry of Health Malaysia. The confidentiality of the data was maintained at the highest level possible. Only the researchers had access to the data. Individuals’ names and identification numbers were not extracted from the database. The coordinates were anonymous and were only used in the hotspot analysis and presented as colour-coded areas in the hotspot map. They were not mapped individually.
RESULTS
A total of 10 645 confirmed dengue cases registered in the state of Kelantan between 2016 and 2018, with case fatality rates of 0.18%, 0.08%, and 0.20%, respectively. The mean age of cases was 28.80 years (standard deviation, 1.23), with 69.9% of the cases occurring in the economically productive age group between 15 years and 59 years old. Although 6.8% of the cases were amongst the elderly (aged 60 years and above), they accounted for the highest case fatality rate (0.27%), followed by the economically productive age group (0.23%). Contrarily, although paediatric cases aged below 15 years old accounted for 23.3% of the total dengue cases, with an incidence rate of 443 cases per 1000 population, they showed the lowest case fatality rate (0.12%). There was an almost even distribution of sex (male: 50.9%; female: 49.1%). Malays constituted 97.0% of cases, followed by Chinese (2.1%) and other ethnicities (0.9%).
The mean number of dengue cases in the 3-year period in Kelantan from 2016 to 2018 was 9.8 cases daily, with a standard deviation of 11.02. The dengue trends in Kelantan showed an annual cyclical pattern, where the number of cases increased between April and October each year, with a higher peak in 2016 (Figure 2).
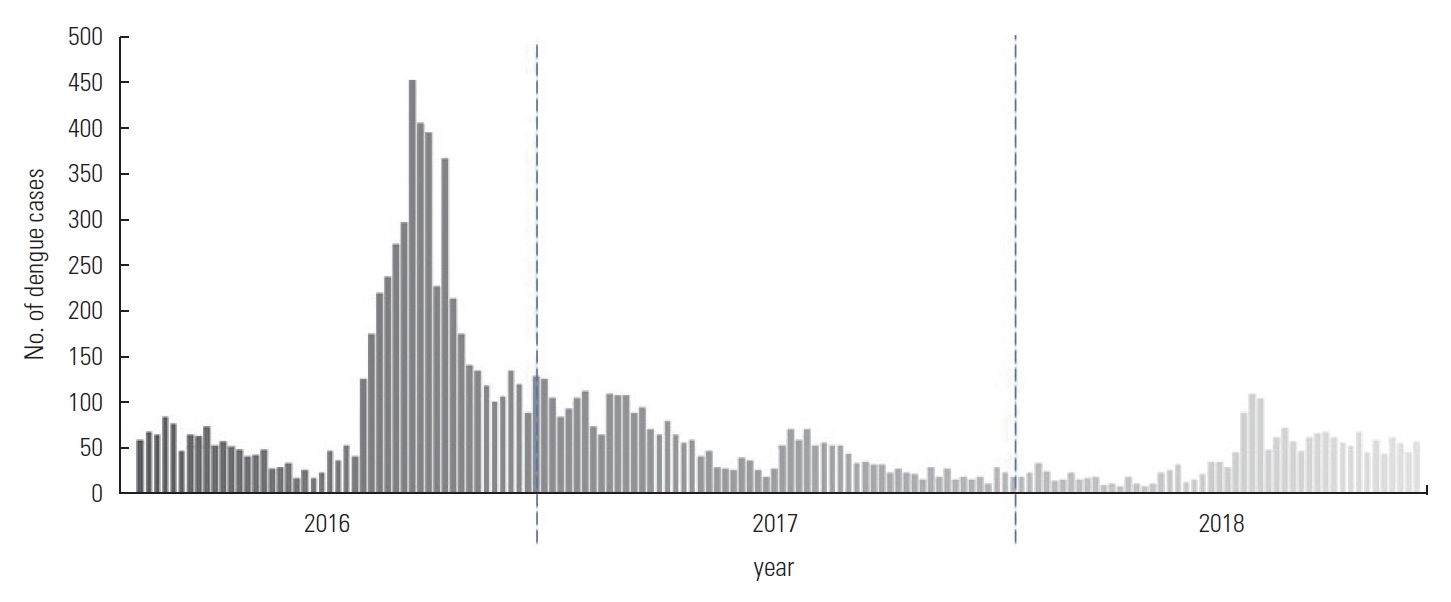
Trend of dengue cases in Kelantan from 2016 to 2018.
The pattern of dengue cases in Kelantan was mostly centred in the Kota Bharu district, where nearly 60% of the cases occurred (6395 cases). This was followed by 10% in Tumpat (1064 cases), 10% in Bachok (1061 cases), and 6% in Tanah Merah (617 cases). The other districts each contributed less than 5% of the overall cases. The dengue incidence rate in Kelantan showed an overall decreasing trend, from 404 to 163 to 127 dengue cases per 100 000 population in 2016, 2017, and 2018, respectively. Nonetheless, sub-districts in the coastal region showed a comparatively high dengue incidence rate throughout the 3 years. Pockets of persistently high dengue incidence rates could also be seen in the Tanah Merah and Gua Musang districts. The pattern of dengue incidence rate in Kelantan by sub-districts is visualised in Figure 3.
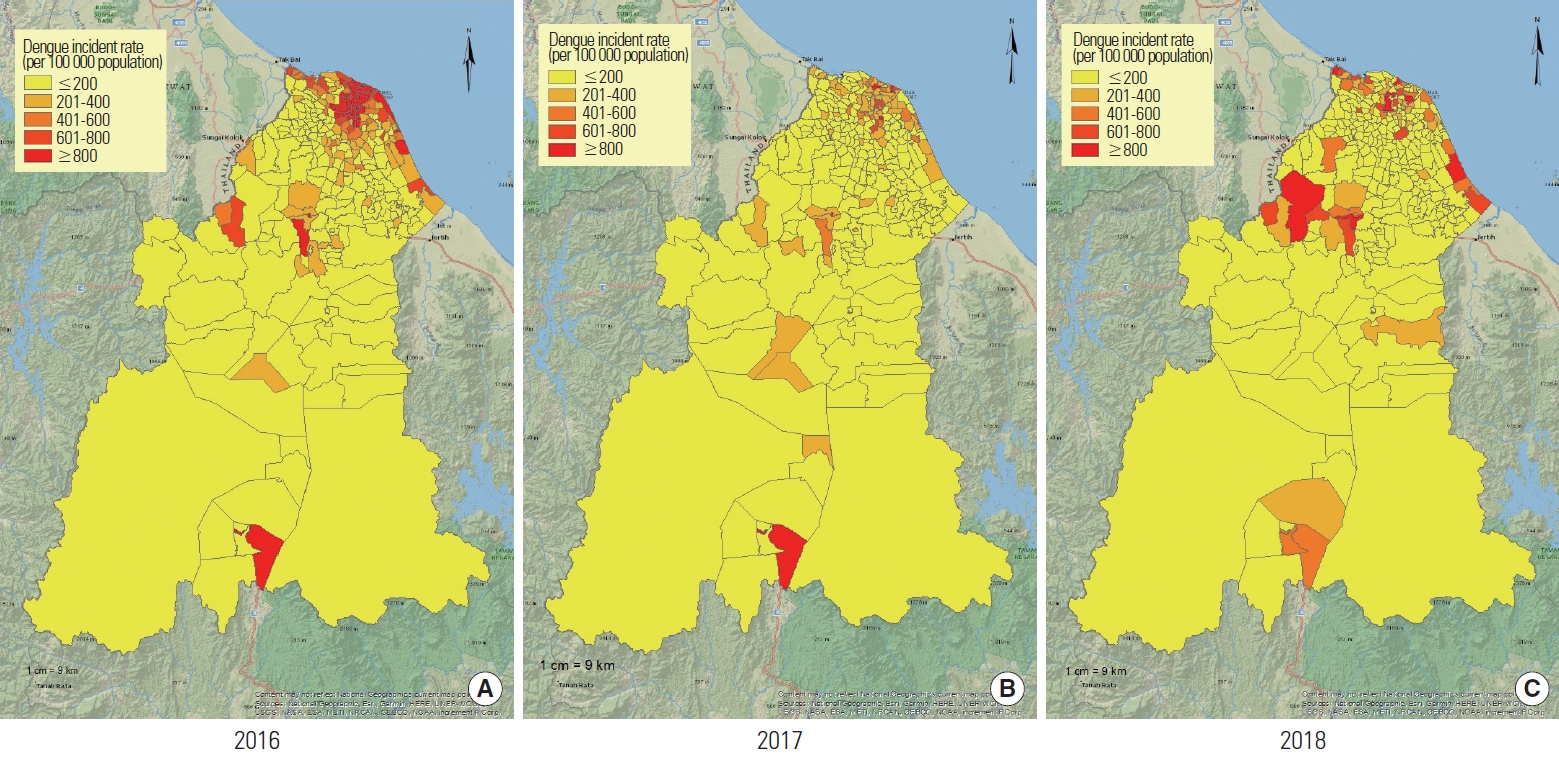
Yearly pattern of dengue incidence rate in Kelantan by district (A: 2016, B: 2017, and C: 2018).
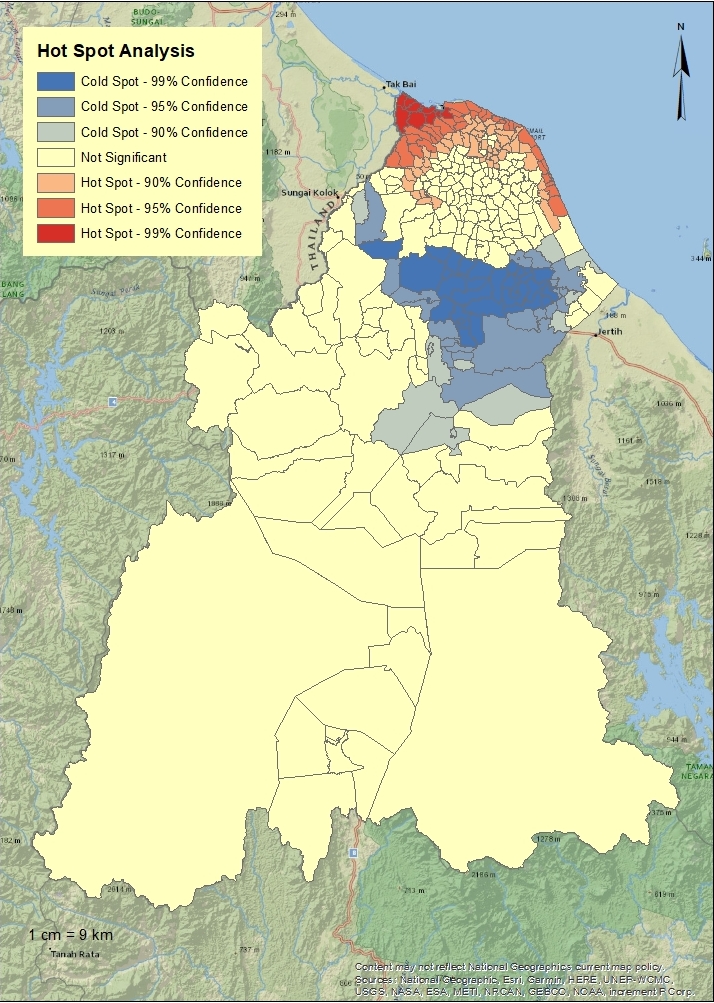
The global Moran’s spatial autocorrelation analysis showed a positive z-score of 22.5 with a significant p-value (<0.01), indicating that the spatial distribution of high and/or low dengue rates in Kelantan was more spatially clustered than would have been expected if underlying spatial processes were random. Significant hotspots could be seen in sub-districts within the Kota Bharu district from 2016 to 2018. We noted that the trend of spatial clusters changed from being centralised in Kota Bharu in 2016 to being dispersed in nearby districts, namely Tumpat and Pasir Mas, in 2018. Conversely, the number of cold spots showed an increasing trend from 2016 to 2018. Areas of cold spots were seen bordering the Kota Bharu, Bachok, and Pasir Mas districts. Figure 4 shows the hotspot analysis for dengue in Kelantan.

Hotspot analysis for spatial clusters of dengue cases in Kelantan from 2016 to 2018 (A: 2016, B: 2017, and C: 2018).
DISCUSSION
An analysis of the notified dengue cases in Kelantan revealed that although the trends of dengue incidence changed within 3 years from 2016 to 2018, the annual pattern remained relatively analogous. Similarly, the pattern of sub-districts with high dengue incidence rate remained comparable despite evidence of a shift in the spatial clustering of dengue cases over the years. The annual change showed a rapid increase of cases in 2016, as compared to 2017 and 2018, which reflected the serotype shift of the circulating virus from the formerly predominant DENV-2 to DENV-1 [18].
Our study shows similar findings to those reported in other Southeast Asian countries where people of the economically productive age range are the most vulnerable group, possibly due to increased exposure to the vector during their commute to work [19]. The high proportion of dengue cases in Malays is speculated to reflect population demographics rather than an actual risk factor for dengue, since Kelantan’s population consists of 93.1% Malays. Other ethnicities make up the remaining 6.9%, with Chinese being the second largest population group at 3.1%.
Kota Bharu, the primary urban centre in Kelantan, had the highest dengue incidence rate for all 3 years, followed by the Bachok and Tanah Merah districts. Kota Bharu and Bachok are the first (1201.1 persons/km2) and third (504.4 persons/km2) most population-dense districts in Kelantan. Two studies in Sri Lanka [11] and India [12] found that dengue incidence was higher in areas with a high population density (more than 600 persons/km2). Another study reported that increased interactions between susceptible and infectious individuals in a population might be accountable for the density-dependent disease transmission of dengue [20].
Interestingly, the Gua Musang district showed a persistently high dengue incidence rate throughout the 3-year study period, specifically in the city of Gua Musang, despite having a low population density. The city of Gua Musang is located at the intersection of 2 federal highway routes and is served by the Malayan Railways Limited (KTM) Intercity Eastern Sector railway, both of which are major connectors for domestic travel between the eastern coast and western coast of Malaysia. Coupled with being a gateway to the Taman Negara National Park, an ecotourism destination in Malaysia, a steady influx of traffic going through the city of Gua Musang is seen throughout the year. The frequent flow of travellers passing through the city of Gua Musang is speculated to provide an ongoing introduction of the virus by travellers into the susceptible local community. The continuous risk for dengue transmission may explain the persistently high dengue incidence. This hypothesis is supported by a study in Guangzhou, China, which found that the high number of foreign travellers to Guangzhou increased the number of imported dengue cases in Guangzhou, leading to a local epidemic [21].
The geographically advantageous position of the city of Gua Musang also promoted rapid urbanisation. Rapid urbanisation leading to population growth is a major predictor for dengue resurgence secondary to increased interaction between the vector and the host [22]. However, another study speculated that it was not rapid urbanisation per se but rapid uncontrolled urbanisation that led to the rise in dengue cases in Malaysia [6]. The study argued that rapid uncontrolled urbanisation leads to poor environmental cleanliness and improper solid waste management, which subsequently increases the breeding places for mosquitoes. Despite the rapid development of the city of Gua Musang, solid waste has been poorly managed in the town; for instance, a change from an open dumping site to a sanitary landfill was only scheduled in 2020 [23]. A common issue in Kelantan is the inadequate number and inaccessibility of dustbins provided by the municipal authority. Local communities have reported these to be a push factor towards inappropriate domestic disposal of plastics and bottles [24], which in turn become potential water-holding containers for oviposition by mosquitoes.
Spatial analysis has emerged as a crucial component in the effective management of dengue cases. For example, in Malaysia, the identification of a dengue hotspot will initiate a dengue outbreak response involving searching and destroying mosquito breeding sites within a 200-m radius from the index case. This control activity considers the 1-km maximum flight range of female Aedes aegypti and their tendency to be active within a 100-m radius from their birthplace [25]. Therefore, any changes in agricultural land use, urban development, the road network, or the waste management system will directly affect the breeding sites of Aedes mosquitoes and subsequent vector abundance and indirectly affect dengue transmission to humans [10,25,26]. Thus, these changes contribute to gradual alterations of the previously urban nature of dengue [27].
Significant hotspots or spatial clusters were observed in the areas of high dengue incidence in Kota Bharu. The clustering of dengue cases reflects the local transmission of the disease. As the adult female Aedes mosquito has a flight range of up to 1 km from its birthplace [25], it is speculated that there are persistent vector breeding sites in Kota Bharu and its surrounding area. Vector abundance, coupled with high population density, may be responsible for ongoing local transmission. Kelantan’s population has experienced an annual growth rate from 1.52% to 1.80% each year from 2016 to 2018, leading to an increase in population density. High population density is often accompanied by increased numbers of water-holding containers such as automobile tyres and plastic containers secondary to human behaviour [28]. These copious water-holding containers, in turn, promote vector abundance by providing suitable ecological conditions for dengue breeding sites, thus resulting in clustering of dengue cases [28]. It is also speculated that higher population density reduces the distance between infected and non-infected individuals, allowing more rapid transmission of disease by the vector. High vector abundance may also cause the occurrence of dengue hotspots in Kelantan based on the evidence that a high Breteau index, a measure of the number of mosquito larvae found in waterholding containers of inspected premises, was significantly correlated with hotspot areas in Kuala Lumpur [29].
Throughout the 3-year period, cold spots expanded to the peri-urban areas surrounding Kota Bharu. These cold spots indicate regions that are covered by a low incidence of dengue, with significant dispersion between the cases. Unlike in hotspot areas, the source of transmission is harder to pinpoint in coldspots. The increasing number of coldspots surrounding the hotspot areas may be due to a spill-over effect of cases from the hotspots. It can also be an artefact that reflects population movement, whereby people outside of Kota Bharu work in hotspot areas where they become infected but are registered at their place of residence.
Since our study is based on data available in the national dengue surveillance system, it is subjected to inherent limitations of surveillance data including under-reporting, misreporting, reporting biases, and delays in reporting. Changes in the dengue case definition and availability of rapid test kits for dengue can also cause discrepancies in the data, as seen in the sudden increase in national dengue cases in Malaysia after 2014. Thus, comparisons between studies may be impeded by differences in the notification criteria for dengue. Due to the limitation of secondary data, our study could not ascertain the causal relationship between vector density and dengue cases. Therefore, further research with primary data on water-holding containers is suggested. The primary limitation of our study is the use of the cases’ residence as compared to the place of possible infection for reporting in the surveillance system. The assumption made is that the population movement does not cross state borders, and that cases from other states have been transferred to respective states. However, there may be interdistrict movements that cannot be controlled in the study and affect the spatial analysis of dengue.
Our study builds upon the current knowledge of dengue in Malaysia. Dengue has shown a decreasing trend in Kelantan, a north-eastern state of Malaysia, despite its persistent endemicity. Although the demography of dengue cases remained consistent throughout the three years, a notable shift in the spatial patterns of dengue was observed.
By contextualising the spatial clusters with the incidence rate, we were able to glimpse the possible effects of state-wide population movement that affects dengue transmission. The shift from urban to peri-urban disease distribution may highlight the need for health education on dengue prevention at the workplace and places for social activities as opposed to the traditional approach that investigates cases’ residential areas. It is recommended that future research should include environmental factors such as climate factors and land use in the modelling of dengue spatial risk characterisation.
Notes
CONFLICT OF INTEREST
The authors have no conflicts of interest associated with the material presented in this paper.
FUNDING
None.
ACKNOWLEDGEMENTS
None.
Notes
AUTHOR CONTRIBUTIONS
Conceptualization: Masrani AS, Nik Husain NR. Data curation: Masrani AS, Musa KI, Yasin AS. Formal analysis: Masrani AS, Musa KI. Funding acquisition: None. Methodology: Masrani AS, Nik Husain NR, Musa KI, Yasin AS. Project administration: Masrani AS, Nik Husain NR. Visualization: Masrani AS, Musa KI. Writing – original draft: Masrani AS. Writing – review & editing: Nik Husain NR, Musa KI, Yasin AS.