Introduction to Mediation Analysis and Examples of Its Application to Real-world Data
Article information

Abstract
Traditional epidemiological assessments, which mainly focused on evaluating the statistical association between two major components-the exposure and outcome-have recently evolved to ascertain the in-between process, which can explain the underlying causal pathway. Mediation analysis has emerged as a compelling method to disentangle the complex nature of these pathways. The statistical method of mediation analysis has evolved from simple regression analysis to causal mediation analysis, and each amendment refined the underlying mathematical theory and required assumptions. This short guide will introduce the basic statistical framework and assumptions of both traditional and modern mediation analyses, providing examples conducted with real-world data.
INTRODUCTION
In the early days, traditional analytic epidemiological methods mainly focused on the statistical association between two major variables: the exposure (E) and the outcome (Y). However, methods have evolved to explore the “black box” between the E and the Y by investigating the mechanism underlying the association and various pathways. In the same context, the mechanism has also been visualized as being near the center of “Chinese boxes,” or a set of nested boxes. The “black box” is presumed to contain factors, both above and below the level of the individual—the factors above the individual may contain items such as interpersonal dynamics and socioeconomic status, including items related to ethnicity and politics, whereas the factors below the individual level comprise genes, proteins, cells, and organ systems [1].
Mediation analysis was developed to assess this “black box,” and psychologists and social scientists have utilized this framework particularly frequently. Mediation analysis can explore and evaluate biological or social mechanisms, thereby elucidating unknown biological pathways and/or aiding in policy-making [2]. However, because of advances in methodologies, including biostatistics, epidemiological research designs, and causal inference, traditional mediation analysis has evolved and been applied in various fields. In particular, the concept of mediation analysis has been especially appealing in social sciences and psychology. There are several overviews of these topics [3-6], and this study is a guide to the full literature.
TRADITIONAL REGRESSION-BASED MEDIATION ANALYSIS
Mediation was initially hypothesized as a variable in the middle of a causal chain. Previously, most of the epidemiological reports focused on evaluating the simple association between E and Y as in Figure 1A. However, as in Figure 1B, it is shown that an E affects a mediator (M), which in turn affects an Y. The M fully mediates the effect from the E to the Y. However, situations were identified where the M does not fully mediate the effect of E on the Y, which led to the concept of partial mediation, as depicted in Figure 1C. As shown in Figure 1C, the effect of an E can be exerted directly on an Y (direct effect, path c’) or take a detour via a M (indirect effect, paths a and b). Initially, the criteria to be regarded as a M were that E should have a statistically significant association with M, and that M should also have a statistically significant association with Y. The initial criteria also included the condition that the mediation analysis could be performed only if there was a statistically significant association between E and Y; this significant relationship between E and Y should be no longer significant after controlling for the previous paths from E to M and M to Y. However, the latter two conditions were further criticized due to the existence of inconsistent and partial mediation, and were therefore omitted from the essential conditions needed for mediation analysis.

A conceptual diagram of mediation analysis (A) traditional epidemiological assessment, (B) full mediation, and (C) partial mediation.
In contrast to a moderator or confounder, a M is interpreted as involving a causal pathway between E and Y. A detailed definition of a M is provided in the work of Robins and Greenland [7]. The seminal work on this concept of a M or intervening variable was based on Judd and Kenny [8,9] and Baron and Kenny [10]’s article utilizing the regression method.
In Judd and Kenny[8,9]’s difference of coefficients approach, mediation analysis can be conceptualized as utilizing two regressions, as follows. First, we run a simple regression analysis with E on Y without M to estimate path c’.
Second, we carry out a multivariable regression with E and M to predict Y.
In this case, as the coefficient B reflects the total effect (TE), the direct effect from the E to Y c’ shown in Figure 1C, corresponds to B1 in equation 2. The difference method calculates the indirect effect by subtracting the direct effect (c’) from the TE, as follows:
This is a simple and widely used approach to screen for the possible presence of a M. However, the logistic regression method has been criticized for lacking a causal interpretation. The difference method has been used to check for mediation, but non-significant findings using this method do not exclude the chance of possible mediation [11].
The other approach is the product method, which was introduced by Sobel and used by Baron and Kenny [10]. In this method, again, a multivariable regression is conducted with E and M to predict Y.
However, the next step is to regress M on X and can be written as
In equation 3, B reflects path a in Figure 1C, and B2 in equation 2 reflects b in Figure 1C. The coefficient of the indirect effect, Bindirect, is calculated by multiplying the 2 coefficients, B2 and B.
Generally, when there is no interaction between an E and a M, these two methods coincide, except for logistic regression. In particular, for rare Ys (approximately under 10%) with no confounding factors, these 2 estimates will, from a practical standpoint, reflect the natural indirect effect (NIE), which will be discussed in the causal mediation section. The difference method is beneficial because there is no restriction of the M distribution; it can be continuous or categorical (including binary). In contrast, the product method requires a linear model to be applied for the M [11]. In situations with common Ys, especially when they are binary, a log-linear regression model instead of logistic regression is recommended [12].
To calculate the confidence interval (CI) of the indirect effect, 2 approaches have been suggested. The first approach utilizes the Sobel test, which is based on the product of 2 normally distributed values of coefficients. In this case, an assumption should be made about the shape of the sampling distribution of the indirect effect. The second approach uses resampling methods, such as bootstrap testing, which does not require a prior assumption of the sampling distribution. Usually, the bootstrap method involves resampling at least 750 times, for which reason the default resampling setting is 1000 times in many macros (e.g., R and the PROCESS macro in SAS [13,14]).
EXAMPLE OF REGRESSION-BASED MEDIATION ANALYSIS
Kim et al. [15] conducted a study to estimate the mediating effect of lifestyle factors on the association between social networks and metabolic syndrome, utilizing the baseline data of the community-based Cardiovascular and Metabolic Diseases Etiology Research Center cohort. In total, 10 103 participants were recruited from 2013 to 2018, and their egocentric social network properties were measured using a social network card that was previously applied and standardized [16]. From the raw data of the social network cards, the authors extracted and calculated the size of the social network and the closeness of the social network, which were used as quantitative E variables. Measurements of blood pressure, the lipid profile, fasting glucose, and waist circumference were made in the initial cohort, and metabolic syndrome was defined based on the National Cholesterol Education Program Adult Treatment Panel III criteria as the presence of 3 or more criteria.
As potential Ms, the authors tested 4 domains: physical inactiveness (3 categories: vigorous activities, moderate activities, and walking), alcohol consumption (binary variable: current drinker vs. non-drinker), cigarette smoking (binary variable: current smoker vs. non-smoker), and depressive symptoms (continuous variable: range 0-63 by Beck Depressive Inventory-II score).
After conducting the multivariable logistic regression for the E (social network properties, continuous variables) and Y (metabolic syndrome, yes/no), mediation analysis was performed with the ‘mediation’ package developed by Imai et al. [17] in the R software [18]. The analysis was conducted in 3 steps: (1) producing a M model, (2) producing an Y model, and (3) conducting a mediation analysis and sensitivity analysis. In the M model, social network properties and other covariates were regressed to explain lifestyle factors. The metabolic syndrome variable was then regressed on social network properties, lifestyle factors, and other covariates. These two models were grouped with the “mediate” function, which was run to estimate the direct effect, indirect effect, and their 95% CI by a quasi-Bayesian Monte Carlo method, including 5000 simulations per estimate set.
As there were 4 potential Ms, the authors applied each M and tested the indirect effect. They found that only physical activity significantly mediated the relationship between social network size and metabolic syndrome in both genders (men: effect size [ES]=5.2×10⁻³, p=0.024; women: ES=3.1×10⁻³, p<0.001) (Figure 2A)

INTRODUCING CAUSAL MEDIATION ANALYSIS
After the rise of the counterfactual framework for modern causal inference, the traditional approach in mediation analyses was expanded and re-developed to solve the previous limitations regarding non-linearities and interactions, focusing on the decomposition of direct and indirect effects [19,20]. Among the major issues raised, assumptions related to confounding factors and the interaction between the E and the M were reflected and re-developed in causal mediation analysis [7,21]. In the counterfactual concept, an individual is hypothetically compared under an E and in the absence of the E in identical situations, including time and surrounding conditions. If the potential Ys are different based on this comparison, the E is regarded as causal for the Y [22].
In causal mediation analysis, 3 terms regarding the previous indirect and direct effects are suggested. The natural direct effect (NDE) and NIE can be interpreted in traditional mediation analysis. There would be a difference between the counterfactual Ys if an individual was exposed to 2 different counterfactual situations, where the M value would be random at the reference value of the E. In contrast, the controlled direct effect (CDE) is different regarding the mediation value used in the calculation since the M is set to a certain fixed level. If there is no interaction between E and M, then the CDE usually coincides with the NDE [4].
For example, an analysis using the NDE would ask “how much would the Y (e.g., suicide rate) change if the E was set at e=1 versus e=0 (e.g., exercise program), but for each participant, the M (e.g., the Patient Health Questionnaire [PHQ]-9) was kept at the level it would have been in the absence of the E (i.e., the mean depressive symptom score of the group that did not participate in the exercise program)?” An analysis using the CDE would ask, “how much would the Y (e.g., suicide rate) would change on average if the M was controlled at a certain level (e.g., PHQ-9=5) uniformly in the population?” Likewise, an analysis using the NIE would answer the question, “how much would the Y (e.g., suicide rate) would change on average if the E was controlled at the level it would be with the E present (e.g., with everyone participating in the exercise program), but with the M (e.g., PHQ-9 change) changed from the level it would be with the E at the reference level (e.g., the usual rate of people in the exercise program) to the level it would be if the E is present?” In sum, the TE would correspond to the question, “how much would the Y (e.g., suicide rate) change overall with a change in the E from the reference value to the present?” This implies that the sum of the NDE and NIE equals the TE. Generally, the CDE has received more interest for policy evaluations, whereas the NIE and NDE have been used to elucidate the actions of various biological mechanisms.
Similar to traditional mediation analysis, causal mediation analysis presumes the following temporal ordering: the E must precede the M measurement, and the Y measurement is performed after the M measurement. In addition, to interpret the mediation causally, 4 other assumptions related to confounding should be satisfied. First, all the known confounders should be controlled, and there should be no unmeasured confounding of the E-Y relationship (C1) (Figure 3). If the E is randomized (e.g., in randomized clinical trials), this assumption will be met. Second, all the known confounders should be controlled, and there should be no unmeasured confounding of the M-Y relationship (C2). In this case, it would not be enough to randomize only the E. Third, there should be no unmeasured confounding of the E-M relationship, or all the known confounders should be controlled, which would be covered by E randomization. Lastly, there should be no confounding related to the M-Y relationship affected by the E, which means there is no arrow from E to C2 in Figure 3. As mentioned previously, randomizing the E (or treatment) is not enough to completely solve the confounding issue; randomizing E (which gives a probable even distribution of C1) would not be sufficient to control the confounding, which can also occur between the M and Y, represented as C2. In this case, conducting several sensitivity analyses would help, including situations with unmeasured confounding. Most importantly, it is strongly recommended to construct a directed acyclic graph depicting the central hypothesis before conducting a causal mediation analysis.
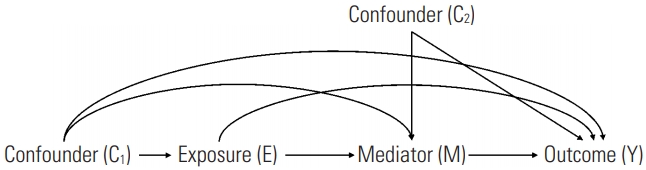
Confounding assumptions in causal mediation analysis.
In 2013, SAS (SAS Institute Inc., Cary, NC, USA) macros were used to perform a causal mediation analysis by Valeri and VanderWeele [2]. This initial macro dealt with binary forms of E, binary forms of Ms, and continuous Y variables. Additionally, in this macro, count variables could be applied as the Ys. A full description of this macro has been published elsewhere [4].
EXAMPLE OF CAUSAL MEDIATION ANALYSIS
Lee et al. [23] performed a longitudinal analysis using data from 3347 participants aged 40-64 years in the Korean Genome and Epidemiology Study, who were followed up for 16 years. As the E, socioeconomic status, including educational attainment and monthly household income, were queried at the index year and categorized into 2 groups. As the Y, sleep quality was queried with the Pittsburgh Sleep Quality Index at 5 time points (years 2, 6, 8, 10, and 12). As a M, depressive symptoms were measured using the Beck Depression Inventory at year 4. Sleep quality patterns were the Y variable. Using latent class growth modeling with SAS Proc traj syntax, a group-based modeling approach was performed, and 5 subgroups were identified according to the pattern of sleep quality (“normal-stable,” “moderate-stable,” “poor-stable,” “developing to poor,” and “severely poor-stable”).
Using SAS Proc causalmed syntax, the potential mediation of depressive symptoms on the association between socioeconomic factors and longitudinal sleep quality patterns was tested. Based on the maximum likelihood method, this SAS procedure estimates the effect of causal mediation and CIs from 1000 bootstrap replications [24]. Since this procedure permits a binary Y only, the original 5 sleep quality patterns were grouped into 2 categories, including a reference category (e.g., normal-stable vs. moderate-stable, or normal-stable vs. severely poor-stable). Percentages were calculated to explain the mediation and interaction effects, and the percentage of the TE after controlling the level of the M was also calculated [24].
Overall, the associations between socioeconomic status variables and sleep patterns were not significant after full adjustment. However, depressive symptoms tended to fully mediate the associations between education/income variables and sleep quality patterns (e.g., for E=lower education vs. higher education, Y=developing to poor vs. normal-stable, TE: odds ratio [OR], 1.55; 95% CI, 0.64 to 6.03; NDE: OR, 1.38; 95% CI, 0.58 to 5.09); NIE: OR, 1.12; 95% CI, 1.04 to 1.24) (Figure 2B).
CONCLUSION
This paper reviewed the basic concepts of traditional mediation and causal mediation analysis with counterfactual approaches and provided examples in real-world settings.
One issue to be aware of is that a statistically significant association regarding M in the mediation analysis (e.g., a statistically significant indirect effect) does not always confirm that M is an actual M. Using different causal models does not make it possible for researchers to prove a unique M unless it is theoretically plausible. Furthermore, mediation analysis itself cannot provide that an intervening variable is a true M by probabilistic inference, since we cannot verify the likelihood distribution of all other potential Ms and alternative causal models [25]. Therefore, it is essential to understand that researchers should interpret mediation analysis within the logic of theoretical inferences.
Another issue lies in the measurement error for the M. According to a study conducted by le Cessie et al. [26], under the classical condition of a normally distributed M with non-differential misclassification, the estimated mediated association tended toward the null. If the direct and indirect effects were the same, the estimates tended away from the null. However, when the M was multinomial, this pattern did not always exist. Correction methods, such as using a weighting coefficient and attenuating the regression coefficient B2 in equation 2, were also suggested by le Cessie et al. [26].
Theoretical concepts and statistical application methods regarding mediation analysis are rapidly developing. As a result, further discussions on filling the gap between theoretical assumptions and practical analytical issues are required. It has been suggested that conceptualization and formalism may be obstacles for epidemiologists to apply these methods to actual analysis [27] and future directions should involve the development of more unified and simple methods that could be utilized by a broader base of users. However, because of its usefulness in elucidating complex mechanisms in population data, the rapid adoption of mediation analysis in future epidemiological studies is expected.
Ethics Statement
As this review does not involve newly collected human data, institutional review board approval is not needed.
Notes
The author has no conflicts of interest associated with the material presented in this paper.
FUNDING
This research was supported by the Basic Science Research Program through the National Research Foundation of Korea (NRF) funded by the Ministry of Science and ICT (2020R1C1C1003502) and a faculty research grant of Yonsei University College of Medicine for 2019 (6-2019-0114).
ACKNOWLEDGEMENTS
None.
Notes
AUTHOR CONTRIBUTIONS
All work was done by SJJ.