Social Determinants of COVID-19 in Massachusetts, United States: An Ecological Study
Article information

Abstract
Objectives
The aim of this study was to assess how different social determinants of health (SDoH) may be related to variability in coronavirus disease 2019 (COVID-19) rates in cities and towns in Massachusetts (MA).
Methods
Data about the total number of cases, tests, and rates of COVID-19 as of June 10, 2020 were obtained for cities and towns in MA. The data on COVID-19 were matched with data on various SDoH variables at the city and town level from the American Community Survey. These variables included information about income, poverty, employment, renting, and insurance coverage. We compared COVID-19 rates according to these SDoH variables.
Results
There were clear gradients in the rates of COVID-19 according to SDoH variables. Communities with more poverty, lower income, lower insurance coverage, more unemployment, and a higher percentage of the workforce employed in essential services, including healthcare, had higher rates of COVID-19. Most of these differences were not accounted for by different rates of testing in these cities and towns.
Conclusions
SDoH variables may explain some of the variability in the risk of COVID-19 across cities and towns in MA. Data about SDoH should be part of the standard surveillance for COVID-19. Efforts should be made to address social factors that may be putting communities at an elevated risk.
INTRODUCTION
It is clear that not everyone is equally impacted by the coronavirus disease 2019 (COVID-19) pandemic. In the United States, there are wide differences in the rates of confirmed cases. The rate of disease in New York (the state with the highest rate as of April 7, 2020) is more than 20 times higher than that of West Virginia (the state with the lowest rate) [1]. Findings have also emerged that racial and ethnic minorities may be at a particularly elevated risk for contracting COVID-19, being hospitalized, and dying from the disease [2,3]. Healthcare workers and other essential workers [4], a group that is disproportionally composed of people of color [5], are also likely to bear a disproportionate share of the burden of COVID-19. There have also been reports of homeless people being particularly vulnerable to contracting COVID-19 [6,7].
The role that other social factors may play in explaining these differences deserves further attention. Unfortunately, limited data are available about COVID-19 cases and social factors. This lack of data about social determinants of health (SDoH) in United States data is a longstanding issue [8]. One method to deal with this problem is to use area-based measures of socioeconomic status [9]. Such measures can be applied to different geographic areas (cities/towns, zip codes, census tracts, etc.) to examine whether geographic variation in health outcomes may also be associated with geographic variation in SDoH.
Previous research has demonstrated that some of the geographic variability in COVID-19 may be related to socioeconomic factors. For example, a study conducted in New York City found that the most socioeconomically disadvantaged boroughs with respect to poverty and education had the highest rates of COVID-19 hospitalizations and deaths [10]. Additional research has found that county-level variation in COVID-19 cases across the United States and changes in all-cause mortality rates in Massachusetts (MA) zip codes were associated with poverty and household crowding [11,12].
In April 2020, MA began publishing data about confirmed cases of COVID-19 and the number of people tested for COVID-19 in cities and towns in MA [13]. This study sought to determine whether variations in the rates and trends in cases of COVID-19 and the percentage of positive tests for COVID-19 were associated with a variety of social factors including poverty, median income, employment in the health care and transportation industries and healthcare support and service occupations, rented accommodations, unemployment, and lack of insurance.
METHODS
The cases of COVID-19 used in this study were based on the cumulative number of laboratory-confirmed cases of COVID-19 occurring in MA between January 1, 2020 and June 10, 2020. Cases were excluded from this analysis if they occurred in residents of towns with between 1 case and 4 cases (due to cell size suppression rules), had unknown data about the city and town where they occurred, or if we were unable to match the city/town to data about socioeconomic factors. MA provides estimates of the rates per 100 000 people in its cities and towns based on population estimates from the University of UMass Donahue Institute [13].
Data about socioeconomic factors were derived from 5-year estimates (2014-2018) from the American Community Survey (ACS) in MA. The ACS is an annual survey that is conducted in order to generate representative demographic information about the United States population. Data were downloaded from https://data.census.gov/. The specific measures used in this analysis included median income; the percentage of residents who were uninsured, below the poverty line, unemployed, and renters; and percentage of workers employed in the transportation and healthcare and social assistance industries and in service and healthcare support occupations. For each of these measures, cities and towns were categorized into one of four categories according to the quartile of their percentage for the distribution of a given variable. For each of these quartiles, we calculated the number and percentage of all cases, the number of cases per 100 000 residents, and the percentage of those who were tested that tested positive. Table 1 shows the quartile cut-offs that were used for each variable. We also performed Poisson regression with a log-link using SAS version 9.3 (SAS Institute Inc., Cary, NC, USA) to calculate rate ratios comparing the rates and the percentages of positive tests in the quartiles. For rates of COVID-19, we constructed 3 models. In the first model, we only controlled for social variables. Because the number of confirmed cases of COVID-19 in a city or town will be associated with the percentage of the population in that city or town that was tested, we controlled for the proportion of residents of each city or town who were tested. In the final model, because of evidence that the rate of COVID-19 varies according to age [14], we controlled for the median age of the city or town. For the models examining differences in the percentage of positive cases, we constructed 2 models: the first examining only social variables, and the second controlling for median age.

Cut-off values used to create quartiles for social variables
Because many of these variables are likely correlated with each other, which might make it difficult to determine the effect of any particular variable on COVID-19 rates, we also conducted Spearman rank correlation analysis between all of the variables to assess the strength of any correlations.
Ethics Statement
This study used de-identified publicly available data, and the study was therefore considered exempt from review by the MCPHS University Institutional Review Board.
RESULTS
As of June 10, 2020, there were a total of 100 158 cumulative cases of COVID-19 in MA, of which 275 cases were excluded from this analysis because they did not have city or town information. An additional 12 627 cases were excluded because they occurred in cities or towns with between 1 case and 4 cases (n=67) or in cities or towns that did not have information about social variables available from the ACS (n=12 560). Eighteen towns were excluded because they had between 1 case and 4 cases of COVID-19. Most of these were small towns in western MA. The communities with missing ACS data varied considerably in size, ranging from Billerica with a population of 42 664 to Gosnold with a population of 62. These exclusions resulted in a final sample of 87 256 cases of COVID-19 diagnosed in MA through June 10, 2020, representing 87.1% of the total cases diagnosed in MA. The number of cases per 100 000 people for the cities and towns included in the analysis (1584.8) was higher than that for the state overall (1437.7).
As shown in Table 2, for the 9 variables analyzed, there was evidence of an association with cases of COVID-19. In particular, cities and towns with a higher percentage of residents living in poverty and lower median incomes tended to have elevated rates of COVID-19. With respect to employment, cities and towns with more workers employed in the healthcare and social assistance and transportation industries and in service and healthcare support occupations also tended to have higher rates of COVID 19. Furthermore, communities with a higher proportion of their population renting and uninsured had elevated COVID-19 rates. These seemed to be a positive relationship between the unemployment rate and rates of COVID-19; however, the fourth quartile only had a slightly higher rate than the third quartile.

Cases, rate, and rate ratio of coronavirus disease 2019 (COVID-19) in Massachusetts according to social variables, June 10, 2020
In general, more tests were performed per 100 000 residents in cities and towns with higher rates of COVID-19. When controlling for the proportion of residents who were tested, the rate ratios were generally attenuated. However, the above-described general patterns in terms of differences in rates were generally consistent, although the differences between quartiles were not as drastic. For example, while the second quartiles through fourth quartiles for employment in the healthcare and social assistance industry and service and healthcare support occupations had significantly higher ratios than the first quartile, they were not substantially different from each other. Controlling for the median age in communities did not have a substantial impact on the rate ratios (Table 2).
As is shown in Table 3, cities and towns with higher levels of poverty, renting, and lack of insurance, lower median incomes, and higher employment in the transportation industry and service and healthcare support occupations tended to have a higher percentage of positive tests. With the exception of the findings for the percentage of residents who rented, these differences were not substantially impacted when controlling for the median age of cities and towns.

Percent positive rates and rate ratios of coronavirus disease 2019 (COVID-19) in Massachusetts according to social variables, June 10, 2020
As is shown in Figure 1, across the 3 time periods, the highest rate of COVID-19 was found among the highest risk score quartile and the lowest rate was found among the lowest risk score quartile. Additionally, the percent change was highest in the highest risk score quartile.
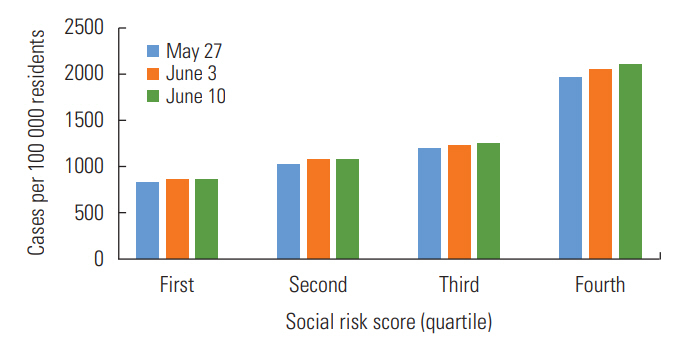
Cases of coronavirus disease 2019 (COVID-19) per 100 000 residents according to social risk score in Massachusetts, May 27, 2020 through June 10, 2020.
As is shown in Supplemental Material 1, of the 36 combinations of variables, there was evidence for a moderate to strong correlation in 11 of these relationships In particular, the percentage of residents living in poverty was moderately to strongly associated with median income, employment in service occupations, the percentage of residents who rented, and the percentage of residents who were uninsured. In addition to the percentage of residents living in poverty, employment in service occupations was also moderately to strongly correlated with employment in healthcare support occupations and the percentage of residents who rented or were uninsured.
DISCUSSION
The findings from this study highlight that the burden of COVID-19 in MA is falling most heavily on communities with a number of social vulnerabilities. These findings are suggestive of factors that may be contributing to geographic differences in COVID-19. Additionally, these findings suggest why some communities may be more vulnerable both to the health and financial impacts of the disease.
Previous research has demonstrated that rates of infectious diseases tend to be associated with statewide poverty rates [15-17]. Such an association is concerning because poorer communities are often less equipped to deal with the health and financial consequences of COVID-19.
The findings with respect to employment in high-risk industries and occupations are not surprising. A number of previous studies have demonstrated that healthcare workers are at an elevated risk for COVID-19 [18-20]. When many workers are practicing social distancing, it would be expected that essential industries that remain open would be a large driver of cases of COVID-19. Some studies have found differential risks for COVID-19 according to occupations outside of healthcare [21,22]. These findings suggest that working in high-risk and essential industries and occupations may be an important community-level determinant of the burden of COVID-19.
The fact that the burden of COVID-19 is higher in communities with higher rates of unemployment and lack of insurance suggests that COVID-19 may further exacerbate financial challenges in these communities. Millions have already filed for unemployment in the wake of the COVID-19 pandemic [23]. As the recession worsens, the health consequences of higher baseline rates of lack of insurance and unemployment may also make these communities vulnerable to the other health consequences of poverty and inequality [24,25].
There are limitations to these findings. This analysis was only done at the city and town level. Inferences cannot be made about individual-level factors solely from these ecological associations. Furthermore, the number of cases in a city or town is influenced by the accessibility and availability of testing for the disease. Rates may be lower in some communities not because there is a lower risk of COVID-19 in those communities, but because testing is less accessible. If such accessibility if differential with respect to any of the variables examined, these findings could be biased. Previous research in New York City found that per capita income at the zip-code-level was not associated with the probability of testing. However, the results of these tests did show that the percentage of positive COVID-19 cases was higher in lower-income zip codes [26]. The findings from the models presented here that controlled for testing and the model examining the percentage of positive cases suggest that testing explains some of the city-level and town-level differences in MA, but differences still remained.
Deaths and hospitalizations may also be better measurements of the true burden of COVID-19 in a particular community. Further studies that examine hospitalizations and deaths from COVID-19 according to the social factors examined here will not be as strongly impacted by differences in testing.
Additionally, these findings do not consider variability within cities and towns. For example, Boston was a city in this analysis, so the data for all the social variables analyzed here were applied across all Boston communities. However, Boston is a large and diverse city, and the values for many of the variables analyzed here are expected to differ in various parts of the city [27]. Performing a similar analysis with more granular data, for example at the level of zip codes or census tracts, could address this limitation. Unfortunately, city and town data are currently the most granular data available from MA.
Furthermore, the risk of COVID-19 is associated with age. Although differences by age are most pronounced for deaths and hospitalizations, there still is variability in the rate of cases by age [14]. We tested models that controlled for cities and towns’ median age and found that doing so did not account for much of the difference. However, this method did not consider differences in age distributions within cities and towns. A method that could account for these differences would be to calculate age-standardized rates. Unfortunately, age-specific counts of COVID-19 at the city and town level are not yet available for Massachusetts, which precludes performing such an analysis.
The fact that we had to exclude 12.6% of all cases due to missing data may have introduced bias to these findings. This potential bias would be a particular concern if the relationship between the social variables examined and COVID-19 differed in these cities and towns compared to the cities and towns included in the analysis. Unfortunately, since most of these cities and towns were excluded because they lacked the ACS social variable data, we cannot assess whether this was the case.
Despite these limitations, action should be taken to both study and address disparities in COVID-19. Efforts should be made to make sure that vulnerable communities have testing and treatment available. At the same time, adequate protections should be provided for essential workers who face the highest risk of contracting COVID-19. This protection includes personal protective equipment, paid sick leave, and worker’s compensation for those who contract the disease in the course of their work. Finally, efforts should be made to confront the social inequities that are being made evident by this current pandemic. Such efforts can help to prevent these communities from bearing a disproportionate share of future waves of COVID-19 and other disease outbreaks.
SUPPLEMENTAL MATERIALS
Supplemental materials are available at https://doi.org/10.3961/jpmph.20.256.
Correlation between social variables
ACKNOWLEDGEMENTS
None.
Notes
CONFLICT OF INTEREST
The authors have no conflicts of interest associated with the material presented in this paper.
FUNDING
None.
AUTHOR CONTRIBUTIONS
All work was done by DH.