Breast Density and Risk of Breast Cancer in Asian Women: A Meta-analysis of Observational Studies
Article information

Abstract
Objectives
The established theory that breast density is an independent predictor of breast cancer risk is based on studies targeting white women in the West. More Asian women than Western women have dense breasts, but the incidence of breast cancer is lower among Asian women. This meta-analysis investigated the association between breast density in mammography and breast cancer risk in Asian women.
Methods
PubMed and Scopus were searched, and the final date of publication was set as December 31, 2015. The effect size in each article was calculated using the interval-collapse method. Summary effect sizes (sESs) and 95% confidence intervals (CIs) were calculated by conducting a meta-analysis applying a random effect model. To investigate the dose-response relationship, random effect dose-response meta-regression (RE-DRMR) was conducted.
Results
Six analytical epidemiology studies in total were selected, including one cohort study and five case-control studies. A total of 17 datasets were constructed by type of breast density index and menopausal status. In analyzing the subgroups of premenopausal vs. postmenopausal women, the percent density (PD) index was confirmed to be associated with a significantly elevated risk for breast cancer (sES, 2.21; 95% CI, 1.52 to 3.21; I2=50.0%). The RE-DRMR results showed that the risk of breast cancer increased 1.73 times for each 25% increase in PD in postmenopausal women (95% CI, 1.20 to 2.47).
Conclusions
In Asian women, breast cancer risk increased with breast density measured using the PD index, regardless of menopausal status. We propose the further development of a breast cancer risk prediction model based on the application of PD in Asian women.
INTRODUCTION
Breast cancer, which has the highest incidence and mortality rate of women cancers globally, imposes a significant disease burden in developing countries [1]. Among breast cancer risk factors, dense breasts found on mammography due to breast epithelium and stroma are known to be a potent risk factor, raising breast cancer risk by four to six times [2-4] according to previous systematic reviews (SRs) [5-9]. However, these SRs have mostly been performed on studies of white women in the West [8,10].
Asian women, whose breast cancer incidence rate is lower than that of Western white women, have been reported to have dense breasts on mammography more frequently [11-14]. That is, Asian women have denser breasts on mammography, but lower breast cancer incidence than white women [15]. These facts make us doubt the proposal that breast density may be a risk factor in Asian women [16,17]. In particular, the incidence curves of breast cancer in accordance with age are significantly different in Asian women, including Koreans, than in Western women [18-20]. Thus, we can infer that the risk factor of breast density works differently in Asian women than in Western women [17].
Some studies have reported that breast density on mammography was a risk factor for breast cancer in Asian women [21-23]. However, the risks varied depending on the density measurement index, statistical significance varied for each density interval, and a dose-response relationship has not been shown. As of the end of December 2015, no SR was found that evaluated the association between breast density on mammography and breast cancer risk in Asian women. Thus, the aim of this study was to conduct such an SR.
METHODS
Search and Selection of Related Articles
The final selection criteria for the meta-analysis included analytical epidemiology studies that evaluated the association between breast density levels determined using mammography and breast cancer risk in Asian women. Article selection was conducted in accordance with the preferred reporting items proposed for SRs and meta-analyses, including three stages: searching, screening using titles and abstracts, and evaluating articles [24].
The databases searched in the first stage were PubMed (http://www.ncbi.nlm.nih.gov/pubmed) and Scopus (www.scopus.com) [25], and the following search formula was applied: [(breast) OR (mammary)] AND [(cancer) OR (neoplasm)] AND [(density) OR (index)] AND [(Asia) OR (women)]. The final date of publication was set at December 31, 2015. Furthermore, a list was made while performing a hand search to investigate whether an SR had already been published evaluating the same hypothesis. The lists from the three search sources were combined to remove duplicates.
For the 2-stage screening process, the following exclusion criteria were applied based on the titles and abstracts to the summarized list: (1) studies not related to breast cancer, (2) laboratory studies, (3) expert or systematic reviews, and (4) descriptive epidemiological studies including cross-sectional prevalence studies. After the 2-stage screening process and exclusion, the third-stage evaluation was conducted for the remaining articles. For this purpose, the content was evaluated using the full text of each article, and articles that fell into the following categories were excluded sequentially: (5) analytical epidemiology studies that did not provide the information necessary for a meta-analysis, and (6) duplicate studies. Judgment of duplicates was made when the study subjects were selected from the same institution during the same recruiting period. Among duplicates, the article with the largest sample size was selected. The remaining analytical epidemiology studies were ultimately selected for the meta-analysis.
Statistical Analysis
The following information was extracted from each article: the nationality of the subjects, the recruiting institution, data sources for cohort construction, menopausal status, number of cancer cases and controls, type of breast density measurement index, and adjusted odds ratios (aORs) or relative risks and their 95% confidence intervals (CIs) for potential confounders at each density level. The measurement indices included the Wolfe classification (Wolfe), percent density (PD, %), volumetric density grade (%), density area (cm2), total breast area (TBA, cm2), absolute dense area (cm2), and mean dense area (MDA, cm2). An article showing aORs divided according to menopausal status and several measurement indices was considered to provide independent datasets for each stratum.
The effect size (ES) of each dataset to be used in the meta-analysis was calculated using the interval collapsing method (ICM) rather than highest vs. lowest intake method (HLM), because the ICM increases the statistical precision more than the HLM [26]. ICM application adopts the ES and its 95% CI calculated by performing a meta-analysis with a random effect model (REM) on the aOR and its 95% CI presented for each density level within a dataset as the ES for each dataset. After dividing the data into subgroups according to menopausal status and measurement indices, a REM meta-analysis was performed again using the ES for each dataset to calculate a summary effect size (sES) and its 95% CI. Meta-analysis was performed only in cases in which two or more datasets were found in the subgroup analyses. In the meta-analysis, heterogeneity was assessed by I-squared values (%).
Furthermore, to investigate the dose-response relationship in breast cancer risk in accordance with the density level presented in breast density indices, a random effects dose-response meta-regression (DRMR) was conducted [27]. The median values within the interval were used for dosage determination, and the lower limit was set at zero when the lowest interval was open. When the highest interval was open, the median interval of the adjacent interval was used. If the density index was PD, the dosage unit was determined to be 25%. The statistical significance level was set at 5%, and Stata version 14.0 (StataCorp, College Station, TX, USA) was used.
RESULTS
Figure 1 shows a flow diagram illustrating a series of processes from the searching, screening, and evaluation stages to the final selection of articles to include in the analysis. From the two databases, PubMed and Scopus, a list of 1563 articles was obtained by applying the search formula. Eight articles acquired from the hand-searching process were added to the list, and then 197 duplicates were removed, leaving a list of 1374 articles. From this list, 1321 articles were eliminated based on abstracts and titles. The texts of the 53 remaining articles were obtained and the content was evaluated to remove 47 articles, leaving the final six articles for meta-analysis [20-22,28-30].

The flow chart of article selection for systematic review.
The exclusion criteria during the selection process were the following: (1) 766 studies were not related to breast cancer; (2) 48 articles were laboratory studies; (3) 97 studies were expert or SRs; (4) 410 articles were descriptive epidemiological studies, including cross-sectional prevalence studies; (5) 40 analytical epidemiology studies did not provide sufficient information for a meta-analysis; and (6) seven articles were duplicate studies. The study subjects of Nagata et al. [21] were patients at Gifu City Hospital, and four duplicates were removed [31-34]. The study subjects of Lee et al. [30] were participants of the Singapore Breast Cancer Screening Programme (SBCSP), and two duplicates were removed [23,35]. The study subjects of Kim et al. [20] were patients at the Samsung Medical Cancer in Korea, and one duplicate was removed [36].
Table 1 shows a summary of the final six articles with 17 datasets based on type of breast density index and menopausal status. Categorized by country, the six articles included three Japanese studies, two Korean studies, and one Singaporean study. One was a cohort study and five were case-control studies. Seven datasets were of premenopausal women and eight were of postmenopausal women. In terms of the breast density index, five used PD, four used TBA, and two or fewer datasets used the remaining indices.

Since the findings varied in accordance with the index type and menopausal status, subgroup analysis was performed rather than calculating the sES values of the 17 datasets in order to control for potential heterogeneity. In other words, the datasets were divided according to menopausal status, and meta-analysis was performed only in cases with two or more datasets for each density index (Table 2, Figure 2). In premenopausal women, the PD index was significantly associated with elevated breast cancer risk (sES, 3.23; 95% CI, 2.23 to 4.66; I2=0.0%), whereas the TBA index did not show a statistically significant association. In the group of postmenopausal women, the TBA index did not show a statistically significant association, whereas the PD index was associated with a significant increase in breast cancer risk (sES, 1.62; 95% CI, 1.13 to 2.32; I2=0.0%). For premenopausal and postmenopausal women, meta-analysis was performed if two or more datasets were present for each density index, and the results showed significantly elevated breast cancer risks for the PD, density area, and volumetric density indices.
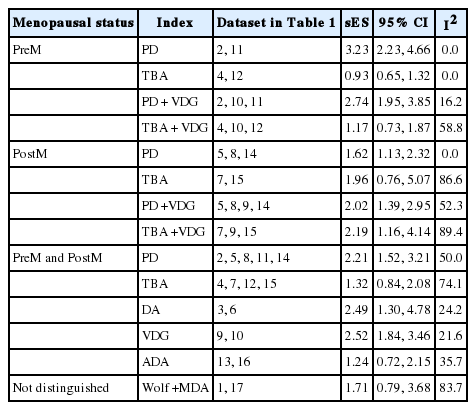
Summary effect sizes (sES) of subgroup analyses according to menopausal status and indices of breast density
The forest plot by menopausal status and kinds of density index. ES, effect size; PreM, premenopausal; PostM, postmenopausal; PD, percent density (%); TBA, total breast area (cm2).
Among the six articles selected, three provided the information necessary for DRMR analysis [21,22,29]. Three datasets (2, 5, and 8 in Table 1) were obtained using the PD index, and homogeneity was detected between two datasets (5 and 8 in Table 1) of postmenopausal women (p=0.35), showing a risk increase of 1.73 times for each 25% increase in PD in postmenopausal women (95% CI, 1.20 to 2.47).
DISCUSSION
In this study, the first SR of breast density and breast cancer risk in Asian women, breast cancer risk was found to increase as the PD value increased. Although the TBA index did not show statistical significance, the risk increased by 73% for each 25% increase in PD in postmenopausal women, which indicates that higher breast cancer risk is associated with higher PD values in women in Asian countries.
However, the risk calculated for PD in premenopausal and postmenopausal women was estimated to be 2.21 times that of baseline (95% CI, 1.52 to 3.21), which is lower than the risk elevation of four to six times that has been confirmed in Western women (two to four). Four factors may account for this discrepancy. First, breast density itself is not a risk factor, but a phenomenon determined by other risk factors [37-40]. Density can be affected by obesity, family history, genotype as well as obstetrical history [10]. Second, in Asian women, the positive predictive value in breast cancer diagnosis decreases with decreased sensitivity in mammography of denser breasts, resulting in underestimation of cancer occurrence [41,42]. Third, risk levels were found to change in accordance with the type of density measurement index [43-45], suggesting that different measurement indices have been used by different researchers [2,9], and that different indices may be appropriate depending on race [16]. Fourth, this study analyzed limited data, meaning that the conclusions may be tentative. Further studies evaluating breast density, as measured using several indices, and the risk of breast cancer in Asian women are needed.
The limitations of the meta-analysis conducted in this study include the following. First, an overall ES reflecting information from all 6 articles was not calculated, not only because the number of articles related to Asian women was small, but also because the breast density index varied across articles. However, the study performed by Wong et al. [23], which was excluded because its participants overlapped with the SBCSP participants, presented breast cancer risks adjusted for menopausal status and the PD index. When this was added to the five data-sets using PD in the meta-analysis, as shown in Table 2, the sES increased from 2.12 to 2.30 (95% CI, 1.67 to 3.16; I2=40.5%, not shown in Table 2). This fact underscores the necessity of further studies. Second, the subgroup analysis was performed imperfectly. When two groups (premenopausal and postmenopausal women) were differentiated in a single article, it was possible that the sES values were determined by calculations within the subgroup analysis. However, the studies of Nagao et al. [28] and Lee et al. [30] could not be used in the subgroup analysis because the results were not divided according to menopausal status. Furthermore, in cases where various indices were used for the same subjects, these results could not be incorporated without omission, resulting in a selective analysis within subgroups as well. Third, the analysis of premenopausal women was insufficient for DRMR. Applying DRMR to the density indices was possible because three datasets were established from the total of two articles on Japanese women, while only one was possible for premenopausal women. The aforementioned three limitations could be overcome by creating a single database for a pooled analysis of the selected articles.
The limitations regarding breast density in mammography include the following. First, the subjects included only women who were born and lived in Asia. In other words, women who were born in Asia but emigrated overseas were excluded. This decision was based on studies reporting that immigration as an environmental change affects breast cancer risk [45]. In the future, studies will be needed to investigate how breast density affects cancer risk among people of the same race depending on emigration [46]. Second, in the five case-control studies, the most recent mammography results before breast cancer diagnosis were used as breast density values. This design does not reflect the fact that breast density changes with age in individual women [46-48]. In the future, cohort studies that investigate breast cancer risk according to individual changes in breast density will be needed.
CONCLUSION
In conclusion, regardless of menopausal status, breast cancer risk in Asian women increased with breast density measured using PD. In particular, postmenopausal women with a high PD index had an elevated risk of breast cancer. As this SR suggests that the PD index represents breast cancer risks well in Asian women, we propose the further development of a breast-cancer risk prediction model involving PD for Asian women. To investigate the risks more precisely, a pooled analysis is proposed, along with the application of PD in breast cancer prediction models in Asian women.
Notes
CONFLICT OF INTEREST
The authors have no conflicts of interest associated with the material presented in this paper.