Blood Triglycerides Levels and Dietary Carbohydrate Indices in Healthy Koreans
Article information
Abstract
Objectives:
Previous studies have obtained conflicting findings regarding possible associations between indices measuring carbohydrate intake and dyslipidemia, which is an established risk factor of coronary heart disease. In the present study, we examined cross-sectional associations between carbohydrate indices, including the dietary glycemic index (GI), glycemic load (GL), total amount of carbohydrates, and the percentage of energy from carbohydrates, and a range of blood lipid parameters.
Methods:
This study included 1530 participants (554 men and 976 women) from 246 families within the Healthy Twin Study. We analyzed the associations using a generalized linear mixed model to control for familial relationships.
Results:
Levels of the Apo B were inversely associated with dietary GI, GL, and the amount of carbohydrate intake for men, but these relationships were not significant when fat-adjusted values of the carbohydrate indices were used. Triglyceride levels were positively associated with dietary GI and GL in women, and this pattern was more notable in overweight participants (body mass index [BMI] ≥25 kg/m2). However, total, low-density lipoprotein and high-density lipoprotein cholesterol levels were not significantly related with carbohydrate intake overall.
Conclusions:
Of the blood lipid parameters we investigated, only triglyceride levels were positively related with dietary carbohydrate indices among women participants in the Healthy Twin Study, with an interactive role observed for BMI. However, these associations were not observed in men, suggesting that the association between blood lipid levels and carbohydrate intake depends on the type of lipid, specific carbohydrate indices, gender, and BMI.
INTRODUCTION
The glycemic index (GI) is a relative ranking of the post-prandial blood glucose level for each carbohydrate-containing food when compared to 50 g of glucose or a reference food, such as white bread, and the glycemic load (GL) of a food is a measure of the quantity (g) of a carbohydrate in addition to its quality (GI). Previous studies have shown that a high dietary GL, rather than GI, was significantly associated with an increased risk of coronary heart disease (CHD) [1-4]. However, conflicting results have been reported regarding the relationships of dietary GI and GL with blood lipid profiles, which are established risk factors for CHD. It has been reported that higher dietary GI and GL values were associated with higher blood triglyceride and lower high-density lipoprotein (HDL) cholesterol levels [5,6], but some recent systematic reviews have argued that the effect of a low GI or GL diet was limited to lowering total and low-density lipoprotein (LDL) cholesterol levels, with no effect on triglycerides and HDL cholesterol [7-9]. Moreover, only a small amount of data has been published on associations between GI, GL, and apolipoprotein levels, which are also targets of lipid-lowering treatments [10]. Overall, the dietary recommendations for low-GI and low-GL diets still lack sufficient evidence [11].
For East Asian populations, evidence regarding the effects of dietary GI and GL on blood lipids remains mixed and inconclusive, as in Western populations. A few studies have shown that a higher dietary GL was associated with unfavorable levels of LDL cholesterol, triglycerides, and HDL cholesterol [12,13], while others have argued that both dietary GI and GL were adversely linked with triglycerides and HDL cholesterol [14,15]. The results from these studies should be interpreted carefully, as dietary GI and GL tend to be negatively correlated with dietary fat intake [12-15]. Accordingly, these results suggest that the effect of carbohydrate indices on blood lipids is greatly influenced by fat intake, and controlling for fat intake in statistical models is therefore crucial. The substitution model between carbohydrate and fat intake expressed as the percentage of total energy intake is an alternative way of explaining associations between the intake of different nutrients, providing additional information about which dietary factors may improve blood lipid levels [16,17].
As dyslipidemia is one of the major risk factors of CHD, lifestyle changes affecting blood lipid levels, such as diet, are important for the prevention of CHD. The previous inconsistent results regarding associations of dietary GI and GL with blood lipid profiles may have been caused by uncontrolled differences in lifestyles, genetic factors, the effect of fat intake, or the study designs. The Healthy Twin Cohort used in the present study has incorporated data from adult same-sex twins and their families since 2005, ultimately including 1530 Korean healthy adults. We examined cross-sectional correlations of the dietary GI, GL, total amount of carbohydrate intake, and percentage of energy from carbohydrates with blood lipid levels in this cohort, under the assumption that the participants’ dietary habits were relatively stable and that the measured GI and GL values reflected their individual dietary patterns. We controlled for familial relationships in the statistical analysis by using a generalized linear mixed model (GLMM).
METHODS
Subjects
The participants were 3479 enrollees in the Healthy Twin Study, which is a cohort of healthy adult same-sex twins (≥30 years of age) and their immediate family members; the protocol of this study has been described in detail elsewhere [18]. Individuals with a self-reported history of dyslipidemia or lipid-lowering therapy (n=219), self-reported history of cardiovascular disease (n=61), stroke (n=52), diabetes (n=183), or hypertension (n=446) were excluded because their dietary behavior may have been affected by disease. Individuals with implausibly low (<500 kcal) or high (>5000 kcal) total daily energy intakes, with incomplete information in their sociodemographic questionnaires, or who did not provide a blood sample were additionally excluded. The present study ultimately included 1530 participants (554 men, 976 women) from 246 families. All study participants provided written informed consent, and the study procedures were approved by the institutional review boards of the participating institutions.
Clinical Characteristics and Biochemical Tests
The following characteristics were assessed using a self-administered questionnaire: smoking status (current, past or never-smoker), alcohol consumption (regular drinker or not), regular exercise (yes or no), menopausal status (yes or no), average monthly household income (low, <1.5 million Korean won [KRW]/mo; middle, 1.5–3.0 million KRW/mo; high, >3.0 million KRW/mo) and duration of formal education (<9 years, 9–11 years, >12 years). Body weight was measured to the nearest 0.1 kg using a digital scale (Tanita Co., Seoul, Korea), and height to the nearest 0.1 cm using a stadiometer (Samwha Co., Seoul, Korea). The body mass index (BMI) was calculated as the weight (kg) divided by the squared height (m2) and was used as a continuous variable for statistical analysis. After a 12-hour overnight fast, blood samples were collected and analyzed in a central laboratory authorized by the Korea Association of Quality Control for Clinical Laboratory Examinations. The biochemical tests included total cholesterol (enzymatic assay), HDL and LDL cholesterol (homogenous and enzymatic assays), triglycerides (enzymatic assay), Apo A1 and Apo B (enzymatic assays) on a Siemens ADVIA 1650 (Erlangen, Germany) and a Hitachi 7600-210/7180 biochemistry analyzer (Tokyo, Japan) using commercially available kits.
Dietary Assessment
Dietary intake was assessed using a semi-quantitative 103-item food frequency questionnaire, which was developed based on the Korea Health and Nutrition Examination Survey and has been validated [19]. All participants were asked about the average frequency and portion sizes of each food item during a year. Food intake and nutrient intake per day were calculated using the recipe and nutrient database provided by the Korean Nutrition Association (Can Pro 3.0 database).
The GI for each food item was determined using the International Tables of Glycemic Index (reference substance, glucose; GI for glucose=100) [20] and a list of the GIs of Korean foods [21]. The GL of each food was calculated by multiplying the carbohydrate content in each serving by the GI of that food, thereby reflecting both the quantity and the quality of carbohydrate content in a food. In order to calculate the dietary GL, all the GL values for each food consumed over the course of one day were added together. The overall dietary GI was obtained by dividing the dietary GL by the total amount of carbohydrate intake per day. Nutrient intake levels, including carbohydrate intake, dietary GI, dietary GL, protein intake, fat intake, cholesterol intake, and fiber intake were transformed to total energy-adjusted values, according to the residual method [22]. In addition, carbohydrate intake, dietary GI, and dietary GL were transformed to both total energy and fat intake-adjusted values using the same method.
Statistical Analysis
Continuous variables (age, BMI, lipid profiles, and nutrient intake values) are expressed as the means ± standard error, and categorical variables (education, income, menopausal status, regular exercise, smoking, and alcohol) as frequencies or percentages. The variables were compared using analysis of variance or linear regression for continuous variables and the chi-square test for categorical variables. The relationships between dietary carbohydrates (dietary GI, dietary GL, the amount of carbohydrates [g], and the percentage of total energy obtained from carbohydrates) and blood lipids were analyzed using a GLMM to control the influence of familial relationships on the distribution of each lipid parameter. Additionally, we used total energy- and fat intake-adjusted values of dietary GI, dietary GL, and the amount of carbohydrates (g) in the GLMM instead of directly adjusting for fat intake in GLMM, due to the strong correlations of dietary GL and the amount of carbohydrate intake with fat intake. We used covariates as fixed effects in multivariate analyses, including age, BMI, education, alcohol, smoking, menopausal status, total energy intake, cholesterol intake, and fiber intake. Model 1 was adjusted for age, model 2 for confounders obtained from the univariate analyses, and model 3 for the confounders of model 2 and additional potential confounders. We used a substitution model by including total energy intake, the percentage of energy obtained from carbohydrates and proteins, and other covariates in the GLMM [16,17]. By excluding the percentage of energy obtained from fat, the model presented the difference in GI and GL associated with the percentage of energy obtained from carbohydrates at the expense of the percentage of energy obtained from fat, while keeping the total energy intake and the percentage of energy obtained from protein constant. Finally, we stratified our analyses of the effects of dietary carbohydrates according to BMI (≥25 kg/m2 vs. <25 kg/m2) to assess the interactive role of BMI. All analyses were conducted using SAS version 9.2 (SAS Institute Inc., Cary, NC, USA) and p-values <0.05 were considered to indicate statistical significance.
RESULTS
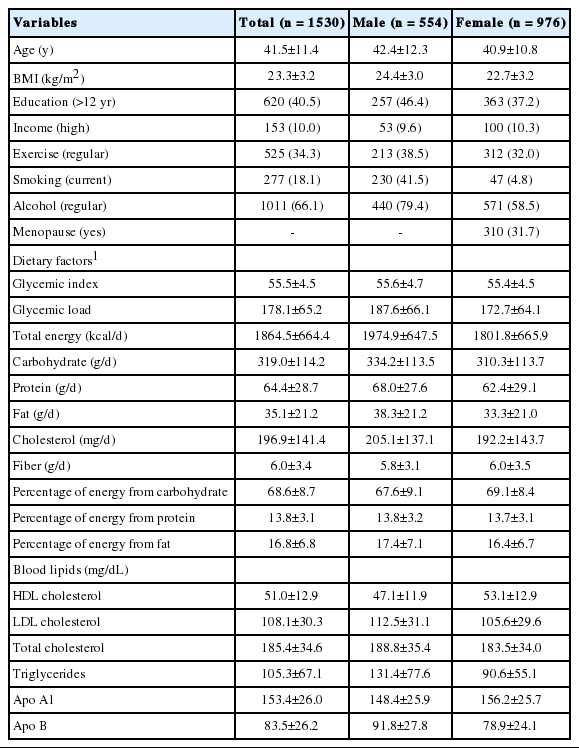
Summarized descriptive data classified by gender are presented in Table 1. The men showed a higher dietary GL and amount of carbohydrate intake, but the percentage of energy from carbohydrates was not higher than was observed for women. The dietary GI was not significantly different between men and women (55.6±4.7 vs. 55.4±4.5). All blood lipid profiles of men, except for HDL cholesterol and Apo A1, were higher than those of women.
Variables Associated With Dietary Glycemic Index and Glycemic Load
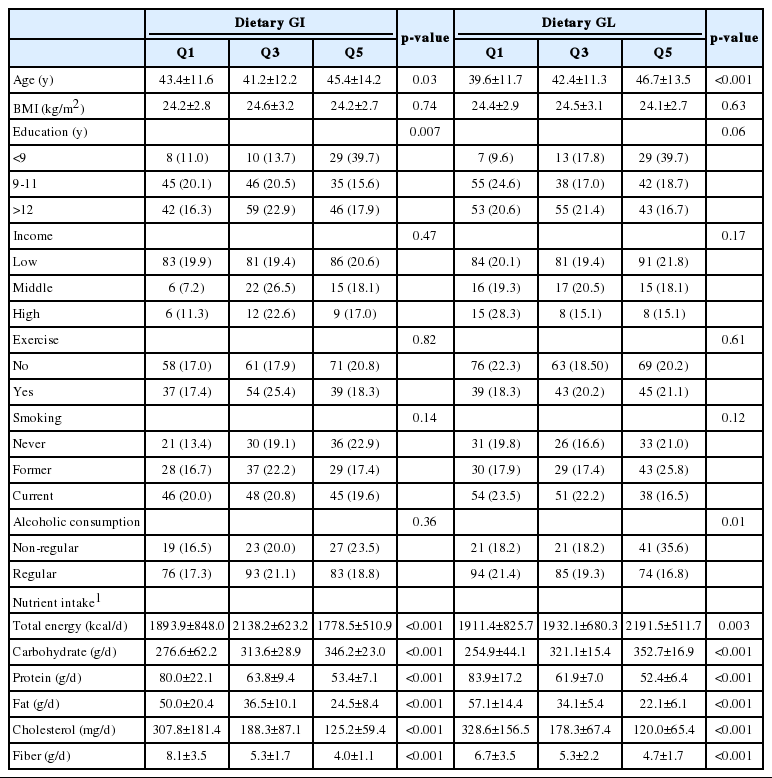
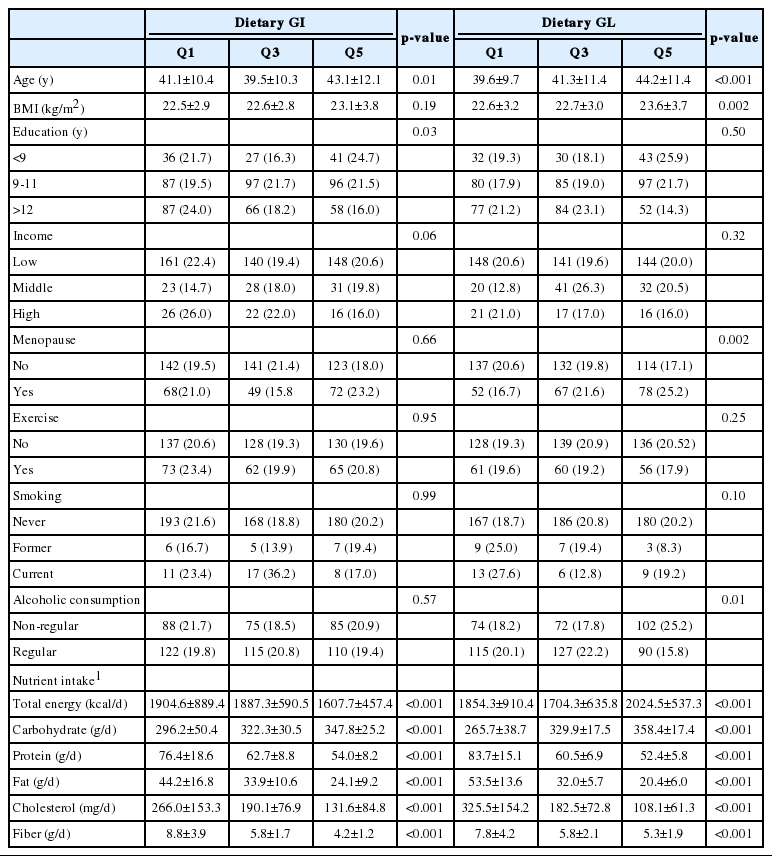
The relationships of demographic variables with dietary GI and GL in quintiles are shown in Tables 2 and 3. Older participants showed a higher dietary GI and GL, both for men (p=0.03) and for women (p<0.001). BMI was not associated with either dietary GI or GL for either gender, with the exception of dietary GL for women (p<0.001). Years of education showed a consistent inverse relationship with dietary GI and GL (p=0.08 and p=0.006 for men, p=0.04 and p=0.01 for women, respectively). Among men, current smokers and regular alcohol drinkers tended to show a lower dietary GL than former or never-smokers (p=0.04) and non-regular drinkers (p=0.01). Menopausal women had a higher GL than premenopausal women (p<0.01), and women who regularly drank alcohol had a lower GL than non-regular drinkers (p<0.001). Total energy intake was inversely associated with dietary GI (p<0.001 for men, p<0.01 for women) but positively associated with dietary GL (p<0.01 for men, p<0.001 for women). The intake of protein, fat, fiber, and cholesterol decreased as the dietary GI and GL increased (p<0.001 for all nutrients) for both genders. Fat intake was negatively correlated with the amount of carbohydrate intake (r=−0.97 for men, r=−0.96 for women), as well as dietary GL (r=−0.92 for men, r=−0.90 for women) and GI (r=−0.62 for men, r=−0.51 for women). After adjusting the carbohydrate indices for fat, the negative correlations with fat intake were attenuated to r=−0.24 (men) and r=−0.28 (women) for absolute carbohydrate intake, r=−0.21 (men) and r=−0.23 (women) for dietary GL, and r=−0.11 (men) and r=−0.09 (women) for GI.
Relationship Between Indices of Dietary Carbohydrates and Blood Lipids
In GLMM assessing the relationship between carbohydrate indices and blood lipids for men (Table 4), Apo B was negatively associated with dietary GI (p=0.025, model 1), dietary GL (p=0.008 in model 1, p=0.02 in model 2) and the absolute amount of carbohydrate intake (p=0.02 in model 1, p=0.03 in model 2). However, these associations disappeared when the fat intake-adjusted values for dietary GI, GL and the amount of carbohydrate intake (g/d) were used in the models. Moreover, total cholesterol and LDL cholesterol were related to the dietary GL and the amount of carbohydrate intake (g/d), but these associations were only found in model 1. The replacement of fat intake with carbohydrates, as expressed as percentage of energy, was not significantly associated with blood lipid parameters in men. Most lipid levels tended to decrease as carbohydrates were substituted for fats in a participant’s total dietary intake, but triglyceride levels increased; however, these associations did not reach statistical significance.
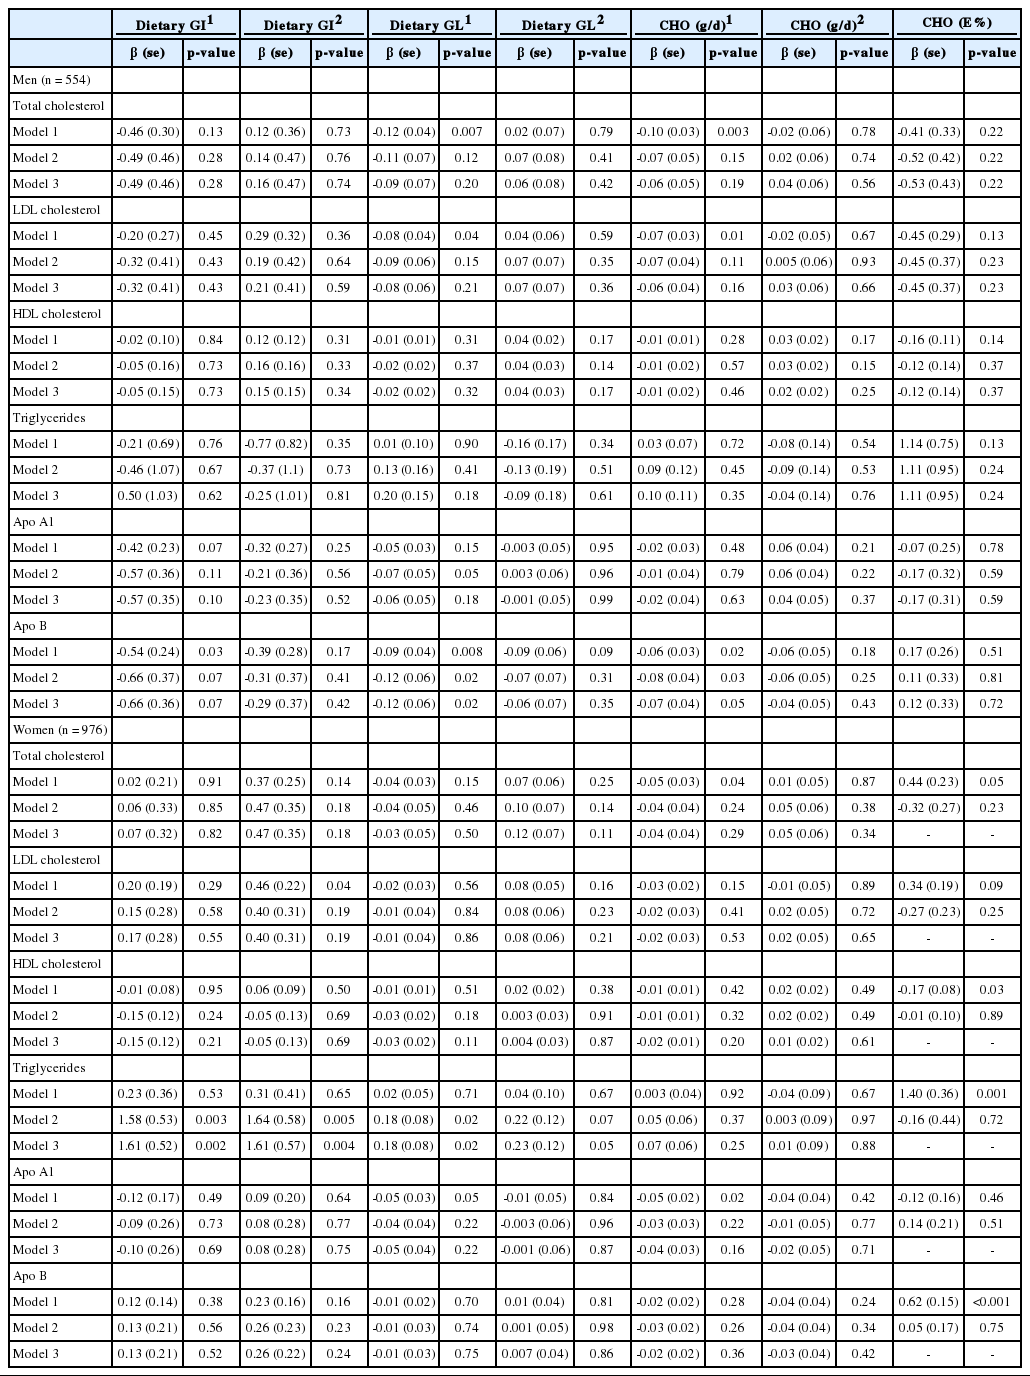
Relationship between dietary carbohydrate factors and blood lipids analyzed by generalized linear mixed model in men and women
In women, triglyceride levels were positively associated with dietary GI (p=0.003 in model 2, p=0.002 in model 3) and fat intake-adjusted values of dietary GI (p=0.005 in model 2, p=0.004 in model 3) (Table 4). The dietary GL was also positively associated with triglyceride levels (p=0.04 in model 2, p=0.02 in model 3), and fat intake-adjusted values of the dietary GL showed a positive but weaker relationship with triglyceride levels (p=0.06 in model 2, p=0.05 in model 3). Total cholesterol, LDL cholesterol, and Apo A1 were associated with the amount of carbohydrate intake, dietary GI and GL, but these findings were limited to model 1. The replacement of fat intake with carbohydrates was positively associated with triglyceride (p<0.001) and Apo B (p<0.001) levels, and negatively related with HDL cholesterol (p=0.03) but only in model 1.
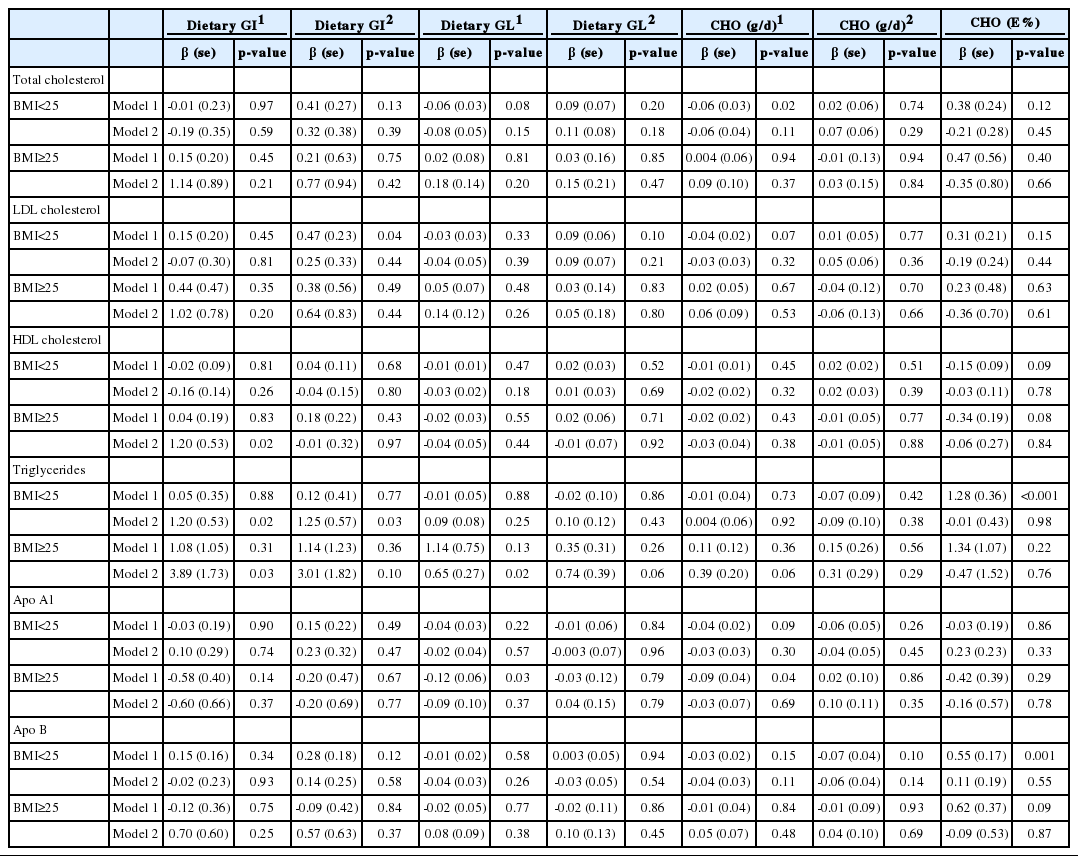
As some reports have found an interactive role of obesity on the relationship between dietary carbohydrates and blood lipids [5,15], the participants were stratified by BMI (BMI ≥25 kg/m2 and BMI <25 kg/m2) for subgroup analysis (Table 5). For women, triglycerides were significantly associated with dietary GI in both overweight participants (n=201, 20.6%; β=3.89; p=0.03) and non-overweight participants (n=775, 79.4%; β=1.20, p=0.02) in multivariate analyses, but the β-value of overweight participants was more than three times greater than that of non-overweight participants. Although this was not a statistically significant finding, the β-values for overweight participants were greater than those for non-overweight participants for dietary GL, the amount of carbohydrate intake, and the fat intake-adjusted values of both indices. In contrast, among men, triglyceride levels were not related with dietary GI and GL in overweight participants (38.4%, n=213; β=−0.03; p=0.98 for GI and β=0.16; p=0.57 for GL) and non-obese participants (61.6%, n=341; β=1.62; p=0.19 for GI and β=0.35; p=0.06 for GL). In contrast to the results from women, the β-values of overweight participants were even smaller than those of non-overweight participants for GI and GL, although the results were not statistically significant (data not shown).
DISCUSSION
The present study showed that triglyceride levels were positively associated with dietary carbohydrate intake in women, and that BMI may have played an interactive role in this association. In men, Apo B was inversely associated with dietary GI, GL, and the amount of carbohydrate intake, but these relationships were not evident when carbohydrate indices were adjusted for fat intake. Meanwhile, total cholesterol, LDL cholesterol, and HDL cholesterol levels were not significantly related with carbohydrate intake overall.
In light of the fact that fat intake markedly decreased as dietary GI and GL increased in the current study, it was notable that blood triglyceride levels were positively associated with dietary GI and GL in women even before fat-adjustment (Table 5). Although it was not statistically significant, greater carbohydrate intake was also linked with higher triglyceride levels in the substitution model. Regarding the link between fat intake and blood lipid levels, the Pearson’s correlation coefficients were positive overall for both men and women (r=0.009-0.14, data not shown in Results) but for triglycerides it was negative (r=−0.05 for men, r=−0.01 for women). This further supports the conclusion that greater carbohydrate intake was associated with higher triglyceride levels, as fat intake was negatively correlated with dietary GI and GL in our study. This association is in accordance with previous results [9,11,23]. Sacks et al. [24] recently reported that low-GI and low-carbohydrate diets did not favorably affect HDL cholesterol and LDL cholesterol levels, but did lower triglyceride levels considerably. A gender difference has been found in some studies of Asian populations, in which either the GI or GL was significantly linked with triglyceride levels for women but not for men [13,15,25]. It is likely that hormonal differences underlie these results [26]. However, in the present study, a significant relationship between triglycerides and GI/GL was found in postmenopausal women (n=310, 31.7%) but this relationship was rather weak in premenopausal women (data not shown).
In our study, triglyceride levels were especially elevated as GI or GL increased in overweight participants in contrast to non-overweight participants. The interactive role of BMI status on this association in the current study is in accordance with previous results [5,15]. Insulin resistance has been associated with high triglyceride levels [27,28] and it has been recognized that a high level of insulin resistance is present in the obese population [29], meaning that insulin resistance may play an important role in mediating the higher triglyceride levels observed in overweight individuals with a high GI or GL.
Apolipoproteins are important constituents of lipoproteins and a therapeutic target for the prevention of CHD. One molecule of Apo B binds to each lipoprotein, including LDL, and therefore it reflects lipoprotein density and is highly correlated with non-HDL cholesterol levels [30]. Only a few results have been published on the relationship between Apo B and carbohydrate intake, with one report showing that a Mediterranean-style low-GL diet lowered Apo B levels in comparison to the control group [10]. Our results demonstrating an inverse relationship between Apo B levels and carbohydrate intake may have been affected by the negative correlation between fat intake and carbohydrate intake, because the association was not apparent when we used fat-adjusted values for GI, GL, and the amount of carbohydrate intake.
The present study has some weaknesses, particularly due to the presence of strong co-linearity between fat intake and indices of carbohydrate intake. For this reason, we attempted to adjust for fat intake in the process of transforming GI, GL, and the amount of carbohydrate intake using the residual method. Doing so reversed the direction of the associations between carbohydrate indices and blood lipid parameters (Tables 4 and 5); however, a negative correlation between fat intake and indices of carbohydrate was still present. Other residual confounders may have been present in the mixed model that we used to control for familial relationships, and it was possible that the variables reflecting environmental and genetic factors were partially controlled for. Incorporating a larger population and using quantitative metrics to measure regular exercise, smoking and alcohol consumption would facilitate a more detailed analysis.
In summary, our results did not show clear associations between carbohydrate indices and levels of total cholesterol, LDL cholesterol, and HDL cholesterol. However, triglyceride levels were significantly associated with the dietary GI and GL for women, and these findings were replicated in models using fat-adjusted values. Dietary carbohydrate intake may differentially affect blood lipids depending on the type of lipid, gender, and BMI.
Notes
CONFLICT OF INTEREST
The authors have no conflicts of interest associated with the material presented in this paper.

