Correlations Between the Incidence of National Notifiable Infectious Diseases and Public Open Data, Including Meteorological Factors and Medical Facility Resources
Article information
Abstract
Objectives:
This study was performed to investigate the relationship between the incidence of national notifiable infectious diseases (NNIDs) and meteorological factors, air pollution levels, and hospital resources in Korea.
Methods:
We collected and stored 660 000 pieces of publicly available data associated with infectious diseases from public data portals and the Diseases Web Statistics System of Korea. We analyzed correlations between the monthly incidence of these diseases and monthly average temperatures and monthly average relative humidity, as well as vaccination rates, number of hospitals, and number of hospital beds by district in Seoul.
Results:
Of the 34 NNIDs, malaria showed the most significant correlation with temperature (r=0.949, p<0.01) and concentration of nitrogen dioxide (r=-0.884, p<0.01). We also found a strong correlation between the incidence of NNIDs and the number of hospital beds in 25 districts in Seoul (r=0.606, p<0.01). In particular, Geumcheon-gu was found to have the lowest incidence rate of NNIDs and the highest number of hospital beds per patient.
Conclusions:
In this study, we conducted a correlational analysis of public data from Korean government portals that can be used as parameters to forecast the spread of outbreaks.
INTRODUCTION
Outbreaks of infectious diseases are shaped by ecological and environmental factors, as well as social, economic, and demographic structures and their interactions [1]. According to the World Health Organization, the ongoing 2014 to 2015 Ebola outbreak in West Africa has claimed the death of 11 274 individuals among 27 724 cases in eight countries, as of July 24, 2015 [2]. The spread of Ebola in the current outbreak is affected by its pathogenic attributes and is expedited by the climate of West Africa and behavioral factors, such as the state of public hygiene in the region and the ever-increasing number of international travelers [3]. In the Republic of Korea (hereafter Korea) 75 741 patients were reported to have acute infectious diseases in 2013, representing an increase of 24 251 from the corresponding figure of 51 490 patients in 2012, according to the Infectious Diseases Surveillance Yearbook published by the Korea Centers for Disease Control and Prevention (KCDC). Of particular note, 252 cases of imported dengue fever were reported in 2013, which was a 69% increase from the figure of 149 cases in 2012 [4]. As stated above, the spread of infectious diseases is affected by a wide range of factors, meaning that it is necessary for studies to examine the epidemiological factors affecting the spread of each disease.
Domestic data must be collected in order to identify and analyze the factors associated with infectious diseases in Korea. Currently, a wide range of public data managed by government agencies are available for public use, supported by the Public Data Declassification Plan (March 2010) and the establishment of Government 3.0 in 2013. As of October 2014, the public has access to approximately 11 711 databases from approximately 706 Korean governmental agencies, including the Bureau of Statistics, the National Weather Service, and the KCDC. The public utilization of these data is rapidly increasing each year, with 110 000 instances of utilization in 2012, 160 000 instances of utilization in 2013, and 22 billion instances of utilization between January and October 2014 [5]. These data, made available by Government 3.0, can be used to predict trends in infectious diseases in Korea. For example, it has been reported that the occurrence of infectious diseases is affected by changes in weather patterns [6]. Most recently, it has been reported that various vectors are proliferating more rapidly as a result of rising temperatures, expediting the spread of infectious diseases [6]. Air pollutants, such as fine particle particulate matter (PM2.5) and carbon monoxide (CO), also contribute to an increased number of cases of communicable respiratory illnesses [7]. Using simulation tools (such as CommunityFlu, FluSurge, and FluAid, developed by the US Centers for Disease Control and Prevention), designed to predict the spread of infectious diseases, we set population density, immunization rate, number of hospitals, and number of hospital beds as parameters [8-10]. Public data from Korea were plugged into these parameters to develop more accurate predictions of trends in infectious diseases in Korea. We also performed a correlational analysis between the incidence rates of national notifiable infection diseases (NNIDs) and hospital resources among the districts of Seoul, in order to confirm the importance of preparedness in terms of hospital and vaccination rates.
This study had three primary goals: to conduct a survey of the availability of relevant public data (domestic and international); to perform a correlational analysis of the incidence of NNIDs according to parameters reflected in governmental datasets, including climactic and air pollution-related factors; and to perform a correlational analysis between the incidence of NNIDs and population density, immunization rate, number of hospitals, and number of hospital beds by district in Seoul. Seoul was selected for our study because it has the most public data. Public data were extracted from the Public Data Portal (www.data.go.kr), the Diseases Web Statistics System (http://is.cdc.go.kr/nstat/index.jsp), the Korean Statistical Information Service (http://kosis.kr), the Korea Meteorological Administration (http://sts.kma.go.kr), the Ministry of the Environment (http://stat.me.go.kr), and Seoul City Open Data Square (http://data.seoul.go.kr).
METHODS
Materials
For the survey of the availability of relevant public data worldwide, public data websites established in each country were identified. The categories of data, data formats, and the amount of data offered were then examined, and were in turn classified by country, continent, category, and format. In order to utilize the relevant subsets of these data in our correlational analysis, we obtained data on infectious disease outbreaks from the Diseases Web Statistics System implemented by the Ministry of Health and Welfare and the KCDC. The Diseases Web Statistics System contains statistical data pertaining to NNIDs collected from medical establishments across the nation. It offers various statistics by disease type, area, year, epidemiological characteristics, and samples. For each NNID, we extracted the number of patients by year and area from 2001 to 2013. For 2013, the year with the most recent data, we organized the number of patients newly diagnosed with each infectious disease by month, week, area, age, gender, and occupation. Parameters involving population, health, traffic, and weather were obtained as data on the average age and household size (as of December 2013) organized by lower level administrative districts (such as eub, myun, or dong), from the public data portal run by the Ministry of Government Administration and Home Affairs, the number of hospitals by type and location (2009 to 2013) from the Korean Statistical Information Service, the population by district and age group, the population density by administrative district from the 2010 Census, and influenza immunization trends by age group from the Korea National Health and Nutrition Examination Survey. Meteorological factors Korea evaluated by obtaining Examination data regarding the average temperatures (°C), high and low temperatures (°C), precipitation (mm), and relative humidity (%) from 10 major cities in 2013 from the National Weather Service’s Korean peninsula weather statistics. Monthly air pollution was assessed by obtaining data regarding PM2.5 levels (μg/m³), sulfur dioxide (SO2) gas levels (parts per million [ppm]), ozone (O3) levels (ppm), nitrogen dioxide (NO2) levels (ppm), and CO levels (ppm) by city and province in 2013 from the environmental statistics portal of the Ministry of the Environment. Population data and immunization rates by disease, as reported by public health care centers and private medical establishments nationwide, were obtained for the 25 administrative districts in Seoul from Seoul Open Data Square. Finally, the number of hospitals and hospital beds available in Seoul were obtained from medical center statistics.
Methods
In order to construct a local database using available public data, we collected 660 000 pieces of public data belonging to 26 categories, and converted them to the input file format of the MySQL database management system. JAVA and JSP were used to manipulate the collected data sets, including open API data. This database is publicly available at http://147.47.72.71:8080/opendata/information.html. Figure 1 provides a schematic view of the data collection and analysis procedure implemented in this study.

Schematic view of data collection, database construction, and data analysis.
Our study concerned cases of NNIDs reported in 2013. These diseases are classified into four legally reportable communicable disease groups (1-4). We performed a correlational analysis to identify factors associated with the total number of newly diagnosed patients reported each month from January to December 2013, excluding infectious diseases that affected fewer than five patients in 2013. The environmental variables used in our analysis were monthly weather data reported in 2013 and average monthly PM2.5, SO2, O3, NO2, and CO levels in 10 major cities in Korea. Supplemental Table 1 presents descriptive statistics regarding these variables. The monthly air pollution level is potentially affected by meteorological factors; therefore, the association between these two categories was also used in our data interpretation. Overall population data and immunization records from districts in Seoul for major infectious diseases, such as diphtheria, tetanus, typhus, tuberculosis, and influenza, were used for our analysis of epidemiological dynamics in Seoul. The total numbers of hospitals and hospital beds by district were used for the correlational analysis of population density, immunization rates, and medical resources available. In addition to climate and air quality, age, gender, occupation, and various other factors may also affect the incidence of infectious diseases. However, our study incorporated only the data currently available, thus excluding factors that were not available for analysis. Additionally, only factors relevant for districts of Seoul were incorporated into the correlational analysis of population density with the infectious disease incidence rate, the immunization rate, and the availability of medical resources. SPSS version 22.0 (IBM Corp., Armonk, NY, USA) was used for Pearson correlation analysis. A p-value <0.05 was considered to indicate statistical significance.
RESULTS
Status of Domestic and International Public Data
Many countries around the world are pursuing open government policies and declassifying public data, with the hope of facilitating economic growth. Major countries continue to expand the public availability of data through policies and web portals, including Canada, the US, the UK, Singapore, Australia, New Zealand, and Germany. Supplemental Table 2 shows the number of public databases available by data category, nation, and continent. Canada provides the most databases as of October 13, 2014 (209 250), followed by the US (157 586), the UK (19 628), Japan (12 347), Korea (11 433), and Singapore (8275). North America (the US and Canada) is the continent that accounts for the majority of available databases (85%), followed by Asia (Japan, Korea, and Singapore) and Europe (the UK, Germany, and Spain), which provides 7000 fewer datasets than Asia, with a total of 25 000. Economic data account for most of the public data currently available, followed by data relating to the environment, education, society, industry, demographics, health, culture, and energy. Data on animals, geology, and soil science were less frequently available. Public data are provided in the XML, JSON, HTML, KML, PDF, CSV, XLS, and DOC file formats. Of these, the XML and JSON formats are the most frequently available. Figure 2 shows the availability of open data, classified by country, categories, and data format, in fifteen countries.
Sources of open data classified by country, categories, and data format. (A) Open data sources classified by country, (B) percentages of various categories of open data, and (C) percentages of various formats of open data. Source from open data portal site in each country [cited 2014 Oct 13].
Correlations Between Communicable Diseases and Categories of Public Data
The correlation coefficients of the monthly numbers of patients of various NNIDs with average values of temperature, humidity, and air pollution parameters are shown in Table 1. The incidence rates of the following NNIDs showed a strong positive correlation, with a high confidence interval, between the average monthly temperature and the monthly number of patients: enterohemorrhagic Escherichia coli infections (r=0.696, p=0.012), malaria (r=0.949, p=0.000), secondary syphilis (r=0.630, p=0.028), dengue fever (r=0.690, p=0.013), Q fever (r=0.682, p=0.015), and severe fever with thrombocytopenia syndrome (r=0.797, p=0.002). Similar results were obtained when assessing these correlations in terms of average high and low temperatures. In particular, the number of malaria patients had the highest correlation with average monthly low temperatures (r=0.957, p=0.000) and average monthly high temperatures (r=0.934, p=0.000). The incidence rates of the following NNIDs showed a significant positive relationship with the average monthly rainfall: tetanus (r=0.720, p=0.008), rubella (r=0.634, p=0.027), malaria (r=0.636, p=0.026), and severe fever with thrombocytopenia syndrome (r=0.723, p=0.008). Positive correlations were also found between the average monthly relative humidity and the incidence of the following NNIDs: tetanus (r =0.670, p =0.017), rubella (r=0.637, p=0.026), malaria (r=0.767, p=0.004), secondary syphilis (r=0.663, p=0.019), dengue fever (r=0.726, p=0.008), Q fever (r=0.662, p=0.019), and severe fever with thrombocytopenia syndrome (r=0.777, p=0.003).
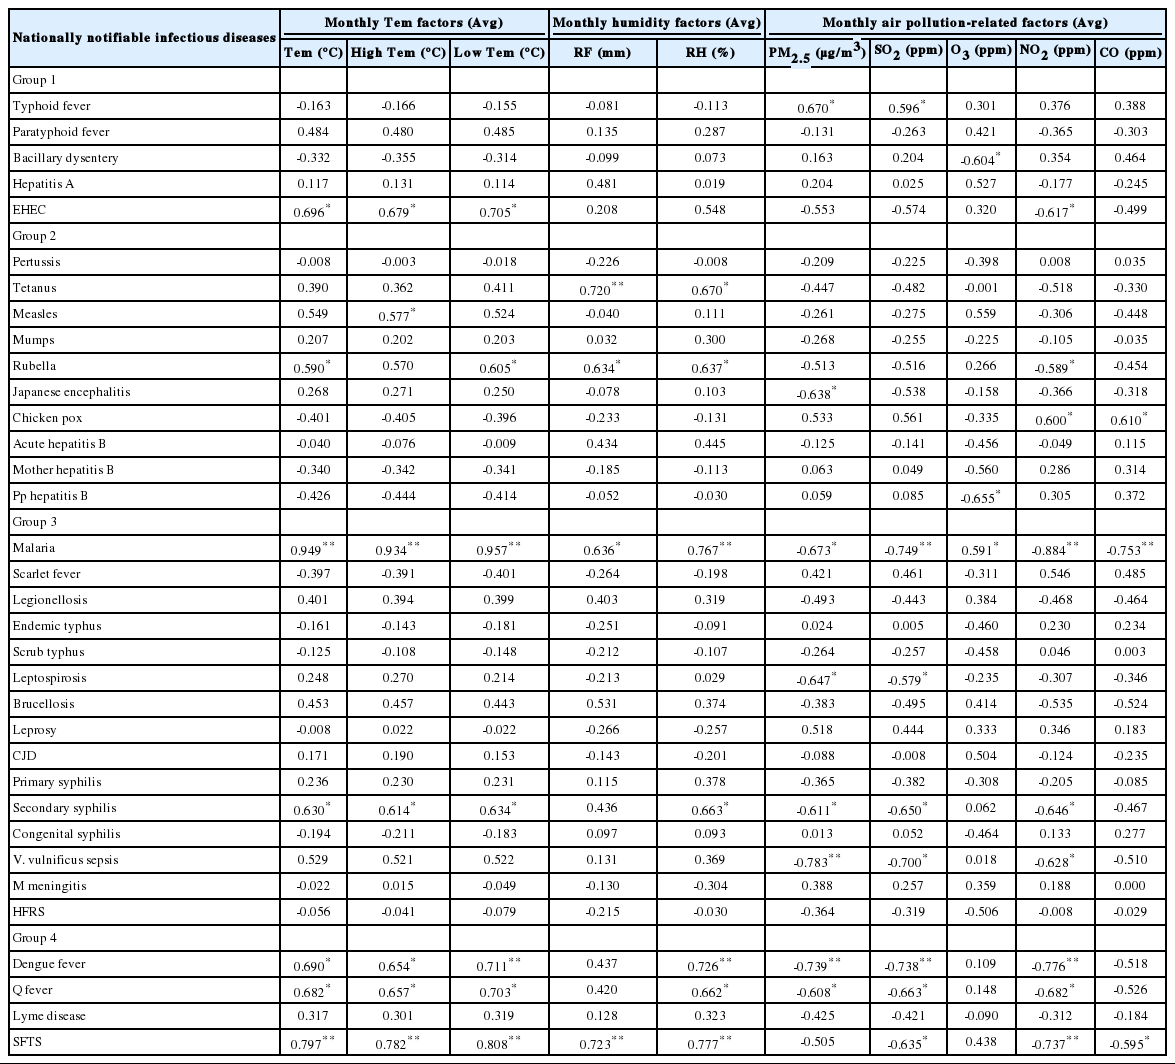
Correlational analysis between the monthly incidence of nationally notifiable infectious diseases and monthly average temperature, humidity, and air pollution-related factors in Korea during 2013
The incidence of several NNIDs was found to be related to the monthly average concentration of several air pollution parameters. Significant negative correlations were found between the incidence of the following NNIDs and the monthly average concentration of particulate matter: Japanese encephalitis (r=-0.638, p=0.026), malaria (r=-0.673, p=0.017), Vibrio vulnificus sepsis (r=-0.783, p=0.003), leptospirosis (r=-0.647, p=0.023), dengue fever (r=-0.738, p=0.006), and Q fever (r=-0.608, p=0.036). The incidence of malaria (r=-0.749, p=0.005), V. vulnificus sepsis (r=-0.700, p=0.011), secondary syphilis (r =-0.650, p =0.022), dengue fever (r=-0.739, p=0.006), Q fever (r=-0.663, p=0.019), and severe fever with thrombocytopenia syndrome (r=-0.635, p=0.027) showed a strong negative correlation coefficient with the monthly average concentration of SO2 gas. The monthly average concentration of O3 was positively correlated with the incidence of malaria (r=0.591, p=0.043) and negatively correlated with the incidence of bacillary dysentery (r=-0.604, p=0.037) and perinatal hepatitis B (r=-0.655, p=0.021). The incidence of the following NNIDs was significantly negatively correlated with the monthly average concentration of NO2: enterohemorrhagic E. coli infections (r=-0.617, p=0.033), chickenpox (r=-0.600, p=0.039), malaria (r=-0.884, p=0.000), V. vulnificus sepsis (r=-0.628, p=0.029), secondary syphilis (r=-0.646, p=0.023), dengue fever (r=-0.776, p=0.003), Q fever (r=-0.682, p=0.015), and severe fever with thrombocytopenia syndrome (r=-0.737, p=0.006).
Figure 3 illustrates the correlations between climate and air pollution factors with the monthly incidence of NNIDs (p<0.01). Among the meteorological variables, the monthly average temperature (line graph) showed the highest correlation coefficient (r=0.949) to the monthly number of malaria patients (Figure 3A). The monthly average concentration of NO2 (line graph), which showed a negative correlation with malaria (r=-0.884), had its lowest levels in July (0.022 ppm), corresponding to the highest number of patients (Figure 3B). The number of patients with dengue fever (bar graph) was elevated from July to September, as was the average relative humidity (Figure 3C). The highest concentration of PM2.5 was 63.88 μg/m³ in January, and this parameter was negatively correlated with malaria (Figure 3D).

Strong correlations between the monthly incidence of selected infectious diseases and monthly average values of climactic and air pollution-related factors. (A) The monthly number of cases of malaria and average temperature. (B) The monthly number of cases of malaria and average nitrogen dioxide (NO2) levels. (C) The monthly number of cases of dengue fever and average relative humidity levels. (D) The monthly number of cases of malaria and the average fine particulate matter (PM2.5) level. Data were extracted from the Public Data Portal (www.data.go.kr) and Seoul City Open Data Square (http://data.seoul.go.kr).
Table 2 shows Pearson’s correlation coefficients between the incidence rates of NNIDs and hospital resources in 25 districts of Seoul. A positive correlation was found between the incidence rates of NNIDs per 1000 person-years and the number of hospitals across 25 districts of Seoul (r=0.606, p=0.001). Moreover, the number of hospital beds in these districts showed a positive correlation (r=0.456, p=0.022) with hospital resources. In contrast, the incidence rate of NNIDs was negatively correlated with vaccination rates (r=-0.049). The number of hospital beds by patient in each district is shown in Supplemental Figure 1. Geumcheon-gu was found to have the highest number of hospital beds per capita (8.66) and a low incidence rate of NNIDs (23rd of the 25 districts). In contrast, Jongno-gu had a low number of hospital beds per capita (4.81) and the highest incidence rate of NNIDs (first of the 25 districts). Dongjak-gu had the lowest number of hospital beds per capita (2.47) and a high incidence rate of NNIDs (fourth of the 25 districts)
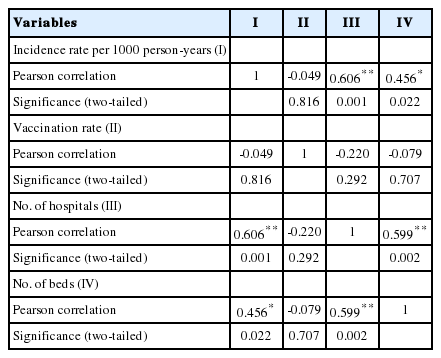
Pearson’s correlation coefficients between the incidence rate of nationally notifiable infectious diseases and hospital resources among the 25 districts of Seoul during 2013
DISCUSSION
This study examined the accessibility of public data, both domestic and foreign, and the correlation between the following factors that affect the number of patients with infectious diseases in Korea: climate, air pollution, population density, vaccination rates, and healthcare resources. In accordance with the implementation of Government 3.0 policies, more Korean government agencies, such as the Ministry of Education; the Ministry of Health and Welfare; the Ministry of Environment; the Ministry of Land, Infrastructure, and Transport; and the Ministry of Agriculture, Food, and Rural Affairs, are making an increasing amount of data publicly accessible. According to a comparison of the categories of data available from each country, the Korean government has the fifth largest amount of public data and is the second largest provider of public data in Asia after Japan. However, this only applies to the number of data categories, because public data portal sites only offer information about the categories of data, not the size of the datasets. Public data that can be leveraged for infectious disease predictions in Korea include patient statistics, population density, climactic and air conditions, and medical resources. Infectious diseases pose an ever-increasing risk, as the number of Ebola victims continues to rise without effective treatment; thus, epidemiological forecasting and the ability to estimate the spread rate are paramount in establishing public health policies. Parameters that form the basis of infectious disease forecasting simulation tools include, but are not limited to, local population by age, contact rate, attack rate, vaccination rate by age, local-level healthcare resources, and the number of school vacation days. Once accurate baseline data are entered into such tools, more precise and effective predictions of the spread of infectious diseases can be made. In addition, reverse forecasts can be made using patient numbers by entering coefficients that are related to the baseline parameters. For example, mosquitoes have a faster multiplication rate at higher temperatures, and the incidence rate of malaria is connected to changes in temperature. The incidence of malaria increases by 3.4% for every 1°C increase in the mean national temperature in Korea, which has four distinct seasons [11]. Similar studies have recently been published, such as one reporting a link between air pollution and increased mortality due to lung cancer and other cardiopulmonary diseases [12].
In the present study, the monthly patient statistics for NNIDs were examined to determine if the incidence of NNIDs was related to the following factors in Korea during 2013, based on the following available public data: mean temperature, mean high and low temperatures, precipitation, mean humidity, and the concentrations of PM2.5, SO2, O3, NO2, and CO. As has been reported previously, malaria showed a strong correlation with average temperature and humidity. Enterohemorrhagic E. coli, dengue fever, Q fever, and severe fever with thrombocytopenia syndrome had a higher incidence during the summer and a lower incidence during the winter, which is likewise due to changes in temperature and humidity. Therefore, it is reasonable to conclude that the aforementioned arthropod-borne diseases are also affected by climactic factors, since their carriers, such as mosquitoes and mites, have higher reproductive rates during the summer. This conclusion is in accordance with Hunter’s finding that vector-borne diseases, such as malaria and dengue fever, have a higher incidence rate when the breeding conditions of the vectors, such as mosquitoes and mites, are favorable [13]. Mumps, a viral disease, showed higher incidence rates than other infectious diseases in December, which is a period of greater pathogen replication due to low temperature and humidity and because human immune systems are weakened. Tetanus was found to be linked more closely with mean precipitation than temperature, and showed the highest incidence during July. The incidence of typhoid was linked with higher concentrations of PM2.5. The increased concentration of suspended solids in water after days with a high concentration of PM2.5 can lead to an increased incidence of typhoid [14]. However, these results must be subjected to additional analysis, because this study did not adjust for confounding in the temperature data. V. vulnificus sepsis and malaria showed the highest incidence in July and August; during these two months, PM2.5 concentrations were relatively low due to high amounts of precipitation, and the replication rates of those pathogens increased. The mean concentration of SO2 was higher in the winter than in the summer, and was negatively correlated with the incidence of malaria, V. vulnificus sepsis, and dengue fever. However, since the mean difference in SO2 concentrations was at most 0.004 ppm, this correlation was not very meaningful from an analytical perspective. The concentrations of NO2 and CO were highest between December and February due to increased fuel consumption, and were lower during the summer months, resulting in a negative correlation with the diseases that have the highest incidence during summer, such as malaria, dengue, and Q fever. With this in mind, the incidence rates of many NNIDs showed a relationship with air pollution factors because this study did not adjust for confounding factors (temperature, humidity, and season). However, the incidence of typhoid fever and bacillary dysentery showed a correlation with air pollution factors due to the effect of particulate matter on the contamination of water [14]. Therefore, we can predict that air pollution and the incidence rates of NNIDs are indirectly correlated with a number of external factors, such as climactic and environmental variables.
This study also examined the relationship between the incidence rates of NNIDs, vaccination rates, and the number of clinics and hospital beds across 25 districts in Seoul, Korea, and also aimed to identify whether levels of preparedness regarding hospital resources affected the incidence rates. A meaningful positive correlation was found between the incidence rates of NNIDs and the number of clinics and hospital beds. However, no correlation was observed between the incidence rates of NNIDs and vaccination rates or the number of clinics and hospital beds, suggesting that districts with higher incidence rates and more clinics and hospital beds do not necessarily have higher vaccination rates. This means that each district should prepare hospital resources appropriately during outbreaks of NNIDs. Geumcheon-gu was found to have the lowest incidence rate of NNIDs and the highest number of hospital beds per patient, and Jongno-gu had the highest incidence rate and a low number of hospital beds per patient. These findings facilitate the estimation of vaccine supply requirements and the availability of beds per capita during outbreaks of NNIDs.
A limitation of this study is that it collected public data from 2013 only. The dataset for assessing the relationships of the incidence rates of NNIDs with vaccination rates and healthcare resources was confined to Seoul, as Seoul had the largest amount of public health data available. Moreover, we did not adjust for confounding factors (temperature, season, disease lag time), so it is difficult to interpret causal relationships in the correlations between the monthly number of NNID patients and the parameters related to average temperature, humidity, and air pollution.
This study surveyed the availability of public data (domestic and international), performed a correlational analysis of the incidence of NNIDs with climactic and air pollution-related parameters, and performed a correlational analysis of the incidence of NNIDs and population density, immunization rates, the number of hospitals, and the number of hospital beds by district in Seoul. According to the survey of the availability of public data from various countries, the Korean government provides the fifth largest amount of public data and is the second largest provider of public data in Asia after Japan. It is therefore possible to obtain analytic results in public health using these open data, as well as to identify correlations between incidence rates and related factors, such as environmental and social data, using a long period of observation of infectious outbreaks with access to more public data from related governments. Our correlational analysis, based on public data, may facilitate forecasts of the effects of temperature and humidity on the incidence rates of NNIDs. Moreover, some districts in Seoul have more hospital resources that can be mobilized during outbreaks of infectious diseases. The identification of other factors that can be used as forecast parameters in similar studies will be of value in developing highly reliable and customized infectious disease spread simulation models for Korea.
ACKNOWLEDGEMENTS
This study was conducted by using the open-source public data from Korean governmental agencies, so we give special thanks to all the governmental institutions that made this possible.
Notes
Conflict of Interest
The authors have no conflicts of interest with the material presented in this paper.
Supplementary Material
The number of domestic and international public datasets
Descriptive statistics of climactic and air pollution-related variables