Agent Orange Exposure and Prevalence of Self-reported Diseases in Korean Vietnam Veterans
Article information
Abstract
Objectives
The aim of this study was to evaluate the association between Agent Orange exposure and self-reported diseases in Korean Vietnam veterans.
Methods
A postal survey of 114 562 Vietnam veterans was conducted. The perceived exposure to Agent Orange was assessed by a 6-item questionnaire. Two proximity-based Agent Orange exposure indices were constructed using division/brigade-level and battalion/company-level unit information. Adjusted odds ratios (ORs) for age and other confounders were calculated using a logistic regression model.
Results
The prevalence of all self-reported diseases showed monotonically increasing trends as the levels of perceived self-reported exposure increased. The ORs for colon cancer (OR, 1.13), leukemia (OR, 1.56), hypertension (OR, 1.03), peripheral vasculopathy (OR, 1.07), enterocolitis (OR, 1.07), peripheral neuropathy (OR, 1.07), multiple nerve palsy (OR, 1.14), multiple sclerosis (OR, 1.24), skin diseases (OR, 1.05), psychotic diseases (OR, 1.07) and lipidemia (OR, 1.05) were significantly elevated for the high exposure group in the division/brigade-level proximity-based exposure analysis, compared to the low exposure group. The ORs for cerebral infarction (OR, 1.08), chronic bronchitis (OR, 1.05), multiple nerve palsy (OR, 1.07), multiple sclerosis (OR, 1.16), skin diseases (OR, 1.05), and lipidemia (OR, 1.05) were significantly elevated for the high exposure group in the battalion/company-level analysis.
Conclusions
Korean Vietnam veterans with high exposure to Agent Orange experienced a higher prevalence of several self-reported chronic diseases compared to those with low exposure by proximity-based exposure assessment. The strong positive associations between perceived self-reported exposure and all self-reported diseases should be evaluated with discretion because the likelihood of reporting diseases was directly related to the perceived intensity of Agent Orange exposure.
INTRODUCTION
From the initial September 1964 deployment of the Mobile Army Surgical Hospital and taekwondo instructors, until its complete withdrawal in March 1973, the Korean military sent 3 combat units and 4 support units, including 320 000 military personnel. During the Vietnam War, several toxic herbicides (hereafter, "Agent Orange") were utilized for military purposes starting in 1961 [1]. It is presumed that Vietnam War veterans were exposed to Agent Orange. In the US research on the adverse effects of Agent Orange on the human body started during the Vietnam War in the 1970s. Since the mid-1990s, Korean researchers have been investigating Agent Orange-related health issues. However, the relationship between Agent Orange and veterans' health remains unclear.
Assessment of Agent Orange exposure is a critical tool with which to assess its adverse effects on human health. Because decades have passed since Korean military units withdrew from Vietnam, the belated investigation of this herbicide presents some challenges. Past research on Korean veterans used the index based on 4 Corps Tactical Zones designated by the US military [2,3]. As a result, some limitations are apparent, including the fact that, among Korean soldiers, support units such as the Republic of Korea Army Headquarters in Vietnam had higher Agent Orange exposure than combat units [3].
We developed a new index to estimate Agent Orange exposure. This index incorporates perceived exposure based on self-reported information and proximity-based exposure in terms of spraying sites and timing. Veterans' disease information was obtained from veterans' self-reports. The purpose of this study was to investigate the association of these newly developed indices with veterans' self-reported health status.
METHODS
Study Subjects
With the help of the Ministry of National Defense and Ministry of Government Administration and Home Affairs, the list of 187 897 Korean Vietnam war veterans was identified and then the current address and residence status were obtained as of June of 2004. After excluding 23 689 individuals who were deceased or had emigrated, or whose residential status was unknown, 164 208 living veterans were selected for the postal survey. The survey was sent out in July 2004. Finally, 114 562 subjects were recruited (response rate of 69.8%) after removing duplicates. The details about the survey can be obtained from another report [4].
Measures of Outcomes
The veterans were asked to indicate all current and physician-diagnosed diseases in the self-reported questionnaire. The diseases were classified into 7 groups of diseases including cancer, circulatory diseases, respiratory diseases, digestive diseases, neuromuscular diseases, endocrine diseases, and other diseases. The research investigated 17 cancers (including stomach cancer, liver cancer, and lung cancer), 13 circulatory diseases (including hypertension, myocardial infarction, and angina), 5 respiratory diseases (including chronic bronchitis and emphysema), 6 digestive diseases (including central nervous system disorders and peripheral neuropathy), 3 endocrine diseases (including diabetes and hypothyroidism), and 4 other diseases (including renal failure and skin disease).
Agent Orange Exposure Index
Perceived Agent Orange exposure index
A perceived exposure index was adopted from previous research on US veterans [5]. The veterans were asked six questions regarding how they might have been exposed to Agent Orange in Vietnam. The possible responses for each item were 'yes,''no,'and,'do not know.'
Those who responded to the six questions were classified into 1 of 4 groups with an associated perceived exposure index. A respondent who had sprayed Agent Orange (question 1) or handled spray equipment (question 2) was placed in the "high" category. A respondent who was present during the spraying (question 3) or had gotten Agent Orange on their skin or clothing (question 4) were assigned to the "moderate" category. A veteran who walked through the area (question 5) or had been exposed in any other way than those mentioned in questions 1 to 4 (question 6) was placed in the "low" group. A "don't know" or refusal to answer any question was treated as "no." Those responding "no" to all of the above 6 questions were treated as a "no" exposure group. The "no" category and "low" category were combined into a "low" category, while the "moderate" category and "high" category were grouped into a "high" category, thus resulting in 2 groups. In the 4-group exposure index, the no, low, moderate, and high categories contained 40 038 (34.9%), 15 093 (13.2%), 40 935 (35.7%), and 18 496 veterans (16.1%), respectively.
Proximity-based Agent Orange exposure index
This exposure model was based on the proximity of the military unit to the sprayed area. The exposure opportunity index model E4, developed by Stellman et al. [6], was applied. The E4 scores were calculated for geographic locations and the calendar date [6], and those results were combined with the location histories of the military units to calculate unit level E4 scores [7]. With help from the Institute for Military History Compilation, the researchers were able to identify each Korean military unit's (that is, for the battalion level and higher) post location, tactical area of responsibility, and operational area. For the brigade and higher level, the tactical area of responsibility was investigated. For the military operations at the battalion and higher level, the deployed unit (company level and higher), operational period, and operational area were investigated.
The coordinate was determined by the 6-digit coordinate level of the Military Grid Reference System. Each unit's post location was identified according to the point coordinates of each battalion. Polygons representing the unit's tactical area of responsibility and operational area were constructed. Then, each coordinate representing 1 km by 1 km within those polygons was obtained. The military units for which we could identify their tactical area of responsibility were the Capital Division, Ninth Division, the Marine Second Brigade, and the Construction Support Group.
The information about the veteran's unit was obtained from the Ministry of Defense's military records and veteran's self-reported survey. The ministry's records contained information for 3 combat units (including the Capital Division, Ninth Division, and the Marine Second Brigade) and 4 support units. The self-reported survey revealed information on the battalion level and company level (for artillery and some units). The present study obtained information for the division/brigade-level exposure index from the ministry's military data and the battalion/company-level exposure index from the self-reported survey.
The military coordinate information was sent to the Stellman team in the US and they calculated E4 scores based on the dates and coordinates. For the division/brigade-level exposure index, the average score of all of the coordinates of a tactical area of responsibility was used as the unit's E4 score for the combat units and Construction Support Group, and the average score of all of the coordinates of the major post locations was used as the E4 score for the support units without a tactical area of responsibility.
For the battalion/company-level exposure index, we used the E4 score of the operational area when each unit participated in the operation, but utilized the E4 score of each post location when the unit was not part of the operation. An individual E4 score was obtained from the unit in which the veteran served and period of deployment. In other words, veterans with the same military unit and period would have the same exposure score. After adding 1 to each E4 score, the common log-transformed E4 score (Le4) was used as the individual's Agent Orange exposure index.
The veterans were categorized into 2 groups (low and high exposure) and 4 groups (no, low, moderate, and high exposure). The details about the exposure index and group classification can be found elsewhere [4]. For a total of 96 126 veterans, a proximity-based Agent Orange exposure index was constructed. For the distribution in the division/brigade-level exposure index, the number of veterans in the no, low, moderate, and high exposure groups were 19 360 (20.1%), 27 091 (28.2%), 29 909 (31.1%), and 19 766 (20.6%) veterans, respectively. For the battalion/company level exposure index, the numbers were 25 102 (26.1%), 31 774 (33.1%), 20 684 (21.5%), and 18 566 veterans (19.3%), respectively.
Confounding Variables
Each veteran's age was calculated as of August 1, 2004 when the subjects received the survey instrument. Military rankings were based on military records. Smoking, drinking, exercise, body mass index (BMI), use of herbicides, education, and income were from the survey. The BMI was obtained from self-reported weight (kg) divided by the square of the height (m). The details about the survey can be obtained from another report [4].
Statistical Analysis
The chi-squared test and t-test were performed to compare individual characteristics and frequency of self-reported disease prevalence by Agent Orange exposure level in 2 groups. A logistic regression analysis, controlling confounding variables, was implemented to compare the disease prevalence by exposure levels and to obtain odds ratios (ORs) and 95% confidence intervals (CIs).
The controlled confounding variables were smoking (current smoker, past smoker, and never smoker), drinking (5 or more times per week, 2 to 4 times per week, and never drinker), physical activity (4 or more times per week, 1-2 per week, 1-2 per month, and no activity), BMI (less than 20.5, 20.5 to 22.9, 23 to 24.9, 25 to 26.9, and 27 or more), use of herbicide in Korea (yes and no), education (elementary school or less, middle and high school, and college and more), monthly income (less than 500 000 Korean won [KRW], 500 000-2 490 000 KRW, and 2 500 000 KRW and more, where 110 000 KRW is about 100 US dollars), and military rank (enlisted rank, non-commissioned officer, company officer, and field officer or general). The test for trend was done to demonstrate dose-response relationships between the exposure level (4 groups) and disease prevalence, using the exposure level as an ordinal variable. The p-value was calculated with two-sided tests and a statistical significance level of 0.05 was applied. All statistical analyses were performed using SAS version 9.2 (SAS Inc., Cary, NC, USA).
RESULTS
The veterans in the high exposure group were older than those in the low exposure group for all exposure indices. The average age in the low and high exposure groups was 58.8±3.7 and 59.0±3.4 years, respectively, in the perceived exposure analysis; 58.3±3.8 and 60.1±3.0 years, respectively, in the division/brigade-level exposure analysis; and 58.9±3.7 and 59.7±3.1 years, respectively, in the battalion/company-level exposure analysis. With respect to the perceived exposure analysis, the no exposure group consisted of 40 038 veterans (34.9% of all veterans and 72.6% of the low exposure group in 2 groups). Compared with the low exposure group, the high exposure group had fewer current smokers, more non-drinkers, less education, and lower income. The proximity exposure index analysis showed that the high-exposure group had fewer officers. Because this study included a large number of subjects, almost all of the variables/characteristics showed significant differences among the exposure groups, although the gaps were not substantial (Table 1).

Characteristics of Korean Vietnam veterans by Agent Orange exposure (2 groups)
A total of 10 807 (9.4%) of 114 562 veterans reported cancer in the perceived exposure analysis, while 9179 (9.5%) of 96 126 reported cancer in the proximity exposure analysis. The high exposure group had more patients with all diseases in the perceived exposure analysis, and had more patients with most of the diseases investigated in the proximity exposure analysis (Table 2).
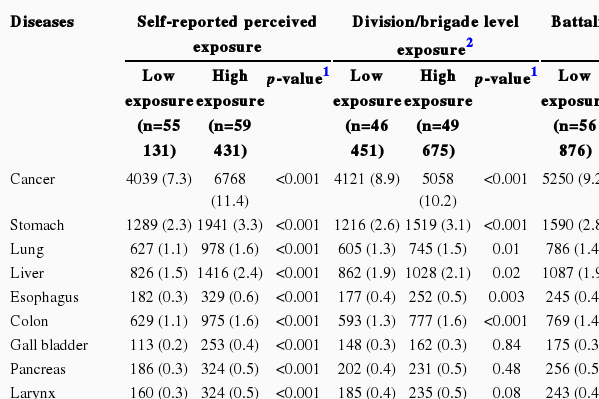
Prevalence of self-reported diseases by Agent Orange exposure (2 groups)
The two-group perceived exposure index analysis revealed that the high exposure group had a 1.55-fold (95% CI, 1.48 to 1.61) significantly higher OR of cancer prevalence. Compared with the no exposure group, the adjusted ORs of the low, moderate, and high exposure groups were 1.18-fold higher (95% CI, 1.10 to 1.26), 1.52-fold higher (95% CI, 1.44 to 1.59), and 1.87-fold higher (95% CI, 1.76 to 1.98), respectively. The trend analysis revealed that exposure increments (from low to high) led to higher ORs for cancer prevalence. The two-group analysis showed that the high exposure group had a higher OR of disease prevalence for all diseases, while the four-group analysis demonstrated that the moderate and high exposure groups had a higher risk of disease prevalence for all diseases. The test for trend showed that higher exposure led to higher ORs of the prevalences of all diseases (Table 3).
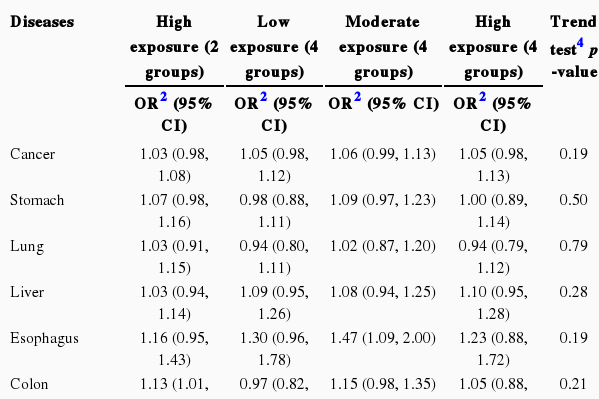
The two-group analysis of division/brigade-level exposure showed that the high exposure group had a slightly yet significantly higher risk of circulatory diseases combined and neuromuscular diseases combined. Specifically, the high-exposure group had slightly yet significantly higher ORs for colon cancer, leukemia, hypertension, peripheral vasculopathy, enterocolitis, peripheral neuropathy, multiple nerve palsy, multiple sclerosis, skin diseases, psychiatric diseases, and lipidemia. The four-group trend analysis showed that the high exposure group had significantly higher ORs for circulatory diseases combined and neuromuscular diseases combined, as well as for specific diseases-including peripheral vasculopathy, enterocolitis, chronic hepatitis, peripheral neuropathy, multiple nerve palsy, multiple sclerosis, skin diseases, psychiatric diseases, and lipidemia (Table 4).
The two-group analysis of battalion/company-level exposure revealed that the high exposure group had significantly higher ORs for circulatory diseases combined (including cerebral infarction), chronic bronchitis, multiple nerve palsy, multiple sclerosis, skin diseases, and lipidemia (Table 5). In the four-group analysis, circulatory diseases combined (including peripheral vasculopathy), digestive diseases combined, neuromuscular diseases combined (including multiple nerve palsy and multiple sclerosis), and other diseases (including skin diseases, psychiatric diseases, and lipidemia) in the low, moderate, and high exposure groups had slightly yet significantly higher ORs compared with the no exposure group; the test results for trend were also significant. The test for trend also revealed that all sites of cancer combined (including multiple myeloma), cerebral infarction, chronic bronchitis, and peripheral neuropathy had higher ORs as the exposure increased (Table 5).
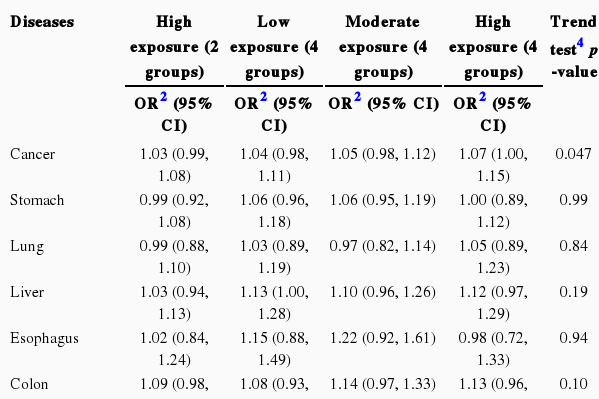
The diseases that had significance in the exposure indices at the division/brigade and battalion/company levels were circulatory diseases combined and multiple nerve palsy, multiple sclerosis, skin diseases, and lipidemia in the two-group analysis. The four-group trend test revealed a higher prevalence of disease as the exposure increased for circulatory diseases combined, digestive diseases combined, and neuromuscular diseases combined and peripheral vasculopathy, peripheral neuropathy, multiple nerve palsy, multiple sclerosis, skin diseases, psychiatric diseases, and lipidemia (Tables 4 and 5).
DISCUSSION
Circulatory disease combined in the disease group and multiple nerve palsy, multiple sclerosis, skin diseases, and lipidemia had a significant relationship with Agent Orange exposure at the division/brigade and battalion/company levels (with respect to the proximity exposure index) in the majority of the two-group analysis, four-group analysis, trend test. A literature review indicated that hypertension and ischemic heart diseases among circulatory diseases, diabetes among endocrine diseases, Parkinson's disease and early onset peripheral neuropathy among nervous system diseases, and chloracne and porphyria cutanea tarda among skin diseases were associated with Agent Orange exposure [1]. This study found that circulatory diseases were associated with Agent Orange; specifically, peripheral vasculopathy and hypertension in the division/brigade-level exposure analysis and cerebral infarction in the battalion/company-level exposure analysis had significant relationships with Agent Orange. In addition, in the two-group analysis of division/brigade-level exposure analysis, diabetes mellitus had a borderline-significant relationship with Agent Orange. Among nervous system diseases, multiple nerve palsy and multiple sclerosis were found to have relationships with Agent Orange exposure. Several reports have stated that 2,3,7,8-tetrachlorodibenzo-p-dioxin (TCDD) impacts lipid accumulation, lipid transfer, and lipid metabolism [8]. This study showed that lipidemia is associated with high exposure to Agent Orange.
This study also identified a relationship between the proximity-based exposure index and cancer, with some differences between division/brigade-level exposure and battalion/company-level exposure. The division/brigade-level exposure index did not show a significant dose-response relationship for any cancers on the trend test of the four-group analysis and only leukemia had marginally significant results. The two-group analysis of the division/brigade-level exposure index demonstrated that the high exposure group had a significantly higher risk of colon cancer and leukemia compared with the low exposure group. The four-group battalion/company-level exposure analysis showed that all sites of cancer and multiple myeloma had significant dose-response relationships. Multiple myeloma showed a borderline-significantly high risk in the high exposure group in the two-group analysis. These results were consistent with past research reporting that Agent Orange influences the incidence of chronic B-cell leukemia including chronic lymphocytic leukemia and multiple myeloma [1]. Colon cancer, which was found to have a relationship with Agent Orange in this study, however, did not show a relationship in previous research [1]. Diseases suspected to have a relationship with Agent Orange based on past studies, including lung cancer, laryngeal cancer, bronchial cancer, prostate cancer, Hodgkin's lymphoma, non-Hodgkin's lymphoma, and soft tissue sarcoma, were not shown to have relationships with Agent Orange in the present study.
This study showed that the perceived exposure index is highly related to the prevalence of self-reported diseases. Specifically, for all diseases, the perceived exposure index showed that high exposure was related to a higher risk of disease. The dose-response relationship in the four-group analysis clearly indicated that the incremental risk of disease moves from low to high exposure. However, whether perceived exposure is related to all diseases (including cancer, circulatory diseases, respiratory diseases, and digestive diseases) and has an apparent dose-response relationship should be interpreted with caution. These findings suggest that ill veterans tend to report that they believe they were more exposed to Agent Orange than they actually were [3,5]. Although 12.6% of veterans deployed after 1972 reported that they actually sprayed Agent Orange themselves or managed the device itself, US and Korean military records state that these claims are unfounded. There is a possibility that Vietnam veterans as well as Gulf War veterans may report exposures that are highly improbable considering their deployment dates [9]. Thus, we believe that researchers should be discreet in interpreting the self-reported exposure index because it is susceptible to information bias.
The proximity-based exposure index is not substantially influenced by the bias associated with ill veterans' self-reported exposure. The index itself is determined by veterans' military units and deployment durations. However, there has been some debate regarding the validity of Stellman's model, which is the basis of the proximity-based exposure index, as a tool to assess veterans' exposure to Agent Orange. For instance, Young [10] and Young et al. [11] dispute that the biological index, including the TCDD concentration, is the best method of measuring veterans' exposure. In addition, Ginevan et al. [12,13] claim that Stellman's model is not capable of measuring exposure precisely. Many work-related studies have categorized exposure levels by comparing specific job groups and the general population, then considering specific job groups as exposed groups. As research on veterans has confirmed, when comparing specific job groups and the general population, bias may exist, such as the 'healthy worker effect' [3]. Along similar lines, research on the exposure of veterans to Agent Orange has attempted to elucidate the exposure by focusing on veterans' participation in the war, which is carried out by performing comparisons between the veterans and the general population and between Vietnam veterans and non-Vietnam veterans. In comparing these approaches, we believe that the proximity-based exposure index is a stronger and more valid tool with which to assess the level of exposure to Agent Orange, although it does have some limitations [7]. We cannot rule out the fact that the proximity-based exposure index, adapted from Stellman's model, could expose itself to non-differential misclassification and thus may underestimate the relationships between exposure to Agent Orange and self-reported disease. The low OR between the index and disease in this study can be attributed in part to such misclassification.
Research on self-reported disease, which the current study adopted, is being performed widely. Previous reports have confirmed the validity of assessing the prevalence of self-reported chronic disease among middle-aged and senior recruits [14-17]. Likewise, Vietnam veteran research utilizes self-reported disease information [5,18-20]. However, compared with diagnoses by physicians, a number of limitations when using self-reported diseases require the reader's attention [21].
Spearman's correlation coefficient between the division/brigade-level and battalion/company-level indicators showed relevance at 0.72 (p<0.001), while some differences existed in the association between the two indices and the diseases. Because there is no gold standard for determining the actual Agent Orange exposure of Korean Vietnam veterans, this study cannot precisely compare the validity of the two proximity-based indices. At least from a theoretical standpoint, we believe that a battalion/company-level indicator that includes more detailed military unit information should be a better indicator than the division/brigade-level exposure index.
This study identified many significant diseases with ORs of 1.1 and lower in its analysis of 114 562 veterans. ORs of 1.1 and lower are not necessarily considered irrelevant results [22], but the small variation in prevalence may be a sign of uncontrolled elements/variables or residual confounding. Discretion should be exercised when interpreting data involving a small association with ORs of 1.1 and lower.
Compared with interviews, a postal survey usually has a lower response rate and high probability of missing data [23,24]. Nevertheless, it has merits in terms of involving fewer human resources and costs [23,25], and it may be the only tool with which to investigate Vietnam War veterans who are spread geographically throughout Korea, given the limited financial resources available [26]. Previous studies, in which a portion of subjects who underwent medical examinations were interviewed, have been challenged with respect to representativeness and investigation of rare diseases due to the small number of subjects (1000 to 2000) [2,3]. Thus, we implemented a large-scale mail survey to obtain a truly representative group of Korean Vietnam veterans. In this study, much effort was focused on minimizing non-response effects and overcoming the low response rate of many previous studies; thus we were able to reach a 70% response rate.
In conclusion, the proximity-based exposure indices showed that high exposure to Agent Orange was associated with a significantly higher prevalence of cancers (colon cancer, leukemia, and multiple myeloma), circulatory diseases (hypertension, cerebral infarction, and peripheral vasculopathy), neuromuscular diseases (peripheral neuropathy, multiple nerve palsy, and multiple sclerosis), skin diseases, and lipidemia. Meanwhile, there were some variations in the associated diseases between the division/brigade-level exposure index and the battalion/company-level exposure index, as well as significant but small differences in the OR increments in some analyses. The perceived exposure index indicated strong positive relationships between Agent Orange exposure and all diseases; this implies that veterans with diseases may perceive and report that they were highly exposed to Agent Orange.
ACKNOWLEDGEMENTS
This study was supported by a research grant of the Korean Ministry of Patriots and Veterans Affairs, 2003. The authors greatly thank Dr. JM Stellman and Dr. SD Stellman for their advice and permission to use their exposure data.
Notes
The authors have no conflicts of interest with the material presented in this paper.