Has Income-related Inequity in Health Care Utilization and Expenditures Been Improved? Evidence From the Korean National Health and Nutrition Examination Survey of 2005 and 2010
Article information
Abstract
Objectives
The purpose of this study is to examine and explain the extent of income-related inequity in health care utilization and expenditures to compare the extent in 2005 and 2010 in Korea.
Methods
We employed the concentration indices and the horizontal inequity index proposed by Wagstaff and van Doorslaer based on one- and two-part models. This study was conducted using data from the 2005 and 2010 Korean National Health and Nutrition Examination Survey. We examined health care utilization and expenditures for different types of health care providers, including health centers, physician clinics, hospitals, general hospitals, dental care, and licensed traditional medical practitioners.
Results
The results show the equitable distribution of overall health care utilization with pro-poor tendencies and modest pro-rich inequity in the amount of medical expenditures in 2010. For the decomposition analysis, non-need variables such as income, education, private insurance, and occupational status have contributed considerably to pro-rich inequality in health care over the period between 2005 and 2010.
Conclusions
We found that health care utilization in Korea in 2010 was fairly equitable, but the poor still have some barriers to accessing primary care and continuing to receive medical care.
INTRODUCTION
In Korea, given non-trivial out-of-pocket payments (35%) and steep competition among health care providers, there has been growing concern about access to health care, financial risk protection, and inefficient health care delivery [1,2]. To tackle these problems, the government has made an ongoing effort to lower out-of-pocket payments since the late 2000s. There has been a series of health policies, such as setting a limit on out-of-pocket payments favoring low-income groups as of January 2009 and the reduction of co-insurance rates from 10% to 5% for cancer patients as of December 2009 and for cardiovascular disease patients as of January in 2010 [3]. Consequently, these policies may have had a positive influence on access to health care, and research addressing the impact of the new policies is needed.
To investigate income-related inequity in the delivery of health care, we use the principle of "equal treatment for equal need, i.e., persons in equal need should be treated equally regardless of their income [4]." This principle can be measured by several methods such as the Le Grand index and the horizontal inequity index. Since Wagstaff and van Doorslaer [5] first proposed the Horizontal Inequity Index (HIWV index) using the indirect need standardization approach, a vast range of research has been performed using the HIWV index for exploring income-related inequity in health care [4-21]. This index can be investigated for statistical significance and be easily displayed graphically; it sensitively reflects distributional changes of the population across income and represents the socio-economic aspects of inequality in health care [22]. Meanwhile, the recent literature has been considering the two-part decision making process in measuring income-related inequity in health care [4,6,7,11,15]. Pohlmeier and Ulrich [23] contributed to the research on the two-part decision making process, which is divided into patient-driven and doctor-driven decisions. At the first stage of the decision making process, it is the patient who determines the initial contact to maximize utility [23]. At the second stage, based on the principal-agent relationship between a doctor and a patient, the physician mainly determines the subsequent visits on the patient's behalf [23]. They contend that the decisions to make an initial contact and subsequent visits are different stochastic mechanisms and should be estimated separately; if not, it results in inconsistent estimates and misleading conclusions [23].
The existing studies of Korea, most of which use data from the Korean National Health and Nutrition Examination Survey (KNHANES), have employed a cross-sectional analysis [2,7,16-21,24-30]. Much attention has been directed to the analyses of horizontal inequity in health care by sub-groups: by age groups [16,18,25-27], by disease [24], by region [17,18], and by type and/or level of care [7,19-21]. However, there is a relative paucity of research on horizontal inequity by level and type of care, and little is understood about the two-part decision making process, except for the report of Lu et al. [7], who used data from the 1999 KNHANES. Among estimation methods, the HIWV index is clearly dominant [7,17-21,27]. Almost all the research has employed linear model specifications, and many studies do not present statistical significance of the HIww index, except for Lu et al. [7], Kim et al. [16], and Shin and Kim [21]. They have rarely considered the survey design, which affects the point estimates, standard errors, and test statistics [31], except Lu et al. [7] and Shin and Kim [21].
The purpose of this study is to compare and explain the extent of income-related inequity in health care utilization and expenditures between two points of time, 2005 and 2010, employing the HIWV indices based on one- and two-part models. This paper updates the evidence on income-related inequity in health care utilization in Korea in several respects. First, we provide the groundwork for future research on the impact of health policies that have been implemented to reduce out-of-pocket payments since 2009. As the 2007, 2008, and 2009 KNHANES do not offer information on health care utilization and expenditure by type and level of care, we had to choose the latest data of 2005 and 2010. Second, we offer not only the results of health care utilization, that is, a quantitative aspect of health care, around which a great deal of research has tended to center [7,16,19-21,25,26,29], but also evidence of inequity in another aspect of health care, that is, health care expenditures, to which relatively few studies have been devoted [16,19,25-27]. Finally, we strive to further the previous literature of Korea by adopting more elaborate estimation methods. In fact, there is one article about horizontal inequity in health care utilization by type and level of care using data after 2000 that was performed by Rhim and Lee [20] using data from the 2005 KNHANES. However, they did not consider the two-stage decision making process, statistical significance, or the complex survey design.
METHODS
Data
This study was conducted using data from the 2005 and 2010 KNHANES. The KNHANES is a nationally representative survey using a standardized questionnaire, which is based on an independent rolling sampling survey with a complex survey design [32]. The survey data had been collected every three years, but since 2007, it has been annually collected [32]. In this study, 24 278 persons out of the total of 33 733 persons in the 2005 data and 6073 individuals out of the total of 8824 individuals in the 2010 survey, aged 19 years and older, were selected.
We explored health care utilization, consisting of outpatient care (during the past two weeks) and inpatient care (during the past one year), and medical expenditures; the level and type of care were classified into health centers, physician clinics, hospitals, general hospitals, dental care, and licensed traditional medical practitioners (LTMPs). For inpatient care, dental care and LTMP care were excluded because of small sample size.
The KNHANES income measure was self-reported annual household income during the past one year. It was transformed into (log) monthly income per equivalent adult using the square root equivalence scale, which divides household income by the square root of family size [33]. For need variables, age, gender, and health need factors were included. We used the number of chronic diseases, the presence of activity limitations due to any health problems, and self-assessed health to proxy health care need [31,34,35]. It should be noted that the 2005 data covered 44 chronic conditions, while 29 chronic illnesses were distinguished in the 2010 data. We assumed that the exclusion of several disease categories in the 2010 data would not affect the empirical results, since the excluded ones were minor illnesses. To avoid omitted variable bias, we considered non-need variables that are known to be correlated with the use of medical care. We included education and occupational status, region of residence (urban or rural), Medicaid status (medical assistance for lower income groups who do not pay a copayment), and private insurance [4,7,10].
Estimation Methods
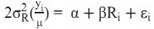
Our approach in this paper relies on the methods used by van Doorslaer et al. [11] to explore and explain inequity in health care utilization and expenditures by employing the concentration index and the HIWV index. To examine inequality in health care, we calculated the concentration index by using a "convenient formula" proposed by Kakwani et al. [36]:
where µ is the sample mean of health care use (y).  is the weighted variance of the fractional rank (Ri). Ri is the fractional rank of the i th individual across income, which is defined as "
 , where wi is the sampling weight of each individual i with the sum of wi equal to the sample size. wj denotes the sampling weight scaled to sum to 1, and w0=0" [36]. The estimated coefficient of the fractional rank (Ri) is equal to the concentration index, and the standard error of the concentration index is the same as the standard error of the estimated coefficient [5,6,31,36]. Although the concentration index of the actual health care utilization, which can be called "CM," indicates the extent of inequality in health care utilization by income, such inequality cannot be interpreted as inequity. This is because the poor tend to have a worse health condition and greater health care need. Therefore, inequality in the use of health care must be standardized for need differences, which can be measured by the HIWV index [4,11,31]. The HIWV index can be calculated by running the following regression:
where yi denotes the actual amount of health care services received by individual i, and µ indicates the mean of yi. yi* is the predicted value through the indirect standardization of yi;µ* is the mean of yi*. The estimated coefficient of the fractional rank (Ri) is equal to the HIWV index, and the standard error of the HIWV index is identical with the standard error of the coefficient [5,10,13,36]. The concentration index is bounded between -1 and 1, and the HIWV index lies in the range from -2 to 2. A positive (negative) value of the index denotes inequality (or inequity) that is in favor of the rich (the poor); a zero or insignificant value means no inequality (or inequity) [4].
Wagstaff et al. [37] show that based on any linear models, the total concentration index can be explained by decomposing its contributions:

where CIn inc, Cn, Cp indicate the concentration indices for the explanatory variables. ηn denotes the estimated use elasticity of each element n; likewise for ηr and ηp. The first term indicates the income contribution to the total inequality, the second one is the need factors' contribution, the third one is the contribution of the non-need variables, and the last one is the contribution of the error term [31,37].
In this paper, we chose an approach using the ordinary least squares (OLS)-based two-part model [4,5,13]. In addition, we employed the OLS-based one-part model for the total number of instances of health care use including all observations. Moreover, sample weights and robust standard errors calculated by using the Huber-White estimator were applied to obtain unbiased estimates and their correct standard errors. All the estimates were obtained using STATA version 12.0 (Stata Corp., College Station, TX, USA).
RESULTS
General Characteristics of the Study Sample
The general characteristics of the study sample used in the analysis are given in Table 1. The average monthly income per equivalent adult was 1 321 905 Korean won in 2005 and 2 244 000 Korean won in 2010. The average ages of the sample population in 2005 and 2010 were 43.2 and 45.1 years old, respectively. The distributions of self-assessed health were similar. Sixty-five percent of the sample in 2005 and 36% of the population in 2010 reported that they had at least one chronic disease, and 8% of the population in 2005 and 12% of the individuals in 2010 complained about activity limitations. Most people for both years had completed a high school education or higher. The percentage of the unemployed was 40% for both years; the majority of the population lived in a city. The proportion of those with Medicaid status was 3.7% in 2005 and 2.5% in 2010. Most people had supplementary private insurance. In terms of health care utilization and expenditures, people in 2010 were more likely to use health care than those in 2005. However, the average number of visits (at least one visit) was higher in 2005 than in 2010. Medical expenditures per use (or day) were higher in 2010 than in 2005.

General characteristics of the study sample
Measuring Inequality and Inequity in Health Care
The results of inequality and inequity in health care are summarized in Table 2.
Income-related inequality and inequity in health care utilization and health care expenditures
Outpatient care utilization
As with outpatient care utilization in 2005, most indices for the probability of any 'actual' use are pro-poor and statistically significant; half of them turn out to be insignificant in the second stage of the decision process. After need standardization, most HIWV indices turn out to be not significantly different from zero. Although insignificant indices indicate that there is no inequity in outpatient care use, we need to examine the direction and magnitude of inequity. For the one-part model, a socio-economic gradient in medical care use appears; the utilization for health centers is in favor of the poor, and the use of general hospitals somewhat favors the rich. The separation of the decision process offers a more detailed and different picture for outpatient care. For the probability of outpatient care visits in 2005, except health centers, the use of primary care shows a pro-rich tendency, although only dental care shows statistically significant pro-rich inequity. As for secondary care, the HIWV index for general hospitals presents statistically significant inequity favoring the rich. Moreover, a socio-economic gradient is evident for the likelihood of outpatient care use. For the number of visits, the socio-economic gradient is rather reduced relative to the first stage of the decision.
In terms of outpatient care use in 2010, the HIWV indices for most medical facilities are more pro-poor than those of 2005, except for the use of health centers and LTMPs. Interestingly, for the likelihood of outpatient care, there are pro-rich tendencies for primary care such as physician clinics, dental care, and LTMPs; pro-poor patterns appear for secondary care such as hospitals and general hospitals. As with secondary care, less pro-poor tendencies emerge in the second stage of the decision process than in the first stage, being aggravated over the period between 2005 and 2010. Furthermore, the gradient of socio-economic differences in the use of health care could not be found any more in the first stage of the decision process; however, for the frequency of visits to a doctor, evidence of a socio-economic gradient in health care is still found.
Inpatient care utilization
For inpatient care in 2005, once need is standardized, significant pro-rich inequity in the probability of general hospital use is discovered in the first stage of the decision process, but significant pro-poor inequity in the number of such days of care leads to the equitable distribution of the total number of inpatient stays, offsetting pro-rich inequity in the first stage.
In relation to inpatient care in 2010, after need standardization, almost all of the indices in 2010 show more pro-rich patterns compared with the 2005 data, except the probability of inpatient care use in general hospitals. Access to general hospitals has been substantially improved over the period between 2005 and 2010, but the length of stay in general hospitals turns out to show a pro-rich tendency.
Medical expenditure per use (or day)
With regard to medical expenditure per use (or day), for both 2005 and 2010, after need is controlled, pro-rich biases still appear for the second stage of the decision-making processes. However, in comparison with the 2005 data, all the indices in 2010 became more pro-poor.
Explaining Inequality in Health Care
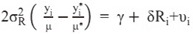
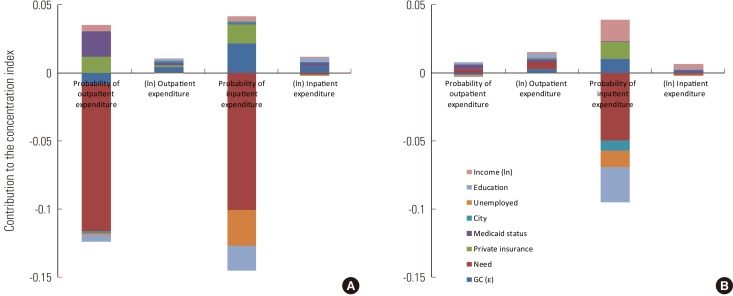
It is worth examining the causes of inequality in health care using the decomposition approach, which offers helpful insights into inequality in health care. Figure 1 shows the extent and direction of the contributions of inequality in outpatient care utilization. With perfect equity, the need bar would be the only one to be seen. If there are disparities between the actual and need-standardized utilization, the other bars will emerge owing to either the contributions of income and other non-need variables or the effect of an error term [11].
(A) Decomposition of inequality for the probability of visits of outpatient care. (B) Decomposition of inequality for the number of visits of outpatient care. (C) Decomposition of inequality for total visits of outpatient care. The left figures are for 2005 and the right figures are for 2010. The Income variable was transformed into logarithm form. LTMPs, licensed traditional medical practitioners; GC (ε), contribution of the error term.
For outpatient care utilization, although the most significant factors are need variables generating pro-poor inequality, the contributions of non-need variables are more pronounced in the second stage of the decision process. In comparison with the 2005 data, especially, the contribution of income to inequality in 2010 has been increasing considerably through the two stages of the decision process. Furthermore, the effect of education has substantially contributed to inequality, leading to the socio-economic gradient over the period between 2005 and 2010.
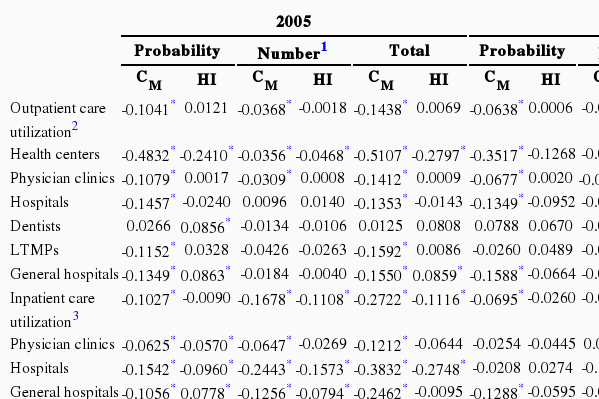
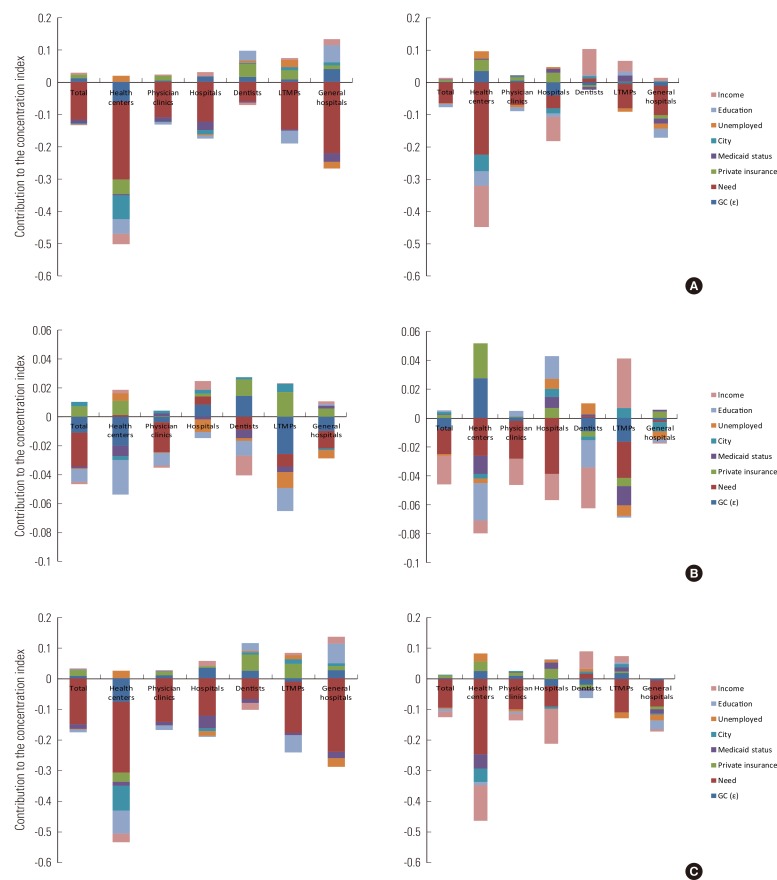
Figure 2 reveals the decomposition of inequality in inpatient care utilization, and Figure 3 presents the sources of inequality in medical expenditures. By comparison with the 2005 data, the contribution of need variables has slightly decreased in 2010, but the effects of non-need variables have been substantially growing. The contributions of income, education, and private insurance have been increasing over time. For inequality in inpatient care use, holding private insurance has contributed considerably to pro-rich inequality in the likelihood of inpatient care but not the length of stay at a hospital.

(A) Decomposition of inequality for the probability of days of inpatient care. (B) Decomposition of inequality for the number of days of inpatient care. (C) Decomposition of inequality for total days of inpatient care. The left figures are for 2005 and the right figures are for 2010. The Income variable was transformed into logarithm form. GC (ε), contribution of the error term.
(A) Decomposition of inequality for medical expenditure per use (or day) in 2005. (B) Decomposition of inequality for medical expenditure per use (or day) in 2010. The Income variable was transformed into logarithm form. GC (ε), contribution of the error term.
DISCUSSION
In terms of the results of the general characteristics of the study sample, although the same method for processing data was used, there are differences between the results of 2005 and 2010. As seen in Table 1, the data of 2005 include a few more young people than those of 2010, which may affect the differences in the results of the general characteristics of the sample such as income level, self-assessed health status, the number of chronic diseases, activity limitations, the level of education, and so on. Therefore, the results of this paper should be carefully interpreted. It should also be noted that the income difference between 2005 and 2010 does not matter because the income variable was used as the ranked form of the logarithm of monthly income per equivalent adult in the analysis [31].
Since we focus mainly on how income-related inequity in the delivery of health care changed between 2005 and 2010, this part mostly covers the results of 2010. The results provide evidence of the equitable distribution of overall health care utilization with pro-poor tendencies and of modest pro-rich inequity in the amount of medical expenditures in 2010, which is consistent with the Korean literature [7,16-21,27]. For the decomposition analysis, non-need variables, such as income, education, and private insurance, have been more important and have considerably contributed to pro-rich inequality in health care over the period between 2005 and 2010. This finding is in accord with the previous literature [4,6,7,9-11,14-16,21,38].
This paper contributes to the study of equity of Korea in several ways. First, our findings can serve as a basis for future research examining income-related inequity in health care delivery after a series of health policies were introduced in 2009 and 2010. Second, we look into income-related inequity in both health care utilization and expenditures in order to comprehend two important aspects of health care. Lastly, it offers more accurate results by employing two-stage decision making and considering the complex survey design of the KNHANES. By examining and comparing the results of 2005 and 2010, we found that for outpatient care from 2005 to 2010, the significant socio-economic gradient in access to care has disappeared over time; a more pro-poor pattern has appeared in the use of secondary care, indicating that access to such care for the poor has been improved. These changes might have been the effects of health policies implemented in 2009 and 2010, reducing the financial barrier for the poor to access care. However, the disadvantaged in Korea have been less likely to have access to primary care over time, except dental care. This trend has carried on over time in the period between 1998 and 2010 by comparison with the previous Korean studies done by Lu et al. [7] and Rhim and Lee [20]. Once the individuals come in contact with the health system, for secondary care in 2005 and 2010, a more pro-rich pattern in the number of visits seems to appear in comparison with the initial contact, which has been intensified over time. This means that though the poor are more likely to use secondary care because of their greater health care needs, given the initial contact, the poor tend to visit a hospital less often. As seen in the decomposition analysis in 2005 and 2010, non-need variables, especially income, private insurance, and education, have a substantial impact on the subsequent visits, which generates concerns about continuing to utilize such care for low-income groups.
As seen in Figure 4, compared to the other Organization for Economic Cooperation and Development (OECD) countries [4,11], inequity in primary outpatient care was less pro-poor; inequity in secondary outpatient care was more pro-poor in Korea in 2010 throughout both parts of the two-part decision process. This could be explained by the ambiguous distinction between primary care and secondary care in Korea [11]. Remarkably, there is a significant discrepancy in the inequity trend of outpatient care between Korea and other countries. In the other OECD countries, more pro-poor patterns appear in the second stage of the decision-making process than in the probability of outpatient care (both general practitioner care and medical specialist care) [4,11]. Compared with that, for secondary care in Korea in both years, less of a pro-poor tendency emerges in the second stage of the decision-making process than in the first stage, except for in the use of general hospitals in 2005.
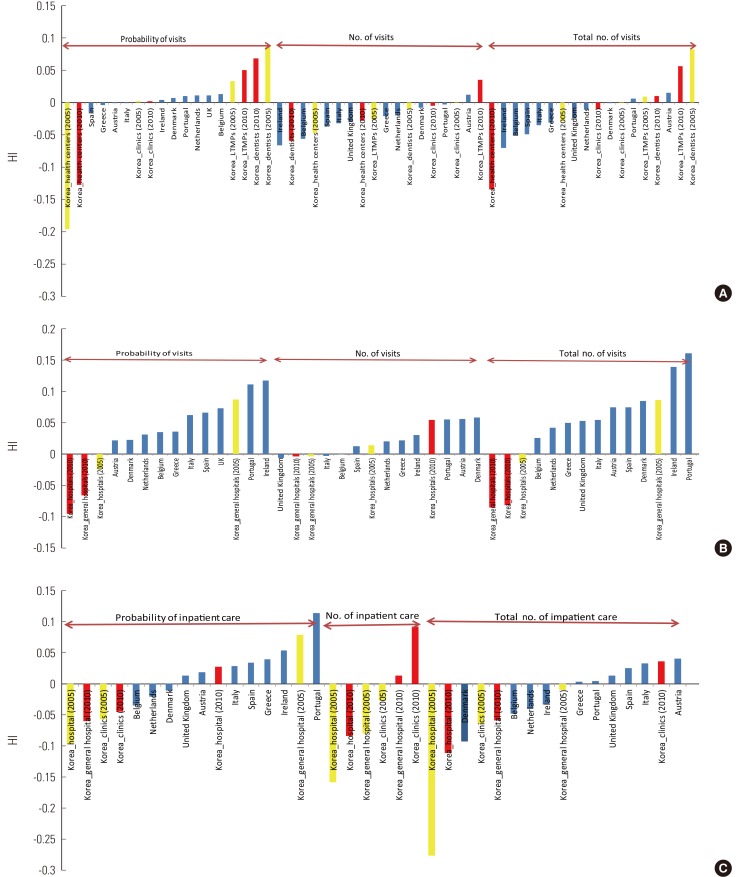
Horizontal inequity index (HI) in primary outpatient care in comparison with selected OECD countries. (B) HI indices in secondary outpatient care in comparison with selected OECD countries. (C) HI indices in inpatient care in comparison with selected OECD countries. Yellow color indicates data for Korea in 2005 and red color indicates data for Korea in 2010. Modified from Van Doorslaer E, et al. Health Econ 2004;13(7):629-647 [11] for (A) and (B), and Van Doorslaer E, et al. Income-related inequality in the use of medical care in 21 OECD countries. Paris: OECD Publishing; 2004 [4] for (C). LTMPS, licensed traditional medical practitioners.
For inpatient care, the findings show that access to general hospitals was improved significantly between 2005 and 2010, but access to inpatient care at physician clinics and hospitals turned out to be more pro-rich in 2010. Furthermore, moving from the first stage to the second stage, pro-rich tendencies appeared in the number of inpatient stays among all the medical facilities in 2010, although they were not statistically significant. These changes may be associated with health policies introduced since 2009 to lower out-of-pocket payments. In addition, as seen in the decomposition results, income affects the length of stay at a hospital. By comparison with the findings of OECD countries in Figure 4 [4], in Korea, more pro-poor inequity patterns appear for access to inpatient care, and more pro-rich trends emerge for the number of inpatient stays, except in hospitals. It would imply that access to inpatient care in Korea is in favor of the poor, but once the patients are hospitalized, they are not treated equally according to need.
Furthermore, although there is an equitable distribution of the likelihood of paying medical expenditures in 2010, the worse-off are more likely to pay inpatient costs for health care because of their higher need. On the other hand, modest prorich inequity in the amount of medical expenditures owing to the contributions of income and education indicates the better-off may be able to enjoy more expensive and better quality of services in the health system. However, pro-rich inequity in the probability of having expenditures and the amount of outlay has fallen over the period between 1998 and 2010 [19]. Kwon et al. [19] use data from the 1998 KNHANES and find the HIWV index of the imputed medical expenditures, which are the aggregated outpatient care outlays and inpatient care costs, is 0.064, although they do not consider non-need factors [19]. Compared with that, our study provides evidence of decreasing pro-rich inequity in the positive medical expenditures. Still, there is a rather large pro-rich inequity in 2010 by comparison with European countries and the US, where most range from -0.061 (Finland) to -0.008 (the US) [13].
There are several limitations in this. First, since the paper used the KNHANES, which is self-reported data, information on health care utilization and expenditures may have the problem of recall bias [38]. In addition, due to changes in survey items, such as the list of chronic diseases, and potential inaccuracies in collecting data, some of the general characteristics in the study sample, such as the number of chronic diseases, seemed to be unusual. This limitation of the survey may make our results less reliable to some extent. However, the KNHANES is a nationally representative survey in Korea, and there is no data source available for the objectives of this study. Second, the analysis only accounts for horizontal inequity in quantities of health care use but not in quality of use such as appropriateness of care. Finally, without further information, the initial visit in the reference period, especially a short duration of outpatient care, need not necessarily be patient-driven; nor need it be doctor-driven, since it may have been part of a continuous illness episode of the previous spell [23]. Future research that overcomes these limitations will be needed in investigating income-related inequity in health care. The long-term effects of health policies since 2009 should also be monitored.
The findings in this paper shed light on what has been achieved and what should be done for improving the equity in the Korean health system. We find that health care utilization in Korea in 2010 is fairly equitable, and policies for reducing out-of-pocket payments since the late 2000s might have contributed to improving access to secondary care for the disadvantaged. On the other hand, the poor still have some barriers to accessing primary care and to receiving ongoing medical care. Therefore, the government needs to introduce policies to tackle these problems.
Notes
The authors have no conflicts of interest with the material presented in this paper.