Drug Prescription Indicators in Outpatient Services in Social Security Organization Facilities in Iran
Article information

Abstract
Objectives:
The aim of this study was to estimate drug prescription indicators in outpatient services provided at Iran Social Security Organization (SSO) healthcare facilities.
Methods:
Data on all prescribed drugs for outpatient visits from 2017 to 2018 were extracted from the SSO database. The data were categorized into 4 main subgroups: patient characteristics, provider characteristics, service characteristics, and type of healthcare facility. Logistic regression models were used to detect risk factors for inappropriate drug prescriptions. SPSS and IBM Modeler software were utilized for data analysis.
Results:
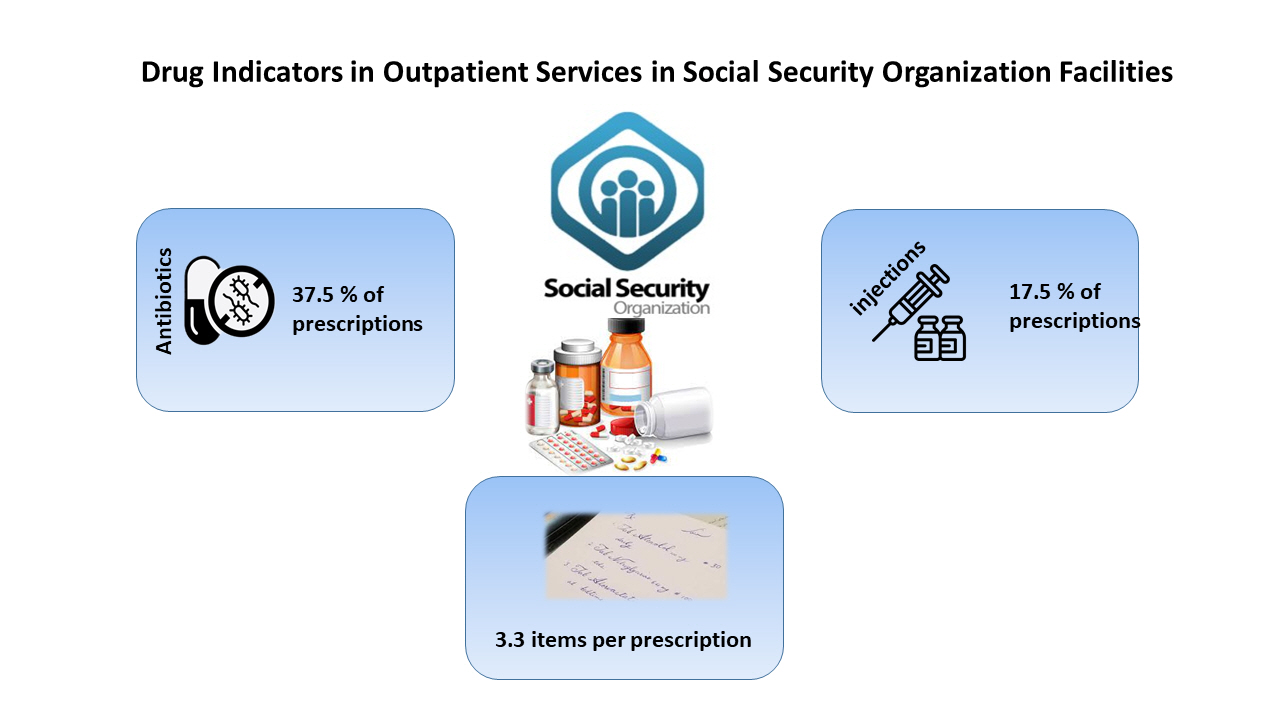
In 2017, approximately 150 981 752 drug items were issued to outpatients referred to SSO healthcare facilities in Iran. The average number of drug items per outpatient prescription was estimated at 3.33. The proportion of prescriptions that included an injection was 17.5%, and the rate of prescriptions that included an antibiotic was 37.5%. Factors such as patient sex and age, provider specialty, type of facility, and time of outpatient visit were associated with the risk of inappropriate prescriptions.
Conclusions:
In this study, all drug prescription criteria exceeded the recommended limits set by the World Health Organization. To improve the current prescription patterns throughout the country, it would be beneficial to provide providers with monthly and annual reports and to consider implementing some prescription policies for physicians.
INTRODUCTION
Rational use of drugs is a crucial parameter in human health. The World Health Organization (WHO) has defined rational drug prescription as the process by which “patients receive medications appropriate to their clinical needs, in doses that meet their individual requirements, for an adequate period of time, and at the lowest cost to them and their communities.” While drugs can improve a patient’s health, improper use may threaten human health [1,2].
Several studies have indicated that the total per capita drug consumption in Iran exceeds standard limits. For example, published reports have demonstrated that from 2005 to 2011, the per capita consumption of drugs, including tablets and capsules, increased by approximately 17.7% nationwide [3]. In a related study, the average number of items per prescription was estimated to be 3.93 at a military hospital in Tehran [4]. Furthermore, in another study, specialists and general physicians in an Iranian province were estimated to issue 2.93 items per prescription [5].
Improving drug prescription patterns and moving towards their rational use is strongly recommended by the WHO. To manage drug prescriptions effectively, it is essential to provide physicians and other healthcare providers with proper guidelines and to increase patient awareness about the risks of medicine overuse and its side effects. Conducting a situation analysis should be the initial step in this process [6,7]. The Social Security Organization (SSO) is the second-largest provider of healthcare services in Iran, following hospitals affiliated with medical universities. The SSO delivers healthcare services to more than half of the country’s population, and its facilities are widespread throughout Iran. While all individuals can access SSO healthcare facilities, only subscribers to the SSO can use these services without any patient co-payment.
Outpatient services are provided in various types of facilities within the SSO. Typically, clinics are staffed by general physicians, gynecologists, pediatricians, internists, and general surgeons. Hospital clinics and specialty clinics offer outpatient appointments with specialists and subspecialists, while day clinics provide both outpatient surgery and visits. Additionally, all facilities offer paraclinical services alongside consultations. The purpose of this study was to estimate drug prescription indicators in the outpatient services of Iran’s SSO healthcare facilities and to compare them with WHO standards.
METHODS
This was a cross-sectional study that encompassed all healthcare facilities of the SSO, which include hospitals, general clinics, polyclinics, and day clinics across the country. Data on all prescribed drugs for outpatient visits from March 21, 2017 to March 20, 2018 were extracted from the Electronic Prescription System database. The dataset comprised 150 981 752 records. The study was conducted from 2017 to 2020. The extended duration of the study was attributable to the time required for establishing the database and cleaning the data. The data were extracted and reanalyzed 3 times to ensure accuracy.
The collected data were categorized into main subgroups consisting of patient characteristics (age and sex), provider characteristics (type of specialty), and healthcare facility type. Following data acquisition, a data cleaning phase was conducted. During this phase, irrelevant data resulting from registration errors were identified and removed prior to the final analysis. For data analysis, the data were retrieved from structured query language formats compatible with statistical software. SPSS version 23 (IBM Corp., Armonk, NY, USA) and IBM Modeler software were utilized for the data analysis.
Ethics Statement
The research project was approved by Research Ethics Committees of Motamed Cancer Institute-Academic Center for Education, Culture and Research (ACECR) with ethics code No. IR.ACECR.IBCRC.REC.1396.2. All research protocols and ethics issue were approved by the ACECR Ethics Committee. Because human data were used for the study, the study followed the Declaration of Helsinki.
This study was a secondary study. The data were extracted from the SSO database of the Electronic Prescription System. There were no encounters with subjects during the study and the subjects were unidentifiable for the research team because data were anonymized and the ID codes were changed before sharing data for the research.
RESULTS
An analysis of extracted data revealed that approximately 150 981 752 drug items were issued for outpatients across SSO healthcare facilities in Iran in 2017. These prescriptions encompassed 1001 distinct drug types, categorized based on the frequency of drug names. The demographic characteristics of caregivers and providers are presented in Table 1.
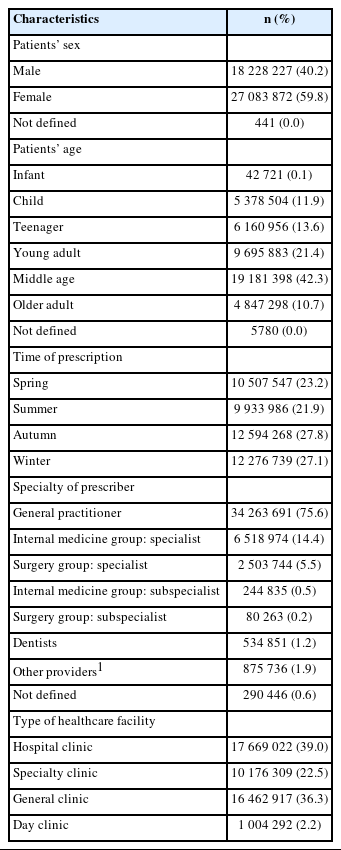
Characteristics of prescriptions in Social Security Organization healthcare facilities in 2017 (n=45 312 540)
The aggregated data showed that this quantity of medications was prescribed in 45 312 540 physician prescriptions for 10 985 994 insured individuals. The majority of insured outpatients who received drug prescriptions were female, accounting for 55.7%. Furthermore, most insured individuals received multiple prescriptions throughout the study year, with 70.0% receiving 1-4 prescriptions and 30.0% receiving more than 4 prescriptions within the year.
The average number of drug items per outpatient prescription was estimated to be 3.33. Additional indicators studied included the percentage of encounters with an antibiotic prescribed and the percentage of encounters that involved an injection. The results of the prescription indicators are summarized in Table 2.
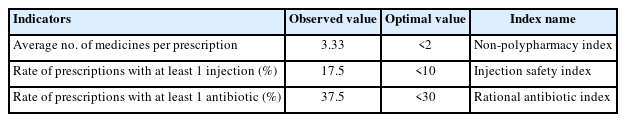
Prescription indicators for outpatients in Social Security Organization healthcare facilities in a 12-month period (2017-2018)
Logistic regression analysis indicated that patient sex, age, provider specialty, type of facility, and time of prescription affected the risk of prescribing a greater number of medications per prescription (p<0.001). The analysis suggested that females are more likely to receive prescriptions containing a higher number of drugs. Older individuals tend to be prescribed more medications per visit. The likelihood of being prescribed more than two drugs per prescription was higher in the autumn and winter seasons. General practitioners were found to prescribe more medications, and the prescription patterns at hospital clinics were more favorable compared to other centers (Table 3).
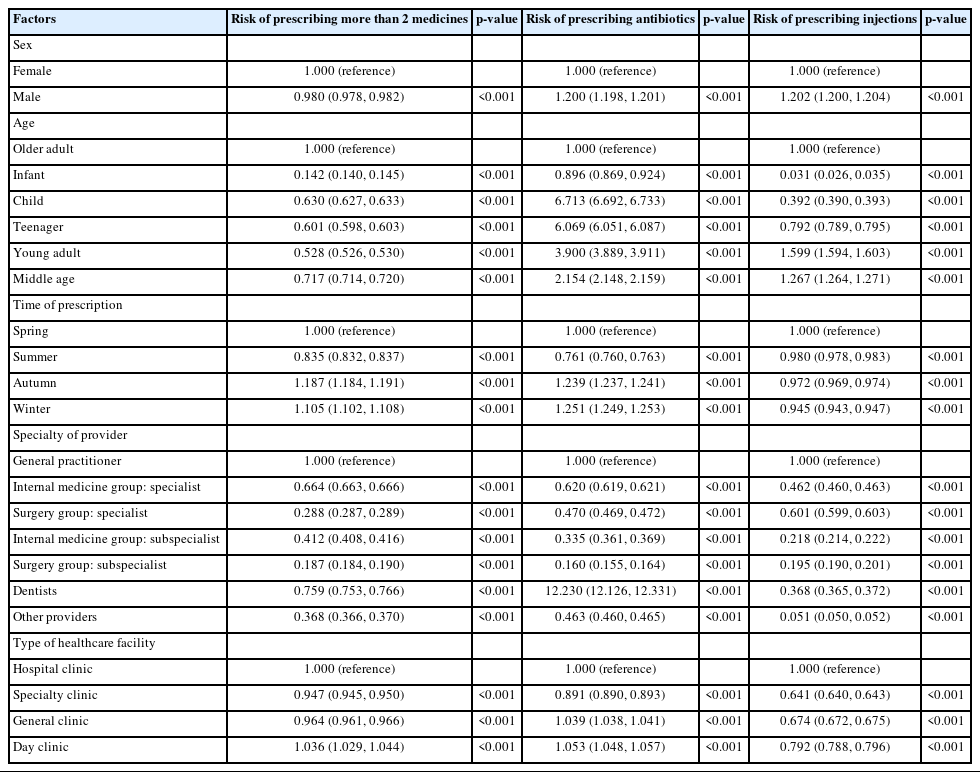
Factors associated with the risk of prescription patterns for outpatients referred to Social Security Organization healthcare facilities
The analysis also indicated that patient sex, age, providers’ specialty, type of facility, and time of prescription increased the risk of an antibiotic being prescribed at each encounter (p<0.001). The test odds ratio showed that the risk of prescribing antibiotics was higher in males. Children and teenagers received antibiotics more frequently than other age groups. Antibiotic prescriptions were more likely in autumn and winter. Dentists were the primary prescribers of antibiotics, and the risk was higher in general clinics and day clinics (Table 3).
Further investigations revealed that certain patient characteristics—including sex, age, the provider’s specialty, the type of facility, and the timing of the prescription—were associated with an increased likelihood of an injection being prescribed at each encounter (p<0.001). Specifically, males were more likely to receive injections with each prescription. Both young adults and middle-aged patients were found to have a higher incidence of receiving injections. Additionally, the data indicated that the risk of injectable drug prescriptions was higher in the spring. General practitioners tended to prescribe injections more frequently, whereas the likelihood of receiving an injectable drug prescription was lower in hospital clinics (Table 3).
DISCUSSION
Rational drug prescription is a critical aspect of the healthcare system due to its impact on both population health and the economy of the drug industry. In this study, the average number of drugs prescribed per encounter was estimated to be approximately 3.33, which exceeds the limit recommended by the WHO. It is evident that prescribing a high number of drugs to a patient increases the risk of drug interactions and also reduces the cost-effectiveness of the medications [8-10]. The prescribing index in this study was higher than that reported in some other studies [11,12]. However, there are studies, such as the one by Shrestha and Dixit [13] in Kathmandu, which present even higher figures (5.85 per prescription).
There were significant differences in the drugs prescribed to males and females. Male received fewer medications overall, but they were prescribed more antibiotics and injections. These discrepancies may be attributed to variations in disease patterns between the sexes or to the influence of sex biases on prescribing practices; however, further investigation is required. Orlando et al. [14] also demonstrated that the number of prescriptions was higher in females than in males. Fernández-Liz et al. [15] suggested that the higher rates of healthcare utilization among females and their greater life expectancy at birth should be considered primary factors for the observed sex differences in drug usage patterns.
We also observed differences in drug prescribing patterns across various age groups. Older patients were prescribed more medications per encounter, yet the rate of antibiotic prescription was higher among children, teenagers, young adults, and middle-aged adults, in that order. Infants were the only age group that received fewer antibiotics. Several studies have shown that antibiotic use in the pediatric population is significantly higher, both in terms of the proportion of children receiving at least one prescription annually and the number of antibiotic treatments per child per year [16,17]. It appears that the elevated rate of antibiotic prescriptions for children is more influenced by drug prescription policies and guidelines.
Drug prescription patterns varied across different seasons. The number of drugs per prescription, as well as the frequency of prescriptions containing antibiotics, was higher in autumn and winter. Conversely, the prescription of injectable drugs peaked in spring. This suggests a clear relationship between disease patterns and seasons. Supporting evidence comes from other studies, such as the one by Galistiani et al. [18], which focused on antibiotic prescriptions in children. This study found that the highest rates of monthly antibiotic prescriptions in the pediatric population occurred during winter, with a peak in January. Seasonal fluctuations in outpatient antibiotic use in the general population are likely linked to the increased incidence of viral respiratory infections during autumn and winter. However, in the pediatric population, these fluctuations may be more closely associated with school attendance [19].
The prescriber effect was also investigated in this study. It was found that general practitioners tend to prescribe more medications per encounter compared to other specialty and subspecialty groups. This was particularly true for injectable drugs. However, when it came to antibiotic medications, dentists played a more significant role. A study examining the trend of antibiotic prescribing by profession in British Columbia, Canada, revealed that the overall antibiotic prescriptions by dentists increased by 62.2% from 1996 to 2013, rising from 0.98 defined daily dose per 1000 inhabitants per day (DID) to 1.59 DID, Additionally, their proportionate contribution to antibiotic prescriptions increased from 6.7% to 11.3% [20]. It is important to note that dental services typically involve treatment through procedures rather than medications. Therefore, when dentists do prescribe drugs, it is often due to dental infections being the primary concern.
Our comparison of drug prescription patterns across various healthcare facilities revealed distinct differences among the types of facilities. Hospital clinics, specialty clinics, and day clinics typically offer a broad range of healthcare services across multiple specialty levels, whereas general clinics are primarily staffed by general practitioners. Additionally, the scope of services varies; for instance, day clinics not only offer outpatient visits but also perform certain outpatient surgeries. Another factor contributing to these differences may be the range of para-clinical services available in each group, which attracts patients with different morbidities.
The results of this study offer a comprehensive overview of drug prescription and consumption among SSO subscribers, highlighting both the strengths and weaknesses of current strategies in this area. These insights could be instrumental in enhancing drug prescribing practices within the SSO. Improving the existing database and delivering monthly and annual reports to providers are anticipated to be effective methods for improving the status quo. Additionally, implementing prescription policies for physicians and incorporating them as evaluation indicators appears to be a promising approach.
Data Availability
The datasets analyzed during the current study are not publicly available, because Social Security Organization is the owner of the data and did not allow the research team to share the raw data.
Notes
Conflict of Interest
The authors have no conflicts of interest associated with the material presented in this paper.
Funding
This project was funded by the Social Security Organization Research Institute.
Author Contributions
Conceptualization: Aeenparast A, Maftoon F. Data curation: Aeenparast A, Farzadi F. Formal analysis: Haeri Mehrizi AA. Funding acquisition: Aeenparast A. Methodology: Aeenparast A, Maftoon F. Project administration: Aeenparast A. Visualization: Aeenparast A. Writing – original draft: Aeenparast A. Writing – review & editing: Haeri Mehrizi AA, Maftoon F, Farzadi F.
Acknowledgements
This research was designed and implemented by the Iranian Institute for Health Sciences Research and financially supported by Social Security Organization (SSO) Research Institute. We would like to thank the SSO members and Tamin ICT & Management Consultancy Services Company, which collaborated in data extraction.