 KSPM


Articles
- Page Path
- HOME > J Prev Med Public Health > Volume 50(6); 2017 > Article
-
Original Article
Risk Reduction of Breast Cancer by Childbirth, Breastfeeding, and Their Interaction in Korean Women: Heterogeneous Effects Across Menopausal Status, Hormone Receptor Status, and Pathological Subtypes -
Seok Hun Jeong1,2
 , Yoonsuk An1,2, Ji-Yeob Choi1,2,3, Boyoung Park4,5, Daehee Kang1,2,3, Min Hyuk Lee6, Wonshik Han2,7, Dong-Young Noh2,7, Keun-Young Yoo1,8, Sue K. Park1,2,3
-
Journal of Preventive Medicine and Public Health 2017;50(6):401-410.
DOI: https://doi.org/10.3961/jpmph.17.152
Published online: November 30, 2017
1Department of Preventive Medicine, Seoul National University College of Medicine, Seoul, Korea
2Cancer Research Institute, Seoul National University, Seoul, Korea
3Department of Biomedical Science, Seoul National University Graduate School, Seoul, Korea
4National Cancer Center Graduate School of Cancer Science and Policy, Goyang, Korea
5National Cancer Control Institute, National Cancer Center, Goyang, Korea
6Department of Surgery, Soonchunhyang University College of Medicine, Seoul, Korea
7Department of Surgery, Seoul National University Hospital, Seoul National University College of Medicine, Seoul, Korea
8Armed Forces Capital Hospital, Seongnam, Korea
- Corresponding author: Sue K. Park, MD, PhD 103 Daehak-ro, Jongno-gu, Seoul 03080, Korea Tel: +82-2-740-8338, Fax: +82-2-747-4830 E-mail: suepark@snu.ac.kr
Copyright © 2017 The Korean Society for Preventive Medicine
This is an Open Access article distributed under the terms of the Creative Commons Attribution Non-Commercial License (http://creativecommons.org/licenses/by-nc/4.0/) which permits unrestricted non-commercial use, distribution, and reproduction in any medium, provided the original work is properly cited.

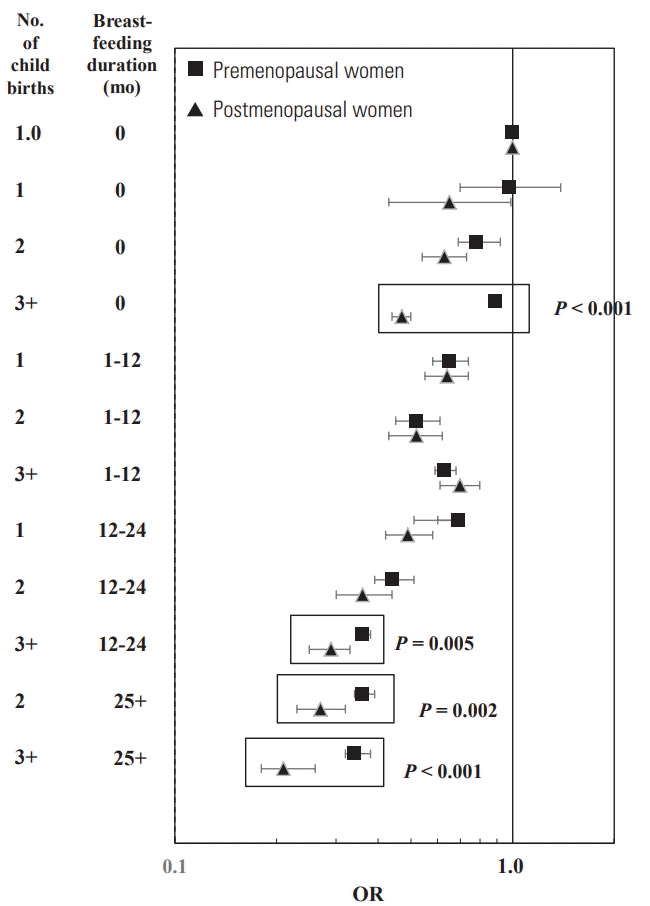
Figure & Data
References
Citations

- Effect of breastfeeding on the risk of breast cancer: a meta-analysis of observational studies
Rini Mutahar, Asri C. Adisasmita, Ratna Djuwita, Denni Joko Purwanto, Rini Anggraini, Yeni, Danny K. Aerosta
International Breastfeeding Journal.2026;[Epub] CrossRef - Novel Breast Cancer Risk Assessment Tools for Pre- and Postmenopausal Asian Women: Development and Validation in a Nationwide Mammographic Screening Cohort
Wonyoung Jung, Yong-Moon Mark Park, Sang Hyun Park, Kyungdo Han, Junhee Park, Yohwan Yeo, Jung Kwon Lee, Dale P. Sandler, Dong Wook Shin
Cancer Research and Treatment.2025; 57(4): 1051. CrossRef - Global trends in early-onset and late-onset cancer incidence
Sohyun Kim, NaNa Keum
Journal of Public Health.2025; 47(4): 699. CrossRef - Exploring novel protein-based biomarkers for advancing breast cancer diagnosis: A review
Christina Jane Vellan, Tania Islam, Sumadee De Silva, Nur Aishah Mohd Taib, Galhena Prasanna, Jaime Jacqueline Jayapalan
Clinical Biochemistry.2024; 129: 110776. CrossRef - Reproductive characteristics, menopausal status, race and ethnicity, and risk of breast cancer subtypes defined by ER, PR and HER2 status: the Breast Cancer Etiology in Minorities study
Esther M. John, Jocelyn Koo, Amanda I. Phipps, Teri A. Longacre, Allison W. Kurian, Sue A. Ingles, Anna H. Wu, Lisa M. Hines
Breast Cancer Research.2024;[Epub] CrossRef - Association of reproductive risk factors and breast cancer molecular subtypes: a systematic review and meta-analysis
Xihua Mao, Chioma Omeogu, Shama Karanth, Ashwini Joshi, Clare Meernik, Lauren Wilson, Amy Clark, April Deveaux, Chunyan He, Tisha Johnson, Karen Barton, Samantha Kaplan, Tomi Akinyemiju
BMC Cancer.2023;[Epub] CrossRef - Perikonzeptionelle Beratung bei Risikokonstellationen
Christian Gnoth, Mareen ten Busch, Nadine Sutter, Peter Mallmann
Journal für Gynäkologische Endokrinologie/Schweiz.2022; 25(4): 176. CrossRef - Isoflavone intake on the risk of overall breast cancer and molecular subtypes in women at high risk for hereditary breast cancer
Eun Ji Sim, Kwang-Pil Ko, Choonghyun Ahn, Sang Min Park, Young-Joon Surh, Seokyung An, Sung-Won Kim, Min-Hyuk Lee, Jong Won Lee, Jeong Eon Lee, Ku Sang Kim, Cha Kyong Yom, Hyun-Ah Kim, Sue K. Park
Breast Cancer Research and Treatment.2020; 184(2): 615. CrossRef - Combination of circulating miR-145-5p/miR-191-5p as biomarker for breast cancer detection
Yeldar Ashirbekov, Arman Abaildayev, Nazgul Omarbayeva, Dauren Botbayev, Ayaz Belkozhayev, Anel Askandirova, Alena Neupokoyeva, Gulzhakhan Utegenova, Kamalidin Sharipov, Nagima Aitkhozhina
PeerJ.2020; 8: e10494. CrossRef - PI3K/AKT/mTOR Signaling Pathway in Breast Cancer: From Molecular Landscape to Clinical Aspects
Daniela Miricescu, Alexandra Totan, Iulia-Ioana Stanescu-Spinu, Silviu Constantin Badoiu, Constantin Stefani, Maria Greabu
International Journal of Molecular Sciences.2020; 22(1): 173. CrossRef - Perikonzeptionelle Beratung bei Risikokonstellationen
Christian Gnoth, Mareen ten Busch, Nadine Sutter, Peter Mallmann
Der Gynäkologe.2019; 52(10): 779. CrossRef - Epidemiological characteristics of breast cancer in Koreans
Sue K. Park
Journal of the Korean Medical Association.2019; 62(8): 424. CrossRef - The contribution of breastfeeding to the prevention of
breast cancer
ASIMENIA MAMAKOU
European Journal of Midwifery.2019;[Epub] CrossRef - Assessment of Levels of Knowledge towards Hormonal Related Breast Cancer Risk Factors in Qurayyat, Northern Saudi Arabia
Abdelbaset Mohamed Elasbali, Elyasa Mustafa Elfakia Mohammed, Ziad Alonzi, Rania Abdeen Hussain Abdalla, Azizah Mazi Aldaham, Diem Fayez Aljubab, Naif Muflih Alsharari, Hussain Gadelkarim Ahmed
Open Journal of Obstetrics and Gynecology.2019; 09(03): 371. CrossRef - Maternal Personality and Psychosocial Variables Associated with Initiation Compared to Maintenance of Breastfeeding: A Study in Low Obstetric Risk Women
Patricia Catala, Cecilia Peñacoba, Javier Carmona, Dolores Marin
Breastfeeding Medicine.2018; 13(10): 680. CrossRef
 PubReader
 ePub Link
 Cite
 XML Download

Figure. 1.
| Total women |
Premenopausal women |
Postmenopausal women |
|||||||
|---|---|---|---|---|---|---|---|---|---|
| BC cases n (%) | Controls n (%) | OR (95% CI) | BC cases n (%) | Controls n (%) | OR (95% CI) | BC cases n (%) | Controls n (%) | OR (95% CI) | |
| Parity | |||||||||
| Nullipara | 291 (2.3) | 144 (1.1) | 1.35 (1.06, 1.69) | 152 (2.4) | 94 (1.5) | 1.16 (0.86-1.59) | 139 (2.12) | 50 (0.8) | 1.72 (1.18, 2.50) |
| Para | 12 598 (97.7) | 12 745 (98.9) | 1.00 (reference) | 6170 (97.6) | 6228 (98.5) | 1.00 (reference) | 6428 (97.9) | 6517 (99.2) | 1.00 (reference) |
| No. of childbirths | |||||||||
| 0 | 291 (2.3) | 144 (1.1) | 1.00 (reference) | 152 (2.4) | 94 (1.5) | 1.00 (reference) | 139 (2.1) | 50 (0.8) | 1.00 (reference) |
| 1 | 2046 (15.9) | 1370 (10.6) | 0.88 (0.69, 1.14) | 1200 (19.0) | 853 (13.5) | 1.01 (0.74, 1.39) | 846 (12.9) | 517 (7.9) | 0.72 (0.48, 1.06) |
| 2 | 7461 (57. 9) | 7552 (58.6) | 0.71 (0.61, 0.83) | 4248 (67.2) | 4526 (71.6) | 0.80 (0.65, 0.97) | 3213 (48.9) | 3026 (46.1) | 0.58 (0.45, 0.74) |
| 3+ | 3091 (24.0) | 3823 (29.7) | 0.62 (0.54, 0.80) | 722 (11.4) | 849 (13.4) | 0.81 (0.70, 0.94)1 | 2369 (36.1) | 2974 (45.3) | 0.40 (0.35, 0.43)1 |
| Breastfeeding | |||||||||
| No children | 291 (2.3) | 144 (1.1) | 1.38 (1.10, 1.75) | 152 (2.4) | 94 (1.5) | 1.17 (0.86, 1.58) | 139 (2.1) | 50 (0.8) | 1.80 (1.24, 2.62) |
| Never | 2966 (23.0) | 1975 (15.3) | 1.00 (reference) | 1945 (30.8) | 1340 (21.2) | 1.00 (reference) | 1021 (15.6) | 635 (9. 7) | 1.00 (reference) |
| Ever | 9632 (74.7) | 10 770 (83.6) | 0.60 (0.55, 0.64) | 4225 (66.8) | 4888 (77.3) | 0.59 (0.54, 0.65) | 5407 (82.3) | 5882 (89.6) | 0.60 (0.53, 0.68) |
| Breastfeeding duration (mo) | |||||||||
| 0 | 3257 (25.3) | 2119 (16.4) | 1.00 (reference) | 2097 (33.2) | 1434 (22.7) | 1.00 (reference) | 1160 (17.7) | 685 (10.4) | 1.00 (reference) |
| 1-12 | 4116 (31.9) | 3624 (28.1) | 0.77 (0.71, 0.84) | 2372 (37.5) | 2470 (39.1) | 0.67 (0.60, 0.74) |
1744 (26.6) | 1154 (17.6) | 0.99 (0.86, 1.14) |
| 13-24 | 2901 (22.5) | 3576 (27.7) | 0.57 (0.52, 0.62) | 1293 (20.5) | 1711 (27.1) | 0.55 (0.48, 0.62) | 1608 (24.5) | 1865 (28.4) | 0.60 (0.52, 0.70) |
| 25+ | 1973 (15.3) | 3002 (23.3) | 0.41 (0.37, 0.46) | 398 (6.3) | 599 (9.5) | 0.44 (0.37, 0.53) | 1575 (24.0) | 2403 (36.6) | 0.44 (0.38, 0.52) |
| Total women |
Premenopausal women |
Postmenopausal women |
||||
|---|---|---|---|---|---|---|
| HR+ | HR- | HR+ | HR- | HR+ | HR- | |
| No. of childbirths | ||||||
| 0 | 1.00 (reference) | 1.00 (reference) | 1.00 (reference) | 1.00 (reference) | 1.00 (reference) | 1.00 (reference) |
| 1 | 0.78 (0.61, 0.99) | 1.25 (0.87, 1.79) | 0.94 (0.69, 1.30) |
1.64 (0.96, 2.78) |
0.57 (0.39, 0.85) |
0.88 (0.53, 1.47) |
| 2 | 0.52 (0.44, 0.60) |
1.04 (0.83, 1.30) |
0.62 (0.50, 0.78) |
1.31 (0.92, 1.86) |
0.48 (0.37, 0.61) |
0.78 (0.57, 1.07) |
| 3+ | 0.39 (0.34, 0.46) |
1.05 (0.86, 1.18) |
0.55 (0.48, 0.61) |
1.39 (0.99, 1.83) |
0.22 (0.18, 0.25) |
0.73 (0.57, 0.99) |
| Breastfeeding duration (mo) | ||||||
| 0 | 1.00 (reference) | 1.00 (reference) | 1.00 (reference) | 1.00 (reference) | 1.00 (reference) | 1.00 (reference) |
| 1-12 | 0.74 (0.69, 0.80) | 0.77 (0.68, 0.87) | 0.67 (0.61, 0.73) |
0.65 (0.55, 0.77) |
1.03 (0.89, 1.20) |
0.94 (0.78, 1.13) |
| 13-24 | 0.52 (0.48, 0.57) | 0.52 (0.46, 0.60) | 0.53 (0.48, 0.59) | 0.48 (0.39, 0.58) | 0.64 (0.55, 0.74) | 0.55 (0.46, 0.67) |
| 25+ | 0.40 (0.37, 0.44) | 0.40 (0.34, 0.47) | 0.45 (0.38, 0.52) | 0.49 (0.37, 0.66) | 0.48 (0.41, 0.57) | 0.40 (0.32, 0.49) |
| Total women |
Premenopausal women |
Postmenopausal women |
||||||||||
|---|---|---|---|---|---|---|---|---|---|---|---|---|
| Luminal A | Luminal B | HER2-enriched | Triple-negative | Luminal A | Luminal B | HER2-enriched | Triple-negative | Luminal A | Luminal B | HER2-enriched | Triple-negative | |
| No. of childbirths | ||||||||||||
| 0 | 1.00 (reference) | 1.00 (reference) | 1.00 (reference) | 1.00 (reference) | 1.00 (reference) | 1.00 (reference) | 1.00 (reference) | 1.00 (reference) | 1.00 (reference) | 1.00 (reference) | 1.00 (reference) | 1.00 (reference) |
| 1 | 0.72 (0.58, 0.88) |
0.87 (0.55, 1.25) |
1.43 (0.83, 2.38) |
1.19 (0.78, 1.82) |
1.01 (0.72, 1.39) |
0.83 (0.49, 1.39) |
1.77 (0.81, 4.00) |
1.69 (0.90, 3.13) |
0.56 (0.37,0.83) |
0.85 (0.42, 1.72) |
1.06 (0.52, 2.17) |
0.80 (0.44, 1.45) |
| 2 | 0.45 (0.40, 0.51) |
0.80 (0.63, 1.03) |
1.23 (0.88, 1.74) |
0.96 (0.75, 1.25) |
0.63 (0.50, 0.79) |
0.88 (0.65, 1.17) |
1.38 (0.84, 2.36) |
1.41 (0.94, 2.09) |
0.36 (0.27, 0.47) |
0.74 (0.48, 1.16) |
1.04 (0.66, 1.65) |
0.64 (0.44, 0.91) |
| 3+ | 0.34 (0.30, 0.38) |
0.74 (0.61, 0.91) |
1.10 (0.83, 1.48) |
0.92 (0.73, 1.15) |
0.55 (0.46, 0.66) |
0.89 (0.72, 1.08) |
1.13 (1.08, 1.68) |
1.68 (1.21, 2.28) |
0.26 (0.20, 0.33) |
0.65 (0.44, 0.99) |
1.03 (0.68, 1.59) |
0.56 (0.40, 0.78) |
| Breastfeeding duration (mo) | ||||||||||||
| 0 | 1.00 (reference) | 1.00 (reference) | 1.00 (reference) | 1.00 (reference) | 1.00 (reference) | 1.00 (reference) | 1.00 (reference) | 1.00 (reference) | 1.00 (reference) | 1.00 (reference) | 1.00 (reference) | 1.00 (reference) |
| 1-12 | 0.73 (0.68, 0.79) | 0.80 (0.68, 0.92) | 0.84 (0.70, 0.99) | 0.71 (0.62, 0.83) | 0.67 (0.61, 0.74) |
0.69 (0.57, 0.83) |
0.68 (0.53, 0.87) |
0.61 (0.51, 0.75) |
0.87 (0.76, 0.99) |
1.00 (0.78, 1.28) |
1.00 (0.79, 1.27) |
0.88 (0.70, 1.11) |
| 13-24 | 0.51 (0.45, 0.55) | 0.63 (0.53, 0.74) | 0.50 (0.42, 0.61) | 0.52 (0.44, 0.61) | 0.51 (0.45, 0.57) | 0.65 (0.51, 0.87) | 0.50 (0.37, 0.67) | 0.45 (0.36, 0.57) | 0.50 (0.44, 0.57) | 0.60 (0.46, 0.77) | 0.48 (0.37, 0.63) | 0.59 (0.47, 0.75) |
| 25+ | 0.39 (0.36, 0.43) | 0.42 (0.34, 0.51) | 0.40 (0.32, 0.50) | 0.37 (0.31, 0.45) | 0.45 (0.38, 0.53) | 0.44 (0.31, 0.63) | 0.68 (0.44, 1.03) | 0.39 (0.27, 0.55) | 0.38 (0.33, 0.43) | 0.43 (0.33, 0.58) | 0.35 (0.27, 0.47) | 0.41 (0.32, 0.53) |
| No. of childbirths | Breastfeeding duration (mo) | Premenopausal women | Postmenopausal women |
|---|---|---|---|
| 0 | 0 | 1.00 (reference) | 1.00 (reference) |
| 1 | 0 | 0.98 (0.70, 1.39) | 0.65 (0.43, 0.99) |
| 2 | 0 | 0.78 (0.69, 0.92) | 0.63 (0.54, 0.73) |
| 3+ | 0 | 0.89 (0.86, 0.94) |
0.47 (0.44, 0.50) |
| 1 | 1-12 | 0.65 (0.58, 0.74) | 0.64 (0.55, 0.74) |
| 1 | 13-24 | 0.69 (0.51, 0.60) | 0.49 (0.42, 0.58) |
| 2 | 1-12 | 0.52 (0.45, 0.61) | 0.52 (0.43, 0.62) |
| 3+ | 1-12 | 0.63 (0.59, 0.68) | 0.70 (0.61, 0.80) |
| 2 | 13-24 | 0.44 (0.39, 0.51) | 0.36 (0.30, 0.44) |
| 2 | 25+ | 0.36 (0.34, 0.39) |
0.27 (0.23, 0.32) |
| 3+ | 13-24 | 0.36 (0.35, 0.38) |
0.29 (0.25, 0.33) |
| 3+ | 25+ | 0.34 (0.32, 0.38) |
0.21 (0.18, 0.26) |
The OR (95% CI) in all women was estimated in conditional logistic regression stratified by age and enrollment year and adjusted for family history of BC, age at menarche, age at first full-term pregnancy, duration of oral contraceptive use, BMI, and breastfeeding duration in the analyses of parity and number of childbirths; or adjusted for family history of BC, age at menarche, age at first full-term pregnancy, duration of oral contraceptive use, BMI, and number of childbirths in the analyses of breastfeeding and its duration. The OR (95% CI) in premenopausal and postmenopausal women was estimated in an unconditional logistic regression model stratified by age and year and adjusted for same covariates. BC, breast cancer; OR, odds ratio; CI, confidence interval; BMI, body mass index.
Values are presented as OR (95% CI). The OR (95% CI) in all women was estimated in conditional logistic regression stratified by age and enrollment year and adjusted for family history of BC, age at menarche, age at first full-term pregnancy, duration of oral contraceptive use, BMI, and breastfeeding duration in the analyses of parity and number of childbirths; or adjusted for family history of BC, age at menarche, age at first full-term pregnancy, duration of oral contraceptive use, BMI, and number of childbirths in the analyses of breastfeeding and its duration. HR, hormone receptor; BC, breast cancer; OR, odds ratio; CI, confidence interval; BMI, body mass index.
Values are presented as OR (95% CI). The OR (95% CI) in all women was estimated in conditional logistic regression stratified by age and enrollment year and adjusted for family history of BC, age at menarche, age at first full-term pregnancy, duration of oral contraceptive use, BMI, and breastfeeding duration in the analyses of parity and number of childbirths; or adjusted for family history of BC, age at menarche, age at first full-term pregnancy, duration of oral contraceptive use, BMI, and number of childbirths in the analyses of breastfeeding and its duration. HR, hormone receptor; BC, breast cancer; OR, odds ratio; CI, confidence interval; BMI, body mass index.
Values are presented as OR (95% CI). The OR (95% CI) in all women was estimated in conditional logistic regression stratified by age and enrollment year and adjusted for family history of BC, age at menarche, age at first full-term pregnancy, duration of oral contraceptive use, BMI, and breastfeeding duration in the analyses of parity and number of childbirths; or adjusted for family history of BC, age at menarche, age at first full-term pregnancy, duration of oral contraceptive use, BMI, and number of childbirths in the analyses of breastfeeding and its duration. The calculated actual OR values in premenopausal and postmenopausal women was estimated using an unconditional logistic regression model stratified by age and year and adjusted for same covariates. BC, breast cancer, OR, odds ratio; CI, confidence interval; BMI, body mass index.


