
Articles
- Page Path
- HOME > J Prev Med Public Health > Volume 56(4); 2023 > Article
-
Original Article
Associations of Workplace Violence With Cardiovascular Disease Among United States Workers: Findings From a National Survey -
Zheyu Hu1
 , Jian Li2
 -
Journal of Preventive Medicine and Public Health 2023;56(4):368-376.
DOI: https://doi.org/10.3961/jpmph.23.032
Published online: July 10, 2023
- 1,602 Views
- 84 Download
1Conestoga High School, Berwyn, PA, USA
2Department of Environmental Health Sciences, Fielding School of Public Health, School of Nursing, University of California, Los Angeles, CA, USA
- Corresponding author: Jian Li, Department of Environmental Health Sciences, Fielding School of Public Health, School of Nursing, University of California, 650 Charles E. Young Drive South, Los Angeles, CA 90095, USA, E-mail: jianli2019@ucla.edu
Copyright © 2023 The Korean Society for Preventive Medicine
This is an Open Access article distributed under the terms of the Creative Commons Attribution Non-Commercial License (https://creativecommons.org/licenses/by-nc/4.0/) which permits unrestricted non-commercial use, distribution, and reproduction in any medium, provided the original work is properly cited.
ABSTRACT
-
Objectives
- Recent research indicates a potential association between workplace violence and an increased risk of cardiovascular disease (CVD) in the working-age population. However, the relevant evidence in the United States is sparse. Thus, this study was conducted to explore the possible relationship between workplace violence and CVD among United States workers.
-
Methods
- We utilized cross-sectional data from the 2015 National Health Interview Survey, which included a representative sample of 18 380 workers, to investigate the associations between workplace violence and the prevalence of CVD using logistic regression. Workplace violence was determined based on self-reported threats, bullying, or harassment at work over the past 12 months, supplemented with additional information regarding frequency. CVD included all forms of heart disease and stroke.
-
Results
- A total of 1334 workers reported experiences of workplace violence, and 1336 workers were diagnosed with CVD. After adjustment for covariates, participants who reported any instance of workplace violence had significantly higher odds of having CVD (odds ratio [OR], 1.76; 95% confidence interval [CI], 1.35 to 2.30) than those who reported no such violence. Furthermore, the highest odds of CVD (OR, 1.80; 95% CI, 1.23 to 2.63) were observed among those frequently exposed to workplace violence. Even occasional exposure to workplace violence was associated with 74% excess odds of CVD.
-
Conclusions
- Our study indicates an association between workplace violence and CVD in United States workers, exhibiting a dose-response pattern.
- The US National Institute for Occupational Safety and Health defines workplace violence as “the action or threat of violence, ranging from verbal abuse to physical assaults directed toward persons at work or on duty” [1]. This issue is a major occupational health problem in the United States and worldwide [2], given its ubiquity across various industries and professions. Workplace violence encompasses a range of behaviors, including physical violence, bullying, harassment, intimidation, and other forms of disruptive behavior [3]. Such violence can result in physical injury or even death. According to data from the US Occupational Safety and Health Administration, acts of violence and other injuries are currently the third-leading cause of fatal occupational injuries in the United States [2]. In addition to physical harm, workplace violence can also lead to various psychological disorders and symptoms among employees, such as stress, depression, and anxiety [4]. It is well-documented that poor mental health is closely linked to numerous psychosomatic disorders over the long term. For example, many victims of workplace violence have reported headaches, fatigue, and insomnia, among other symptoms [5,6].
- Recent research suggests that workplace violence may be associated with an increased risk of cardiovascular disease (CVD) among workers. Kivimäki et al. [7] found that Finnish hospital employees who experienced prolonged bullying had a significantly higher incidence of CVD compared to their non-bullied colleagues at the same facility. Several cohort studies conducted in Germany, Sweden, and Denmark have shown that workplace bullying and violence are risk factors for CVD [8,9]. This research has also indicated a dose-response relationship between exposure to workplace bullying and/or violence and the onset of CVD [9]. In the United States, workplace violence, bullying, and/or harassment have recently garnered substantial attention due to the underreported, ubiquitous, and persistent nature of these problems, which were previously largely ignored [3]. However, limited research evidence exists connecting workplace violence and CVD in the United States. A study involving cross-sectional data from the 2010 US National Health Interview Survey (NHIS) revealed a significant association between workplace harassment and angina pectoris [10], a symptom of coronary artery disease. Another study using the same data indicated a higher prevalence of hypertension, a risk factor for CVD, among workers who had experienced workplace violence [11]. These 2 United States studies provide preliminary evidence of a potential link between workplace violence and symptoms or risk factors of CVD. However, to date, no study has been conducted to broadly assess the associations of workplace violence with overall CVD in the United States adult working population. To address this major gap in United States occupational health research, we used data from a large national survey involving a representative sample of workers to examine the associations between workplace violence and CVD, as well as to test the dose-response relationship. While most previous studies have focused on European populations, findings from other countries, including the United States, can enhance our understanding of workplace violence, help assess hazards in occupational settings, and inform preventive actions.
- The NHIS is a national survey conducted by the US Census Bureau on behalf of the National Center for Health Statistics. It covers a broad range of health-related topics, collected through personal household interviews [12]. For this study, we utilized data from the 2015 NHIS, as it included several measurements of working conditions (detailed below) and, crucially, was the only year in which information on the frequency of workplace violence was collected. Consequently, our study was based on 2 hypotheses: (1) the presence of any workplace violence would be associated with a higher prevalence of CVD among United States workers, and (2) this association would intensify with an increased frequency of workplace violence.
INTRODUCTION
- Study Sample
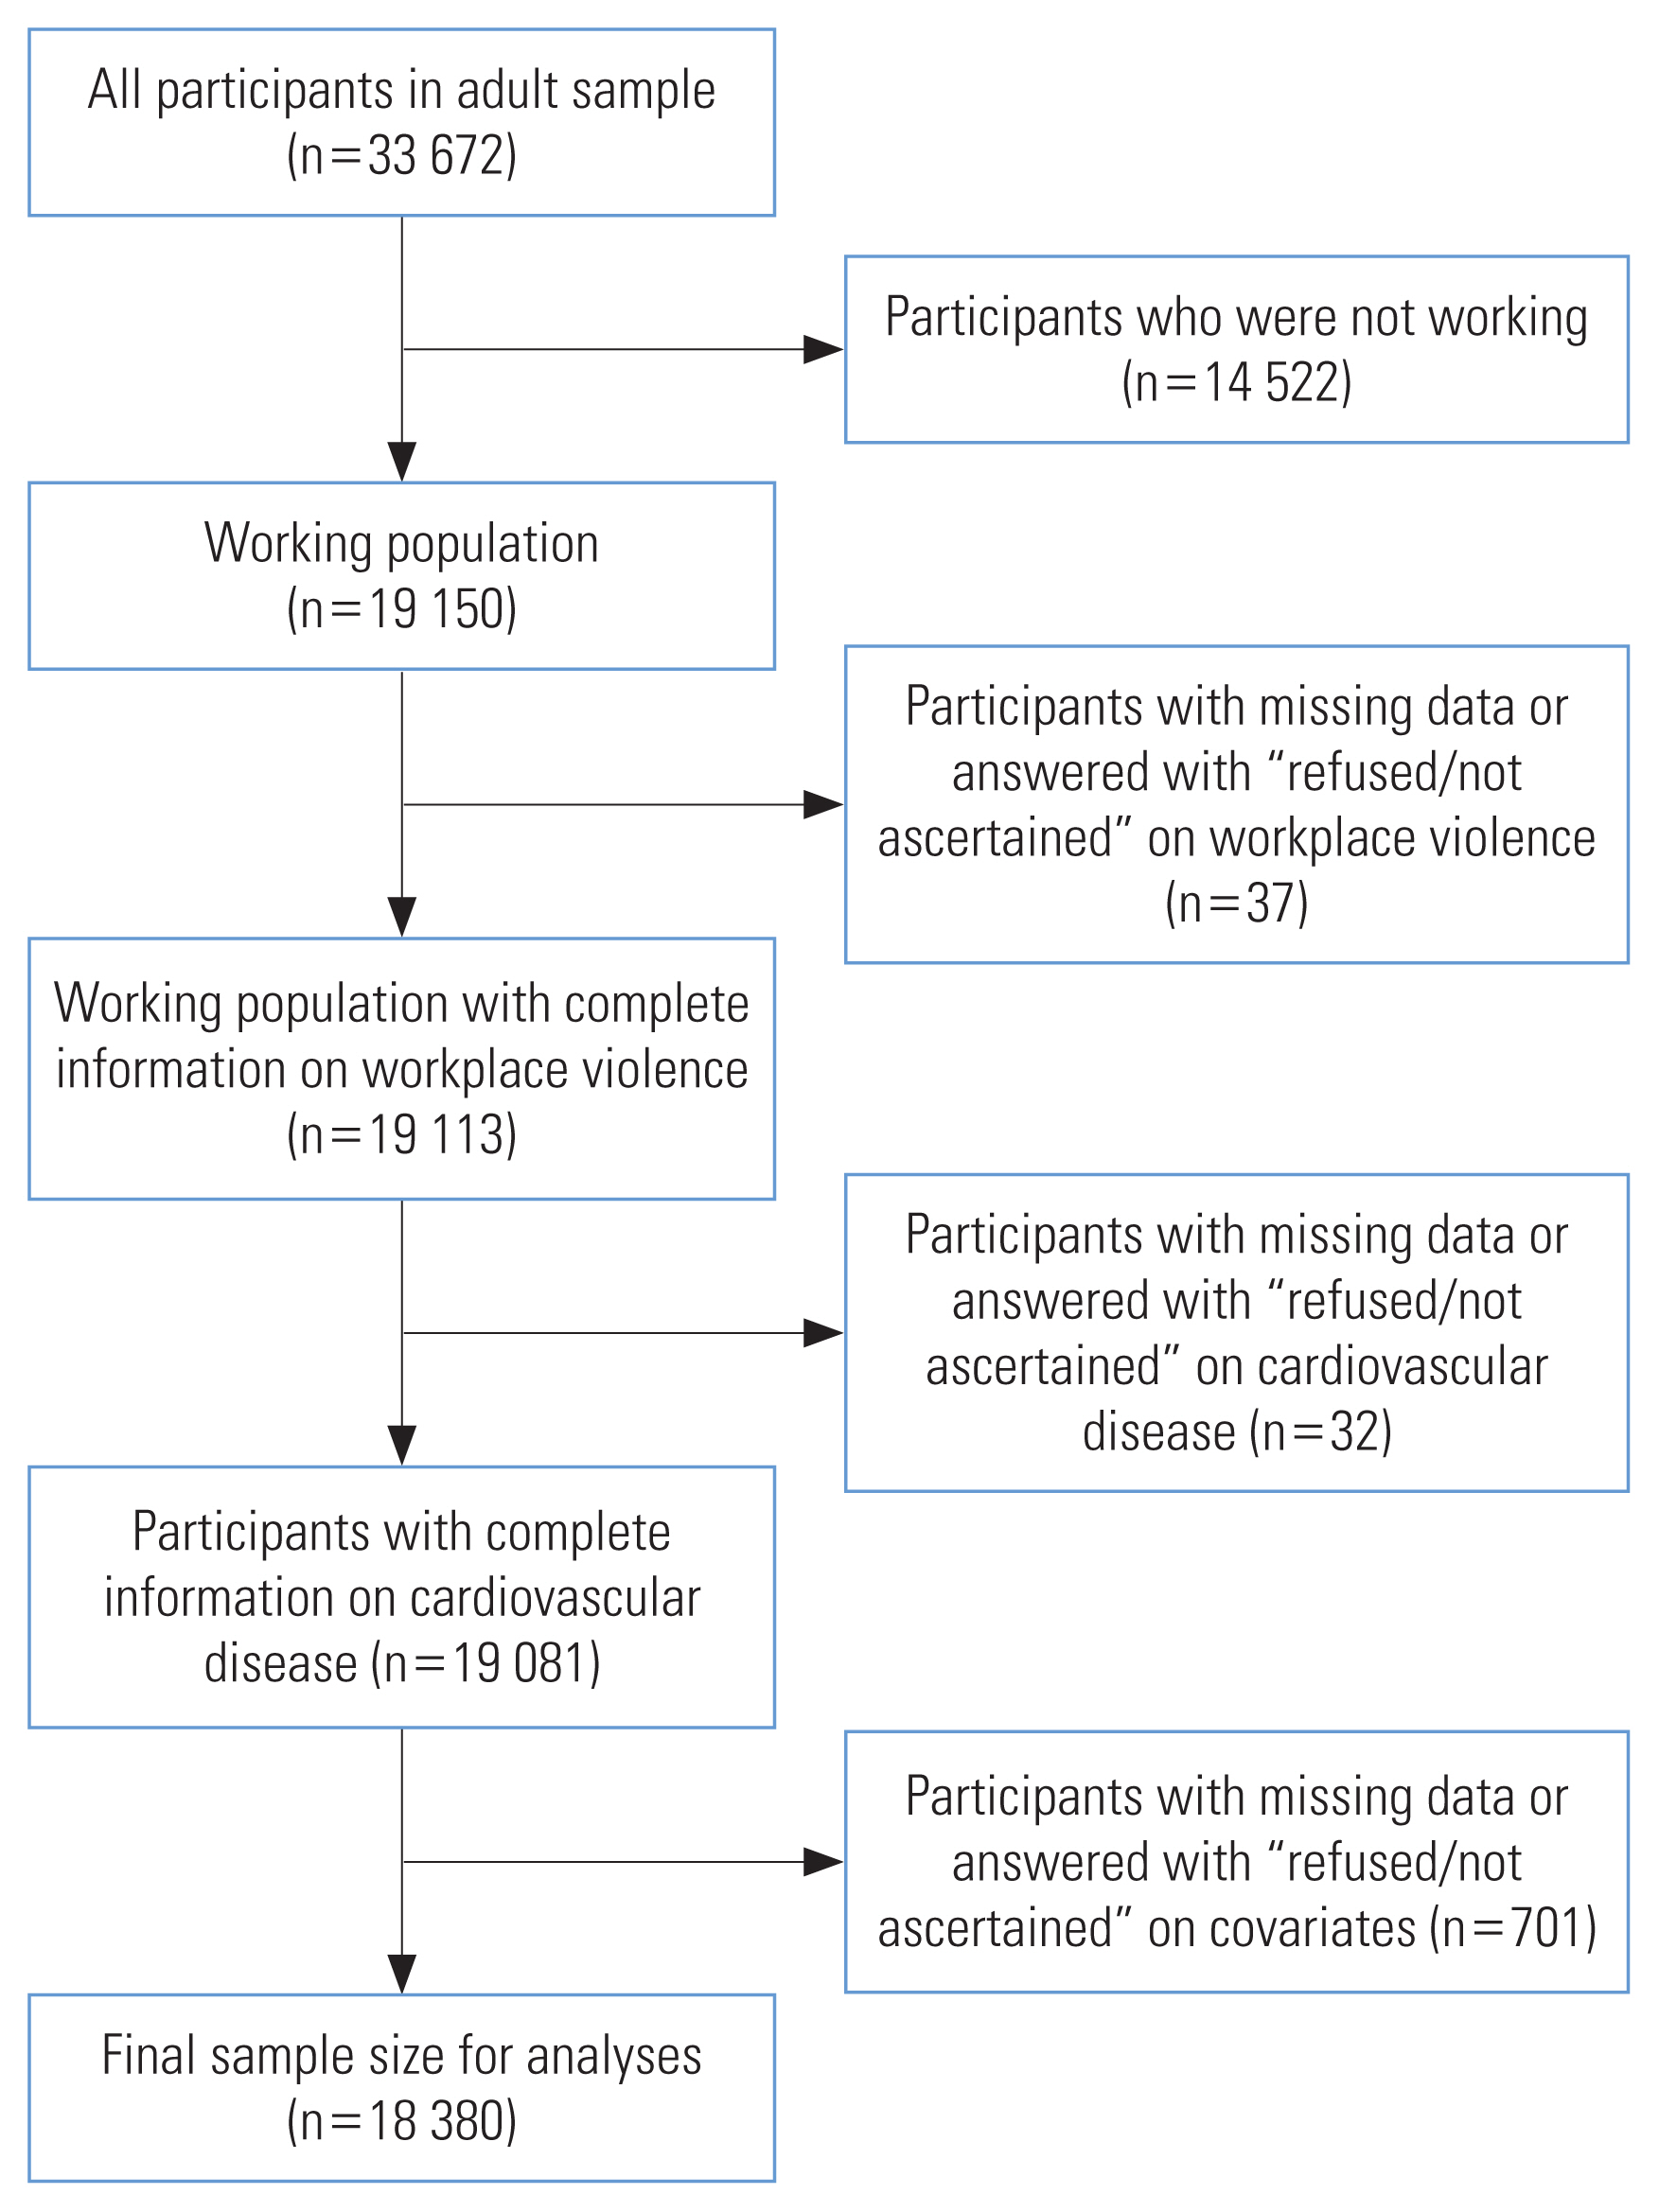
- The data for this study were extracted from the 2015 NHIS, for which face-to-face interviews were conducted with a representative sample of households nationwide [13]. The NHIS employs multistage sampling techniques to select dwelling units that represent the civilian non-institutionalized population of the United States. These multistage methods divide the target population into several nested levels of strata and clusters [14]. The response rate for the 2015 NHIS questionnaires was 70.1% [14]. The working population was defined as paid workers who were either “working at a job or business” or “with a job or business but not at work” during the week preceding the interview, as per the criteria routinely established by previous NHIS investigations [15]. Of the 33 672 adult participants, 19 150 individuals were identified as workers. Participants with missing data or those who responded with “refused/not ascertained” to questions about workplace violence (n=37), CVD (n=32), and other covariates (n=701) were subsequently excluded. Consequently, a sample size of 18 380 participants, representing 96.0% of the total working individuals in the survey, was used for our analyses (Figure 1).
- Measures
- In this study, we assessed exposure to workplace violence using the question: “During the past 12 months, were you threatened, bullied, or harassed by anyone while you were on the job?” Answer categories were “yes”, or “no”. If a participant responded with “yes,” we followed up with another question: “During the past 12 months, how often were you threatened, bullied, or harassed by anyone while you were on the job? Would you say the frequency of harassment?” The responses were categorized as either “occasional workplace violence” (responses of “once,” “a few times,” or “monthly”) or “frequent workplace violence,” which included responses of “weekly” or “daily.”
- The identification of CVD among the participants relied on their responses to inquiries about whether a doctor or another healthcare professional had ever diagnosed them with coronary heart disease, angina pectoris, heart attack, any form of heart condition or disease, or stroke. If the participant responded affirmatively to having any of the aforementioned conditions, they were then classified as a patient with CVD [15].
- We selected major demographic characteristics, health-related behaviors, and occupational characteristics as covariates. Age was treated as a continuous variable for adult NHIS participants who were over 18 years old. Participants were classified by sex as either male or female. Race/ethnicity categories included non-Hispanic White, Hispanic or Latino, non-Hispanic Black, non-Hispanic Asian, and other [16]. Education was divided into 3 groups: high school or below, some college or associate degree, and bachelor’s degree or above. United States nativity included categories of United States-born and not United States-born. Smoking status was assigned as never, former, or current. Alcohol consumption was also categorized as never, former, or current. Annual household income (in US dollars) was divided into 4 categories: less than 25 000, 25 000-54 999, 55 000 or above, and unknown. Body mass index (BMI, kg/m2) was categorized as normal (BMI <25 kg/m2), overweight (25≤BMI<30 kg/m2), or obese (BMI ≥30 kg/m2) [17]. Leisure-time physical activity was divided into 4 categories: inactive (none), insufficiently active (<150 min/wk), sufficiently active (≥150 and ≤300 min/wk), and highly active (>300 min/wk), based on United States aerobic physical activity guidelines [18]. Working hours were classified as “<35 hr/wk,” “35–54 hr/wk,” or “≥55 hr/wk” [19]. Total occupational activity was calculated by summing scores from 2 questions about the frequency of “repeated lifting, pushing, pulling, or bending” and “standing or walking.” These scores were measured using a 5-item Likert scale (0=never, 1=seldom, 2=sometimes, 3=often, and 4= always). The total occupational activity was then categorized as never (0), seldom (1 or 2), sometimes (3 or 4), often (5 or 6), or always (7 or 8) [20]. Job demand was analyzed by scoring participants’ responses to whether they were given enough time to complete their work, while job control was determined by reversing the self-assessed scores of whether the job allowed participants the freedom to make decisions. A previous study tested single-item measures of psychosocial work characteristics and found satisfactory validity [21]. Responses to the items regarding job demand and job control were “strongly agree,” “agree,” “disagree,” and “strongly disagree,” with values ranging from 1 to 4. High valued reflected high job demand and job control, respectively [22].
- Statistical Analysis
- We utilized weighting and design variables, including stratification, clustering, and oversampling of specific population subgroups, to produce valid estimates [14]. Our study incorporated these weighted analyses. Initially, we calculated the weighted characteristics of the study participants. We then determined differences according to workplace violence using the weighted t-test for continuous variables and the weighted chi-square test for categorical variables. Subsequently, we estimated the associations between workplace violence (yes vs. no) and CVD using weighted multivariable logistic regression. The results were presented as odds ratios (ORs) with 95% confidence intervals (CIs). We created multivariable models in 4 steps: building on the crude model (model I), model II was adjusted for major demographic characteristics such as age, sex, race/ethnicity, education, household income, and United States nativity. Beyond demographic characteristics, model III was further adjusted for health-related behaviors, including smoking status, alcohol consumption status, BMI, and leisure-time physical activity. Model IV was additionally adjusted for occupational characteristics such as working hours, total occupational activity, and psychosocial work factors (job demand and job control). Lastly, we analyzed the associations between the frequency of workplace violence (categorized as no, occasionally, and frequently) and CVD using the same procedure as above. All analyses were conducted using SAS version 9.4 (SAS Institute Inc., Cary, NC, USA), and the alpha level was set at 0.05.
- Ethics Statement
- The study adhered to the guidelines set forth by the Declaration of Helsinki. The Institutional Review Board of the University of California, Los Angeles (IRB#22-001879) reviewed and granted an exemption for this study.
METHODS
- Table 1 presents the weighted characteristics of the study population. The study included a total of 18 380 participants, of whom 1334 reported experiencing threats, bullying, or harassment in their workplace within the past 12 months. No significant differences were found between those who had and had not experienced workplace violence in terms of age, race/ethnicity, or level of leisure-time physical activity. A higher number of females reported instances of workplace violence than males. Participants who reported workplace violence generally had higher education levels and lower annual incomes. The proportion of participants born in the United States was higher in the group that reported workplace violence than in the group that did not. Those with experiences of workplace violence were more likely to smoke and consume alcohol. In terms of total occupational activity, the group reporting workplace violence had a higher percentage of participants engaged in jobs requiring heavy physical activity compared to the group that did not report workplace violence. Participants who reported workplace violence also had longer working hours, higher job demands, and lower job control compared to those who did not report any workplace violence.
- Table 2 displays the results of the associations between binary workplace violence and CVD. In the study sample, 1336 individuals reported having CVD. The weighted prevalence of CVD was 6.7% in the group that reported no workplace violence and 11.7% in the group that reported experiencing workplace violence. Participants who reported workplace violence were more likely to have CVD, with a crude OR of 1.85 (95% CI, 1.44 to 2.38). However, models II through IV, which included incremental adjustments, showed significant associations between workplace violence and CVD. When compared to those reporting no workplace violence, individuals who had experienced any form of workplace violence had higher odds of CVD. This was the case even after accounting for demographic characteristics, health-related behaviors, and other occupational characteristics, with a fully adjusted OR of 1.76 (95% CI, 1.35 to 2.30).
- Table 3 presents the results according to the frequency of workplace violence. In the fully adjusted model IV, those frequently exposed to workplace violence had the highest odds of CVD (OR, 1.80; 95% CI, 1.23 to 2.63). Even occasional exposure to workplace violence was associated with 74% increased odds of CVD. Further trend analysis indicated a significant trend of rising CVD prevalence correlating with an increase in the frequency of workplace violence (p for trend <0.001).
RESULTS
- CVD is the leading cause of death both in the United States and worldwide [23]. Numerous factors have been widely documented to be involved in the development of CVD. For instance, health behavior-related factors such as smoking, BMI, and alcohol consumption are well-established risk factors for CVD [24]. Cumulative evidence indicates that occupation-related factors also play critical roles in the etiology of CVD [25]. Certain specific occupational factors, including high job demand and low job control, can significantly elevate the risk of CVD [26,27]. Additional studies have highlighted the significant impact of long working hours and occupational physical activity on CVD [19,28]. Recent studies from Europe have suggested that workplace violence and bullying can have detrimental effects on employee CVD rates. Our current study discovered that United States participants who reported frequent exposure to workplace violence had an 80% higher likelihood of CVD compared to those who did not report such violence. This finding demonstrated a significant dose-response pattern. To our knowledge, this is the first study to reveal a dose-response relationship between workplace violence and CVD in United States workers, based on an analysis of nationally representative data.
- Our results indicate that the associations of workplace violence with CVD are independent of socio-demographic factors and health-related behaviors, such as age, sex, alcohol consumption, smoking, and obesity. These results align with previous findings from other studies [9,29]. Furthermore, we discovered that incorporating additional occupational factors such as working hours, total occupational activity, job demand, and job control into regression models slightly weakened the strength of the associations between workplace violence and CVD. However, these associations remained stable and robust. We also examined potential interactions between workplace violence and these occupational factors but found no significant interactions (p>0.05, data not shown).
- The mechanisms through which workplace violence impacts CVD are not entirely clear. Previous studies have suggested that both behavioral and biological pathways could provide plausible explanations [30]. Past research has shown that workplace violence and bullying can lead to negative emotions, which can directly impact CVD through the excessive release of stress hormones [31]. Frequent experiences of anxiety, sadness or depression, and anger can harm the cardiovascular system and weaken immune function [32]. These emotional states can also promote unhealthy behaviors, further contributing to the development of CVD [33]. Other research has indicated that several pathways are implicated in the biological mechanisms. These include the hypothalamic-pituitary-adrenal axis [34], the autonomic nervous system, platelet receptors, coagulopathy factors, pro-inflammatory cytokines, neurohormonal factors, and the genetic serotonin transporter mechanism [35]. These biological mechanisms may increase the burden of atherosclerotic plaque, either during or shortly after instances of workplace violence and bullying. This could lead to pathological changes associated with CVD [36]. Given the complex nature of workplace violence and bullying, the mechanisms that link these experiences to CVD likely involve multiple stress-related pathways. These pathways could serve not only as contributing factors but also as triggers that exacerbate CVD in susceptible individuals.
- Our study has several clear strengths. The data used in this study were sourced from the NHIS, a United States national survey with a large representative sample and a high response rate (over 70%) [14]. This enhanced the robustness and generalizability of our findings. Additionally, we considered several covariates identified as risk factors for CVD in our regression analyses. Our data also revealed a dose-response relationship between workplace violence and CVD. However, this study is not without limitations that warrant discussion. The primary limitation is the cross-sectional design, as opposed to a cohort design, due to the nature of the NHIS data collection. Consequently, it is not possible to infer causality from the observed associations. For example, the measure of CVD was based on whether it had ever been diagnosed, which could have occurred prior to the violence. This suggests a potential reverse association, with the disease possibly predisposing affected individuals to workplace violence. Another limitation is that the measure of workplace violence was confined to the past 12 months. This means that information on the long-term cumulative duration of exposure was absent. Furthermore, the NHIS data did not specify the source of workplace violence (e.g., supervisor or colleague), which warrants further investigation to better understand and prevent workplace violence. A third limitation is the potential for common method bias, given that both the exposure and outcome variables were self-reported. This could potentially exaggerate the relationship between workplace violence and CVD. Finally, while we were able to adjust for several potential confounders, we cannot completely rule out the possibility of unmeasured or residual confounding in our study.
- While no global statistics are available, previous studies have found a wide range of prevalence for workplace violence, largely due to varying measures of this occupational risk factor. For example, the prevalence of workplace violence was found to be 6% in Finland [7], 15% in Germany [8], 13% in Sweden and Denmark [9], and between 7% and 8% in the United States according to 2010 NHIS data [10,11], and the current study involved 2015 NHIS data. Among certain occupational groups, such as healthcare professionals, the prevalence may be even higher [37]. Notably, underreporting is a common issue in surveys on workplace violence. Considering education as an example, participants with lower education levels reported less workplace violence, which contradicts general assumptions. We suspect that these workers may experience workplace violence more frequently but choose not to report it due to high job insecurity and fear of job loss, as suggested by other studies [37]. Regarding the risk factors of workplace violence, certain characteristics, such as being female, are often cited [38]. Recently, an understanding has developed that occupational structure and organizational factors also strongly relate to workplace violence. These factors include authoritarian and laissez-faire leadership behaviors, role conflict, role ambiguity, monotonous or rotating tasks, high job demands, work pressure, and unclear job duties [38]. In statistical modeling, we accounted for demographic characteristics (including sex and education), health-related behaviors, and work-related factors such as working hours, occupational activity, job demand, and job control.
- The prevention or reduction of CVD resulting from workplace violence is an important issue in the field of occupational safety and health in the United States. Our research into the association between workplace violence and CVD underscores the importance of policy implications and early interventions in the workplace to decrease the incidence of CVD among United States workers. Several practices have been demonstrated effective related to policy implications and interventions aimed at preventing workplace violence and bullying [39,40]. These include the development of training programs for individuals, groups, and organizations, focusing on stress management, conflict resolution, and the enhancement of communication skills. However, the impact of these practices on CVD-related outcomes has not yet been documented.
- In conclusion, the findings of this study indicate an association between workplace violence and the prevalence of CVD in United States workers, following a dose-response pattern. Future research should explore the associated mechanistic pathways, conduct prospective cohort studies, and consider interventions to prevent workplace violence and lower the risk of CVD.
DISCUSSION
- The raw data from the 2015 National Health Interview Survey (NHIS) survey can be publicly accessed at: https://www.cdc.gov/nchs/nhis/nhis_2015_data_release.htm (accessed on July 18, 2022). The authors will provide the statistical SAS syntax that supports the conclusions of this article without any undue reservations. Any requests for access to the statistical SAS syntax should be directed to the corresponding author.
DATA AVAILABILITY
ACKNOWLEDGEMENTS
-
CONFLICT OF INTEREST
The authors have no conflicts of interest associated with the material presented in this paper.
-
FUNDING
None.
-
AUTHOR CONTRIBUTIONS
Conceptualization: Li J. Data curation: Hu Z, Li J. Formal analysis: Hu Z, Li J. Funding acquisition: None. Methodology: Li J. Project administration: Li J. Visualization: Hu Z. Writing – original draft: Hu Z, Li J. Writing – review & editing: Hu Z, Li J.
Notes
Values are presented as number (%) or odds ratio (95% confidence interval).
CVD, cardiovascular disease.
1 Logistic regression.
2 Model I: No adjustment; Model II: Adjusted for age, sex, education, income, and nativity; Model III: Model II+additionally adjusted for smoking, alcohol consumption, leisure-time physical activity, and body mass index; Model IV: Model III+additionally adjusted for working hours, total occupational activity, job demand, and job control.
- 1. Centers for Disease Control and Prevention. Occupational violence; [cited 2022 Dec 12]. Available from: https://www.cdc.gov/niosh/topics/violence/default.html
- 2. Occupational Safety and Health Administration. Workplace violence; [cited 2022 Dec 12]. Available from: https://www.osha.gov/workplace-violence
- 3. U.S. Bureau of Labor Statistics. Occupational injuries/illnesses and fatal injuries profiles by event or exposure, all ownerships; 2019 [cited 2022 Aug 25]. Available from: https://data.bls.gov/gqt/InitialPage
- 4. Rudkjoebing LA, Bungum AB, Flachs EM, Eller NH, Borritz M, Aust B, et al. Work-related exposure to violence or threats and risk of mental disorders and symptoms: a systematic review and meta-analysis. Scand J Work Environ Health 2020;46(4):339-349ArticlePubMedPMC
- 5. Magnavita N, Mele L, Meraglia I, Merella M, Vacca ME, Cerrina A, et al. The impact of workplace violence on headache and sleep problems in nurses. Int J Environ Res Public Health 2022;19(20):13423ArticlePubMedPMC
- 6. Russo M, Lucifora C, Pucciarelli F, Piccoli B. Work hazards and workers’ mental health: an investigation based on the fifth European Working Conditions Survey. Med Lav 2019;110(2):115-129PubMedPMC
- 7. Kivimäki M, Virtanen M, Vartia M, Elovainio M, Vahtera J, Keltikangas-Järvinen L. Workplace bullying and the risk of cardiovascular disease and depression. Occup Environ Med 2003;60(10):779-783PubMedPMC
- 8. Romero Starke K, Hegewald J, Schulz A, Garthus-Niegel S, Nübling M, Wild PS, et al. Cardiovascular health outcomes of mobbing at work: results of the population-based, five-year follow-up of the Gutenberg health study. J Occup Med Toxicol 2020;15: 15ArticlePubMedPMCPDF
- 9. Xu T, Magnusson Hanson LL, Lange T, Starkopf L, Westerlund H, Madsen IE, et al. Workplace bullying and workplace violence as risk factors for cardiovascular disease: a multi-cohort study. Eur Heart J 2019;40(14):1124-1134ArticlePubMed
- 10. Khubchandani J, Price JH. Workplace harassment and morbidity among US adults: results from the National Health Interview Survey. J Community Health 2015;40(3):555-563ArticlePubMedPDF
- 11. Kaur H, Luckhaupt SE, Li J, Alterman T, Calvert GM. Workplace psychosocial factors associated with hypertension in the U.S. workforce: a cross-sectional study based on the 2010 National Health Interview Survey. Am J Ind Med 2014;57(9):1011-1021ArticlePubMed
- 12. Centers for Disease Control and Prevention. National Health Interview Survey; [cited 2022 Dec 12]. Available from: https://www.cdc.gov/nchs/nhis/index.htm
- 13. Centers for Disease Control and Prevention. National Health Interview Survey 2015 data release; [cited 2022 Dec 12]. Available from: https://www.cdc.gov/nchs/nhis/nhis_2015_data_release.htm
- 14. Centers for Disease Control and Prevention. National Health Interview Survey: survey description 2016 [cited 2022 Dec 12]; Available from: https://nhis.ipums.org/nhis/resources/srvydesc2015.pdf
- 15. Gu JK, Charles LE, Fekedulegn D, Allison P, Ma CC, Violanti JM, et al. Temporal trends in prevalence of cardiovascular disease (CVD) and CVD risk factors among U.S. older workers: NHIS 2004–2018. Ann Epidemiol 2021;55: 78-82ArticlePubMedPMC
- 16. Hawkins D, Alenó Hernández KM. Racial and ethnic differences in the prevalence of work organization and occupational psychosocial exposures. Am J Ind Med 2022;65(7):567-575ArticlePubMedPDF
- 17. Wolf AM, Colditz GA. Current estimates of the economic cost of obesity in the United States. Obes Res 1998;6(2):97-106ArticlePubMed
- 18. Strath SJ, Kaminsky LA, Ainsworth BE, Ekelund U, Freedson PS, Gary RA, et al. Guide to the assessment of physical activity: clinical and research applications: a scientific statement from the American Heart Association. Circulation 2013;128(20):2259-2279ArticlePubMed
- 19. Pega F, Náfrádi B, Momen NC, Ujita Y, Streicher KN, Prüss-Üstün AM, et al. Global, regional, and national burdens of ischemic heart disease and stroke attributable to exposure to long working hours for 194 countries, 2000–2016: a systematic analysis from the WHO/ILO Joint Estimates of the Work-related Burden of Disease and Injury. Environ Int 2021;154: 106595ArticlePubMedPMC
- 20. Quinn TD, Yorio PL, Smith PM, Seo Y, Whitfield GP, Barone Gibbs B. Occupational physical activity and cardiovascular disease in the United States. Occup Environ Med 2021;78(10):724-730ArticlePubMed
- 21. Gilbert S, Kevin Kelloway E. Using single items to measure job stressors. Int J Workplace Health Manag 2014;7(3):186-199Article
- 22. Leung CY, Lee SJ. Depression, healthcare utilization, missed work, and health behaviors among US young workers: data from the 2015 National Health Interview Survey. J Occup Environ Med 2021;63(10):821-827PubMed
- 23. Tsao CW, Aday AW, Almarzooq ZI, Alonso A, Beaton AZ, Bittencourt MS, et al. Heart disease and stroke statistics-2022 update: a report from the American Heart Association. Circulation 2022;145(8):e153-e639ArticlePubMed
- 24. Colpani V, Baena CP, Jaspers L, van Dijk GM, Farajzadegan Z, Dhana K, et al. Lifestyle factors, cardiovascular disease and all-cause mortality in middle-aged and elderly women: a systematic review and meta-analysis. Eur J Epidemiol 2018;33(9):831-845ArticlePubMedPDF
- 25. Schnall PL, Dobson M, Landsbergis P. Globalization, work, and cardiovascular disease. Int J Health Serv 2016;46(4):656-692ArticlePubMedPDF
- 26. Li J, Landsbergis P, Sembajwe G, Descatha A, Siegrist J. Comments to Moretti Anfossi et al.’s (2022) ‘Work exposures and development of cardiovascular diseases: a systematic review’: what is current scientific consensus? Ann Work Expo Health 2022;66(6):822-824ArticlePubMedPDF
- 27. Theorell T, Jood K, Järvholm LS, Vingård E, Perk J, Östergren PO, et al. A systematic review of studies in the contributions of the work environment to ischaemic heart disease development. Eur J Public Health 2016;26(3):470-477ArticlePubMedPMC
- 28. Cillekens B, Huysmans MA, Holtermann A, van Mechelen W, Straker L, Krause N, et al. Physical activity at work may not be health enhancing. A systematic review with meta-analysis on the association between occupational physical activity and cardiovascular disease mortality covering 23 studies with 655 892 participants. Scand J Work Environ Health 2022;48(2):86-98ArticlePubMedPMC
- 29. Jacobsen DP, Nielsen MB, Einarsen S, Gjerstad J. Negative social acts and pain: evidence of a workplace bullying and 5-HTT genotype interaction. Scand J Work Environ Health 2018;44(3):283-290ArticlePubMed
- 30. Herrmann-Lingen C. Victimization in the workplace: a new target for cardiovascular prevention? Eur Heart J 2019;40(14):1135-1137ArticlePubMed
- 31. Fida R, Tramontano C, Paciello M, Guglielmetti C, Gilardi S, Probst TM, et al. ‘First, do no harm’: the role of negative emotions and moral disengagement in understanding the relationship between workplace aggression and misbehavior. Front Psychol 2018;9: 671ArticlePubMedPMC
- 32. Consedine NS, Moskowitz JT. The role of discrete emotions in health outcomes: a critical review. Appl Prev Psychol 2007;12(2):59-75Article
- 33. Ross V, Mathieu SL, Wardhani R, Gullestrup J, Kõlves K. Factors associated with workplace bullying and the mental health of construction industry apprentices: a mixed methods study. Front Psychiatry 2021;12: 629262ArticlePubMedPMC
- 34. Wentworth BA, Stein MB, Redwine LS, Xue Y, Taub PR, Clopton P, et al. Post-traumatic stress disorder: a fast track to premature cardiovascular disease? Cardiol Rev 2013;21(1):16-22PubMed
- 35. Hare DL, Toukhsati SR, Johansson P, Jaarsma T. Depression and cardiovascular disease: a clinical review. Eur Heart J 2014;35(21):1365-1372ArticlePubMed
- 36. Kivimäki M, Kawachi I. Work stress as a risk factor for cardiovascular disease. Curr Cardiol Rep 2015;17(9):630ArticlePubMedPDF
- 37. Kvas A, Seljak J. Unreported workplace violence in nursing. Int Nurs Rev 2014;61(3):344-351ArticlePubMed
- 38. Feijó FR, Gräf DD, Pearce N, Fassa AG. Risk factors for workplace bullying: a systematic review. Int J Environ Res Public Health 2019;16(11):1945ArticlePubMedPMC
- 39. Al-Ghabeesh SH, Qattom H. Workplace bullying and its preventive measures and productivity among emergency department nurses. BMC Health Serv Res 2019;19(1):445ArticlePubMedPMCPDF
- 40. Gillen PA, Sinclair M, Kernohan WG, Begley CM, Luyben AG. Interventions for prevention of bullying in the workplace. Cochrane Database Syst Rev 2017;1(1):CD009778ArticlePubMed
 PubReader
 ePub Link
 Cite
Cite

