Articles
- Page Path
- HOME > J Prev Med Public Health > Volume 54(4); 2021 > Article
-
Special Article
Network Analysis in Systems Epidemiology -
JooYong Park1
 , Jaesung Choi2, Ji-Yeob Choi1,2,3,4
 -
Journal of Preventive Medicine and Public Health 2021;54(4):259-564.
DOI: https://doi.org/10.3961/jpmph.21.190
Published online: July 7, 2021
1Department of Biomedical Sciences, Seoul National University Graduate School, Seoul, Korea
2Institute of Health Policy and Management, Seoul National University Medical Research Center, Seoul, Korea
3Cancer Research Institute, Seoul National University, Seoul, Korea
4Department of Preventive Medicine, Seoul National University College of Medicine, Seoul, Korea
- Corresponding author: Ji-Yeob Choi Department of Biomedical Sciences, Seoul National University Graduate School, 103 Daehak-ro, Jongno-gu, Seoul 03080, Korea E-mail: jiyeob.choi@gmail.com
Copyright © 2021 The Korean Society for Preventive Medicine
This is an Open Access article distributed under the terms of the Creative Commons Attribution Non-Commercial License (http://creativecommons.org/licenses/by-nc/4.0/) which permits unrestricted non-commercial use, distribution, and reproduction in any medium, provided the original work is properly cited.
ABSTRACT
- Traditional epidemiological studies have identified a number of risk factors for various diseases using regression-based methods that examine the association between an exposure and an outcome (i.e., one-to-one correspondences). One of the major limitations of this approach is the “black-box” aspect of the analysis, in the sense that this approach cannot fully explain complex relationships such as biological pathways. With high-throughput data in current epidemiology, comprehensive analyses are needed. The network approach can help to integrate multi-omics data, visualize their interactions or relationships, and make inferences in the context of biological mechanisms. This review aims to introduce network analysis for systems epidemiology, its procedures, and how to interpret its findings.
- Epidemiology contributes to the identification of risk factors for various diseases. However, conventional (traditional) analyses in epidemiology use regression, which examines the association between an exposure and an outcome as a one-to-one correspondence. This approach has a major limitation (referred to as the “black-box” nature of the analysis) in that it cannot fully explain complex relationships such as biological pathways [1-3].
- To reveal the mechanisms previously hidden in the “black box,” a new framework has emerged: systems epidemiology. Laszlo and Krippner [4] defined a “system” as “a complex of interacting components together with the relationships among them that permit the identification of a boundary-maintaining entity or process” through systems theories. “Systems epidemiology” is a concept derived from “systems biology,” which is a holistic and integrated approach to understand complex biological processes and phenotypes, and has been defined as a new integrative approach in human studies using high-throughput multi-omics data [2,5-7]. Subsequently, Dammann et al. [8] defined systems epidemiology as “an epidemiologic approach to identify risk factors including systems-level (such as omics-level) exposure measurements at multiple levels, for instance, socio-demographic, clinical, or biological levels via network analyses of interrelationships among risk factors and computational simulation of risk scenarios in parallel to data-driven biostatistical risk modeling”.
- As omics techniques have been developed, high-throughput data have become available for current epidemiological studies. Various levels of omics data include genomics, transcriptomics, proteomics, metabolomics, and microbiome data [6]. These data types have tens to hundreds of thousands of variables. However, until recently, many studies have performed simple regression-based analyses, such as by using genome-wide data or metabolomics data and then adjusting for multiple corrections. It is well known that disease does not occur independently as a result of a single factor. To conduct a comprehensive analysis in terms of systems epidemiology, an alternative approach is needed. The network approach could help to integrate multi-omics data, visualize their interactions or relationships, and make inferences in the context of biological mechanisms [9,10].
INTRODUCTION
- A network is a structural and graphical form consisting of nodes that indicate variables and edges that represent the relationships between the variables. Nodes are also referred to as vertices, and edges are also called links [11]. Edges can connote various statistical estimates such as correlation coefficients and they can show their directionality (positive or negative) as well as their magnitudes. The network structure depends on the edge threshold, such as the p-value or coefficient values, and the interpretation can also vary since nodes can only appear in the network when they are connected to an edge. Network analysis is possible only after network construction is completed.
- Correlation coefficients are commonly used to represent relationships between variables [12]. Depending on whether the data are parametric or non-parametric, researchers can choose Pearson, Spearman, or Kendall correlation coefficients. However, these methods do not adjust for confounding effects from the other variables, so spurious edges might appear. The partial correlation method can provide a coefficient in which the effects of other variables are controlled [11,13]. Thus, partial correlations are recommended as a method that can also suggest plausible potential causal relationships.
- Occasionally, a network has a tremendous number of nodes and edges. The more variables are displayed in a network, the more information will be obtained, but highly complex networks can be difficult to visualize and interpret. Thus, higher thresholds can help in some cases. A stricter threshold of the p-value (<0.05, <0.01, or lower) and coefficient values (>0.5, >0.7 or higher) can be used, or the least absolute shrinkage and selection operator (‘lasso’) can also be applied [11,13].
- To date, although numerous tools have been developed for network analysis [9,14], the most representative tools are Cytoscape (https://cytoscape.org/) and R software (https://www.r-project.org/), and many tutorials have been published [11,15-17]. R has various packages for network analysis, for instance, corr or pcor to calculate correlation coefficients [18,19] and ggraph, igraph, qgraph, or Rgraphviz to visualize networks [20-23]. Therefore, network analysis can be performed within a single platform from start to finish. Instead, Cytoscape needs an appropriate input format from a correlation matrix that can be obtained from other statistical analysis tools. A previous study [12] provided a detailed process for the input format to Cytoscape. Nevertheless, the network can be handled, edited, and annotated much more easily in Cytoscape since it is a graphical-user-interface–based program [12,15].
- Recently, some noteworthy web-based tools for network analysis centered on metabolomics data or metabolic pathways have been developed, such as the Metabolic network Analysis and Pathway Prediction Server (MAPPS) and the integrated Metabolomics Analysis Platform (iMAP). MAPPS provides various analytical resources including pathway prediction based on public databases, metabolic reachability, metabolite-specific reactions, network building and comparison [24]. iMAP also provides functions for network construction, visualization, and analysis with a user-friendly interface [25]. Although both tools focus primarily on metabolite data, these tools allow users to analyze omics data with additional transcriptomics or proteomics data sets. However, the papers presenting those tools still describe the use of Cytoscape for topological analysis or more personalized modifications [24,25].
NETWORK STRUCTURE, VISUALIZATION, AND ANALYSIS
- Once network visualization is complete, basic inferences are possible based on the graphical structure and relationships between the variables. Although some clusters with relatively many nodes gathered together or overall structural characteristics (e.g., density or sparseness) can be observed, these do not provide an in-depth interpretation of the relationships between variables.
- Interpretation of the network is possible through various parameters that can be obtained by network analysis. Some representative parameters are degree and betweenness, which have been defined in greater depth elsewhere [11]. In brief, the degree is defined as the number of edges that connect to a node. Therefore, this parameter denotes the centrality of a node and the level of involvement of a node in the network. The nodes with the highest degrees can be interpreted as “hub” nodes that play central roles in the relationships being analyzed. Betweenness is defined as the average path between other pairs of nodes and quantifies the importance of a node. When a node lies on the shortest path between two other nodes, it means that those connections are more important than other connections. Thus, a higher value of the betweenness parameter indicates that a node plays a key role in the network. It is not always the case that the node with the highest degree has the highest betweenness. Therefore, researchers usually sort by degree and then find the highest betweenness or vice versa [12].
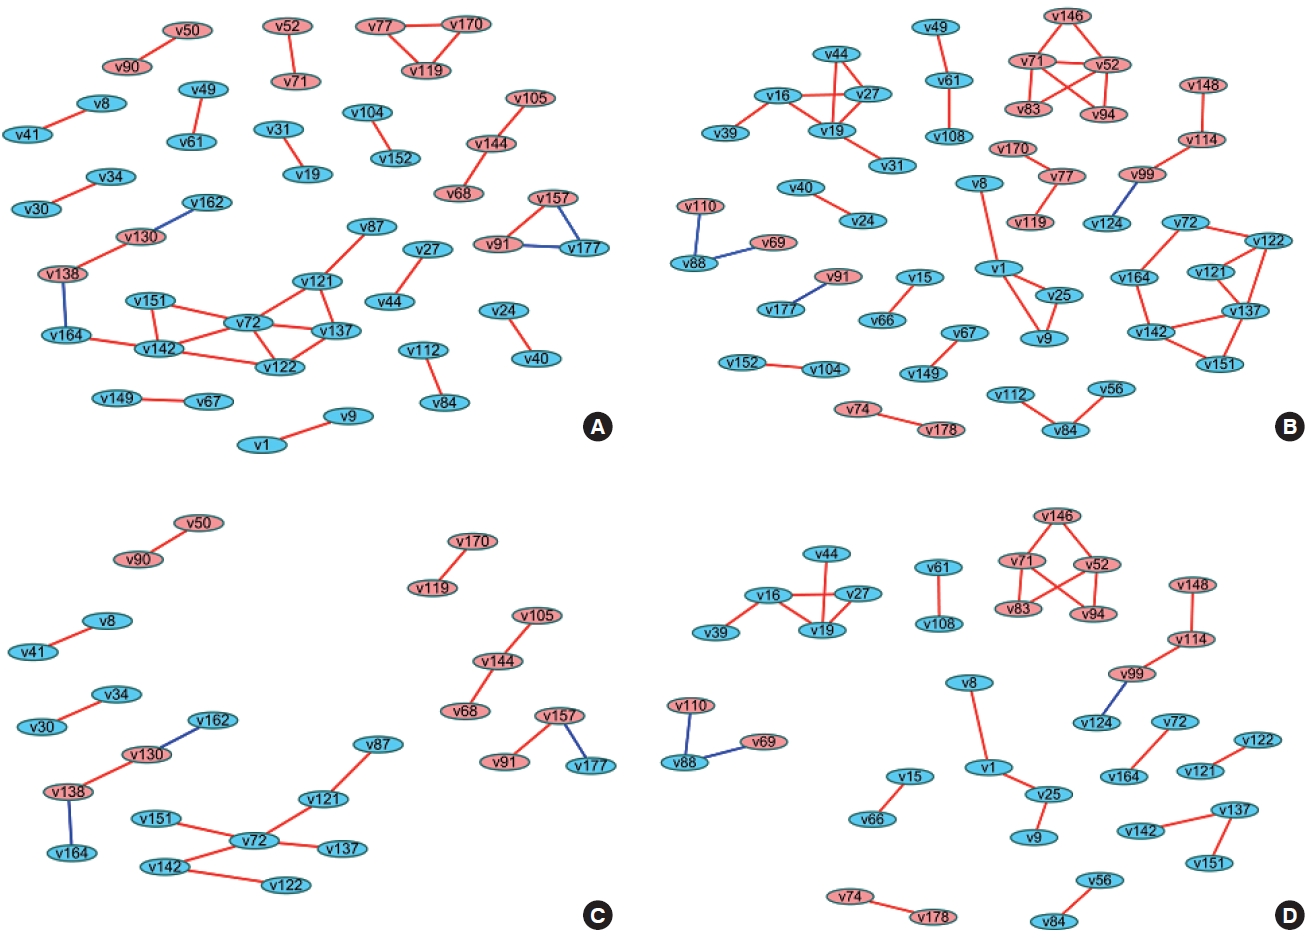
- When differences are examined between 2 or more groups, networks can be constructed for each group and then compared (Figure 1). The first method uses Cytoscape, which provides a topological comparison. After calculating the correlation matrix in each group to be compared, each network should be constructed in Cytoscape (Figure 1A and B). Then, using “merge” in “Tools,” 2 networks can be combined into 1 network using various options. When users select the “difference” option, a new network is created after excluding overlapping edges and nodes between two networks. By designating a reference network, each network has unique edges and nodes in that group (Figure 1C and D). In this way, a structural interpretation is possible based on the unique relationships in each network [12].
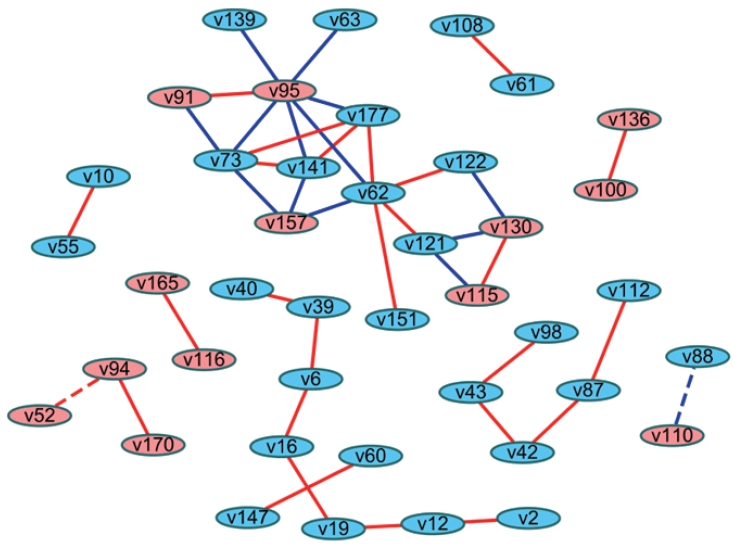
- Another method involves analyzing the statistical difference of correlation coefficients (i.e., differential correlations). Fukushima [26] introduced the method of calculating differential correlations using the DiffCorr package in R. In brief, differential correlation coefficients and p-values can be calculated based on the Fisher z-test between 2 correlation matrices after Fisher transformation of the coefficients. Users can proceed with visualizing the network in R, or they can import this data frame to Cytoscape to construct a network that presents the differential correlations between 2 groups. This network can be interpreted as indicating links with significantly different relationships between groups (Figure 2).
INTERPRETATION OF NETWORK ANALYSIS
- The methods described above have been practically applied in several studies, and diverse interpretations have been made according to the network visualization method. For example, Batushansky et al. [12] aimed to reveal metabolic differences between normal conditions and hypoxic conditions in breast carcinoma cell lines. Two networks based on the correlation coefficients of metabolites were constructed, and they used the “merge” tool in Cytoscape to make unique networks under normal conditions and hypoxic conditions. The authors suggested potentially important metabolites in each network via parameters such as degree and betweenness that were obtained from NetworkAnalyzer in Cytoscape. This study interpreted the results as indicating that hypoxic conditions involved more metabolic paths in cell metabolism because there were more unique edges in the unique network of hypoxic conditions than in the network of normal conditions, and a possible explanation for the different mechanisms related to the higher degree and betweenness of lactate, gamma-aminobutyric acid, alanine, and creatinine in each network [12].
- The difference in the networks between 2 groups can also be examined by differential correlations as a statistical approach [26], while the “merge” tool in Cytoscape is a topological comparison as described above. Using the differential correlation method, Li et al. [27] demonstrated differences in metabolite networks between men and women, Wang et al. [28] revealed differences in metabolite networks between age groups (<50 and ≥50 years old) in men and women, and Costello et al. [29] found novel metabolites that showed differences between 2 phenotypes regarding joint replacement. These studies represented edges as colors where the differential correlations were positive or negative. In these cases, the original relationships between variables (negative or positive correlations) are unknown. Alternatives would be using both colors (red and blue) and shapes (solid and dotted) to reflect not only original relationships (e.g., the direction of correlation coefficients) between nodes, but also which group had stronger relationships (e.g., the direction of the differential correlation). The magnitude of the coefficients can also be shown as the width of edges.
- Multiple networks according to thresholds such as p-values or coefficients can be constructed to zoom in and focus on stronger relationships between variables in the network. Huang et al. [30] constructed networks based on differential correlations between type 2 diabetes patients and a control group using 27 biomarkers related to type 2 diabetes. By comparing 3 different networks according to the thresholds (the magnitude of coefficients and p-value), the authors found that leptin was strongly linked to adiponectin and insulin-like growth factor binding protein 2, and that leptin played a central role in diabetes development.
- The network embodies diverse information, mainly by edges such as color, shape, and width as described above. However, nodes can also represent statistical estimates as color or shape. Floegel et al. [31] constructed a network that showed relationships between metabolites. The authors colored in nodes to indicate associations between metabolites and various lifestyle factors, including diet, physical activity, and obesity. With this approach, the network contains information not only about relationships among nodes, but also associations between nodes and other factors such as exposures or outcomes of interest.
NETWORK ANALYSIS EXAMPLES
- Taken together, network analysis is advantageous in that it can show the relationships among multiple variables in an integrated approach. In addition, clusters composed of variables can be identified through the visual structure, and variables that play an important role in the network can be found from parameters obtained through network analysis. Through this process, a potential mechanism can be suggested, and, therefore, further research (or experiments) focusing on a specific factor or pathway can be proposed.
- However, there are also points meriting caution in network analysis. Depending on the data transformation method and the edge presentation method (correlations, partial correlations, or differential correlations), the structure of the final network will be different, which can lead to a loss of information and thus misinterpretation. Moreover, the network can be used to propose a potential mechanism, but not to establish it.
- To date, most studies using network analysis have been conducted at a single layer (e.g., metabolomics, genomics, or blood biomarkers). This tendency may be due to the difficulties in finding ideal statistical methods to merge omics data, which have different properties in terms of normality or scale. Nevertheless, attempts should be made to integrate and analyze multi-omics data through the development of suitable statistical methods in order for systems epidemiology to reach its considerable potential.
- Ethics Statement
- This paper is a special article based on literature review, so it did not need ethical approval.
CONCLUSION
-
CONFLICT OF INTEREST
The authors have no conflicts of interest associated with the material presented in this paper.
-
FUNDING
This study was supported by a National Research Foundation of Korea grant funded by the Korean government (NRF2018R1A2A3075397) and by a grant of the Korea Health Technology R&D Project through the Korea Health Industry Development Institute (KHIDI), funded by the Ministry of Health & Welfare, Republic of Korea (HI19C1178).
Notes
ACKNOWLEDGEMENTS
-
AUTHOR CONTRIBUTIONS
Conceptualization: JYP, JC, JYC. Funding acquisition: JYC. Writing – original draft: JYP. Writing – review & editing: JC, JYC.
Notes

- 1. Susser M, Susser E. Choosing a future for epidemiology: II. From black box to Chinese boxes and eco-epidemiology. Am J Public Health 1996;86(5):674-677ArticlePubMedPMC
- 2. Hu FB. Metabolic profiling of diabetes: from black-box epidemiology to systems epidemiology. Clin Chem 2011;57(9):1224-1226ArticlePubMed
- 3. Weed DL. Beyond black box epidemiology. Am J Public Health 1998;88(1):12-14ArticlePubMedPMC
- 4. Laszlo A, Krippner S. Chapter 3: systems theories: their origins, foundations, and development. In: Jordan JS, editor. Systems theories and a priori aspects of perception. Amsterdam: Elsevier; 1998. p. 47-74
- 5. Lund E, Dumeaux V. Systems epidemiology in cancer. Cancer Epidemiol Biomarkers Prev 2008;17(11):2954-2957ArticlePubMedPDF
- 6. Haring R, Wallaschofski H. Diving through the “-omics”: the case for deep phenotyping and systems epidemiology. OMICS 2012;16(5):231-234ArticlePubMedPMC
- 7. Cornelis MC, Hu FB. Systems epidemiology: a new direction in nutrition and metabolic disease research. Curr Nutr Rep 2013;2(4):10. 1007/s13668-013-0052-4ArticlePMC
- 8. Dammann O, Gray P, Gressens P, Wolkenhauer O, Leviton A. Systems epidemiology: what’s in a name? Online J Public Health Inform 2014;6(3):e198ArticlePubMedPMC
- 9. Yan J, Risacher SL, Shen L, Saykin AJ. Network approaches to systems biology analysis of complex disease: integrative methods for multi-omics data. Brief Bioinform 2018;19(6):1370-1381ArticlePubMed
- 10. Barabási AL, Gulbahce N, Loscalzo J. Network medicine: a network-based approach to human disease. Nat Rev Genet 2011;12(1):56-68ArticlePubMedPMC
- 11. Hevey D. Network analysis: a brief overview and tutorial. Health Psychol Behav Med 2018;6(1):301-328ArticlePubMedPMC
- 12. Batushansky A, Toubiana D, Fait A. Correlation-based network generation, visualization, and analysis as a powerful tool in biological studies: a case study in cancer cell metabolism. Biomed Res Int 2016;2016: 8313272ArticlePubMedPMC
- 13. Epskamp S, Fried EI. A tutorial on regularized partial correlation networks. Psychol Methods 2018;23(4):617-634ArticlePubMed
- 14. Perez De Souza L, Alseekh S, Brotman Y, Fernie AR. Networkbased strategies in metabolomics data analysis and interpretation: from molecular networking to biological interpretation. Expert Rev Proteomics 2020;17(4):243-255ArticlePubMed
- 15. Kohl M, Wiese S, Warscheid B. Cytoscape: software for visualization and analysis of biological networks. Methods Mol Biol 2011;696: 291-303ArticlePubMed
- 16. Kolaczyk ED, Csárdi G. Statistical analysis of network data with R. New York: Springer; 2014. p. 29-41
- 17. Epskamp S, Borsboom D, Fried EI. Estimating psychological networks and their accuracy: a tutorial paper. Behav Res Methods 2018;50(1):195-212ArticlePubMed
- 18. Langfelder P, Horvath S. Fast R functions for robust correlations and hierarchical clustering. J Stat Softw 2012;46(11):i11ArticlePubMedPMC
- 19. Kim S. ppcor: an R package for a fast calculation to semi-partial correlation coefficients. Commun Stat Appl Methods 2015;22(6):665-674ArticlePubMedPMC
- 20. Pedersen TL. Package ‘ggraph’. 2021 [cited 2021 Jul 1]. Available from: https://mirror.uned.ac.cr/cran/web/packages/ggraph/ggraph.pdf
- 21. Csardi G. Package ‘igraph’. 2015 [cited 2021 Jul 1]. Available from: https://cran.microsoft.com/snapshot/2017-05-27/web/packages/igraph/igraph.pdf
- 22. Epskamp S, Cramer AO, Waldorp LJ, Schmittmann VD, Borsboom D. qgraph: network visualizations of relationships in psychometric data. J Stat Softw 2012;48(4):1-18Article
- 23. Gentry J, Gentleman R, Huber W. How to plot a graph using Rgraphviz. 2021 [cited 2021 May 1]. Available from: http://www.bioconductor.org/packages/release/bioc/vignettes/Rgraphviz/inst/doc/Rgraphviz.pdf
- 24. Riaz MR, Preston GM, Mithani A. MAPPS: a web-based tool for metabolic pathway prediction and network analysis in the postgenomic era. ACS Synth Biol 2020;9(5):1069-1082ArticlePubMed
- 25. Zhou D, Zhu W, Sun T, Wang Y, Chi Y, Chen T, et al. iMAP: a web server for metabolomics data integrative analysis. Front Chem 2021;9: 659656ArticlePubMedPMC
- 26. Fukushima A. DiffCorr: an R package to analyze and visualize differential correlations in biological networks. Gene 2013;518(1):209-214ArticlePubMed
- 27. Li Z, Zhang Y, Hu T, Likhodii S, Sun G, Zhai G, et al. Differential metabolomics analysis allows characterization of diversity of metabolite networks between males and females. PLoS One 2018;13(11):e0207775ArticlePubMedPMC
- 28. Wang Y, Wang G, Jing RN, Hu T, Likhodii S, Sun G, et al. Metabolomics analysis of human plasma metabolites reveals the age-and sex-specific associations. Liq Chromatogr Relat Technol 2020;43(5-6):185-194Article
- 29. Costello CA, Hu T, Liu M, Zhang W, Furey A, Fan Z, et al. Differential correlation network analysis identified novel metabolomics signatures for non-responders to total joint replacement in primary osteoarthritis patients. Metabolomics 2020;16(5):61ArticlePubMedPMC
- 30. Huang T, Glass K, Zeleznik OA, Kang JH, Ivey KL, Sonawane AR, et al. A network analysis of biomarkers for type 2 diabetes. Diabetes 2019;68(2):281-290ArticlePubMed
- 31. Floegel A, Wientzek A, Bachlechner U, Jacobs S, Drogan D, Prehn C, et al. Linking diet, physical activity, cardiorespiratory fitness and obesity to serum metabolite networks: findings from a population-based study. Int J Obes (Lond) 2014;38(11):1388-1396ArticlePubMedPMC
REFERENCES
Figure & Data
References
Citations
- A blueprint for a new commercial driving epidemiology: An emerging paradigm grounded in integrative exposome and network epistemologies
Yorghos Apostolopoulos, Sevil Sönmez, Matthew S. Thiese, Mubo Olufemi, Lazaros K. Gallos
American Journal of Industrial Medicine.2024;[Epub] CrossRef - A network analysis of nutritional markers and maternal perinatal mental health in the French EDEN cohort
Bethany Knox, Cédric Galera, Anne-Laure Sutter-Dallay, Barbara Heude, Blandine de Lauzon-Guillain, Judith van der Waerden
BMC Pregnancy and Childbirth.2023;[Epub] CrossRef - Applying the exposome concept to working life health
Anjoeka Pronk, Miranda Loh, Eelco Kuijpers, Maria Albin, Jenny Selander, Lode Godderis, Manosij Ghosh, Roel Vermeulen, Susan Peters, Ingrid Sivesind Mehlum, Michelle C. Turner, Vivi Schlünssen, Marcel Goldberg, Manolis Kogevinas, Barbara N. Harding, Svetl
Environmental Epidemiology.2022; 6(2): e185. CrossRef - Reconstruction of the Temporal Correlation Network of All-Cause Mortality Fluctuation across Italian Regions: The Importance of Temperature and Among-Nodes Flux
Guido Gigante, Alessandro Giuliani
Entropy.2022; 25(1): 21. CrossRef - Network Analysis of Demographics, Dietary Intake, and Comorbidity Interactions
Tung Hoang, Jeonghee Lee, Jeongseon Kim
Nutrients.2021; 13(10): 3563. CrossRef
 PubReader
 ePub Link
 Cite
Cite