Epstein-Barr Virus and Gastric Cancer Risk: A Meta-analysis With Meta-regression of Case-control Studies
Article information

Abstract
Objectives:
Research on how the risk of gastric cancer increases with Epstein-Barr virus (EBV) infection is lacking. In a systematic review that investigated studies published until September 2014, the authors did not calculate the summary odds ratio (SOR) due to heterogeneity across studies. Therefore, we include here additional studies published until October 2015 and conduct a meta-analysis with meta-regression that controls for the heterogeneity among studies.
Methods:
Using the studies selected in the previously published systematic review, we formulated lists of references, cited articles, and related articles provided by PubMed. From the lists, only case-control studies that detected EBV in tissue samples were selected. In order to control for the heterogeneity among studies, subgroup analysis and meta-regression were performed.
Results:
In the 33 case-control results with adjacent non-cancer tissue, the total number of test samples in the case and control groups was 5280 and 4962, respectively. In the 14 case-control results with normal tissue, the total number of test samples in case and control groups was 1393 and 945, respectively. Upon meta-regression, the type of control tissue was found to be a statistically significant variable with regard to heterogeneity. When the control tissue was normal tissue of healthy individuals, the SOR was 3.41 (95% CI, 1.78 to 6.51; I-squared, 65.5%).
Conclusions:
The results of the present study support the argument that EBV infection increases the risk of gastric cancer. In the future, age-matched and sex-matched case-control studies should be conducted.
INTRODUCTION
Globally, gastric cancer is the primary cancer that has the third highest mortality rate [1]. Gastric cancer is the second most common cancer in Koreans [2] as well, and it is considered to be caused by a complex association between various environmental and genetic factors [3,4]. In particular, understanding Epstein-Barr virus (EBV)-associated gastric cancer (EBVaGC), along with Helicobacter pylori, is important in prevention and management of gastric cancer [5-7].
EBV is ‘the first human tumor virus’ [8] and is currently categorized as a group-1 carcinogen due to its association with various cancers, such as nasopharyngeal carcinoma [9,10]. Starting with the study of Burke et al. [11] in 1990 that reported the discovery of EBV DNA in gastric cancer tissue, evidence supporting the fact that EBV is a risk factor for gastric cancer has been accumulating [12]. Accordingly, “the Cancer Genome Atlas Research Network” [13] suggested a subtype called ‘gastric cancer positive for EBV’ in 2014.
The mechanism through which EBV causes gastric cancer is being established [13-15]; moreover, various systematic reviews on the detection rate of EBV in gastric cancer tissue [3,16-18] and the prognosis of gastric cancer according to EBV infection [19-21] have been published. However, in order to prove that a certain virus causes cancer, case-control studies are required [22]. Chen et al. [7] provided a comprehensive summary of case-control studies published until September 14, 2014. However, the authors did not perform a meta-analysis to calculate the summary odds ratio (SOR) and 95% confidence interval (CI) due to heterogeneity among studies.
The SOR corresponds to the ‘strength of association,’ which is a standard for causality judgment, and it is also a fundamental statistical value in investigation of the gastric cancer risk associated with EBV infection. In a meta-analysis in which the SOR is calculated, a random effects model, subgroup analysis, and meta-regression are applied in order to control for heterogeneity [23-25]. Through this study, we aim to calculate the SOR of gastric cancer risk according to EBV infection, by applying a meta-analysis with meta-regression, which controls for heterogeneity, on previous systematic review results.
METHODS
Related Literature Search and Selection
The systematic review of Chen et al. [7] on EBV and gastric cancer encompassed studies published until September 14, 2014, and did not conduct a meta-analysis. Thus we decided to include studies that were published until October 2015. Since the list of studies was already well-established, a hand search strategy, rather than an electronic search strategy, was employed [26-28]. In other words, references provided by Chen et al. [7] were analyzed, and lists of “cited articles” and “similar articles” provided by PubMed (www.ncbi.nlm.nih.gov/pubmed) for each article were also considered for inclusion.
In selecting studies for analysis, studies that conducted serologic tests on blood samples were excluded even though they were included in Chen et al. [7]. The reason is that EBVaGC is defined as a cancer in which EBV is detected in gastric cancer tissues [6,18]. Therefore, only case-control studies that used tissue as testing samples were included in the study. These comparative studies were divided into those using adjacent noncancer tissue (ANT) as the control tissue and those using normal tissue (NT). For final selection, the following three exclusion criteria were first applied based on the titles and abstracts of the studies: experimental studies, expert reviews or systematic reviews, and case series studies. For the remaining case-control studies, the following four exclusion criteria were additionally applied: when no information on EBV detection was provided, when no subject in the patient and control groups was positive for EBV, when blood samples were used instead of tissue samples, and when duplicate samples were reported. Studies were considered to be duplicated when the authors’ affiliations, their names, and the sources of cases were identical, and studies with higher numbers of samples were selected among the duplicate studies. The remaining case-control studies after the application of the seven aforementioned exclusion criteria were selected as the final studies for investigation.
Statistical Analysis
Application of exclusion criteria and investigation of EBV-related information—the number of tests and the number of positive diagnoses of EBV in each of the case and control groups, nationality of subjects, analysis method, and type of control tissue—were performed by two researchers. Using the number of positive and negative diagnoses of EBV in each case and control group, the odds ratio (OR) and 95% CI were calculated for each study. Studies were categorized into four regions: Far East Asia, Middle East Asia, Europe, and the Americas. The analysis methods of the studies were divided into in situ hybridization (ISH) and polymerase chain reaction (PCR); moreover, the type of control tissue was divided into ANT and NT. Based on the two analysis methods and the two types of control tissue, studies were classified into four categories. In addition, studies were divided into pre-1999 and post-2000 groups based on year of publication. Heterogeneity among studies was assessed in a meta-analysis based on I-squared values (%), and the SOR and 95% CI according to random effects models were calculated first. Among four variables—geographical area, analysis method, type of control tissue, and year of publication—that resulted in heterogeneity across studies, a meta-regression analysis was conducted using the restricted maximum likelihood method [24]. In order to examine publication bias, Egger’s test for small-study effects was conducted [25]. The level of statistical significance was set at 5%, and Stata version 14 (StataCorp, College Station, TX, USA) was used for statistical analyses.
RESULTS
Figure 1 shows the flow chart of article selection for final analysis. A list of 48 references from the selected studies in the systematic review of Chen et al. [7], and of 324 cited or related articles from PubMed, was compiled. When the selection criteria were applied to these 372 studies, 50 case-control studies were selected. Among these 50 studies, (1) one study that did not provide the EBV detection rate [29], (2) one study in which EBV was not detected in both patient and control groups [30], (3) three studies that used blood samples instead of tissue samples [31-33], and (4) six studies that used duplicate samples [34-39] were excluded. Specifically, Imai et al. [40] was selected instead of Tokunaga et al. [34], and Galetsky et al. [41] instead of 35. Gurtsevich et al. [35]. Ishii et al. [42] was selected instead of Yanai et al. [36], and Wang et al. [43] instead of Luo et al. [37]. Moreover, among the three studies by Saxena et al. [44], Shukla et al. [38,39], Saxena et al. [44] was selected, as it had the highest number of samples.
Flow chart of article selection.
Through the aforementioned exclusion process, a total of 39 studies were selected for meta-analysis [38,40-77]. Among the 39 studies, a paper published in 2014 by de Souza et al. [76], which was not included in Chen et al. [7], was added to the present study based on our hand search. Table 1 shows the nationality of subjects and EBV sample test results in the final 39 case-control studies. In the 33 case-control results with ANT, the total number of test samples in the case and control groups was 5280 and 4962, respectively. Meanwhile, in the 14 case-control results with NT, the total number of test samples in the case and control groups was 1393 and 945, respectively. When a meta-analysis with a random effects model was applied to these 39 case-control studies, the risk of gastric cancer (SOR) according to positive detection of EBV exhibited a 10. The 10-fold increase (95% CI, 5.89 to 17.29; I-squared, 65.3%) (Table 2). When sorted by region, there were twenty studies in Far East Asia, four studies in Middle East Asia, six studies in Europe, and nine studies in the Americas, with the highest risk of gastric cancer associated with EBV infection in Far East Asia (SOR, 14.28; 95% CI, 6.58 to 30.98; I-squared, 63.5%), and no statistically significant risk found in Europe (SOR, 6.09; 95% CI, 0.66 to 56.58; I-squared, 73.8%) (Figure 2). The SOR did not differ significantly between the two groups of publication periods. Although the I-squared value decreased to 40.4% in studies published after 2000, a small-study effect was still present as the p-value of Egger’s test was 0.019.
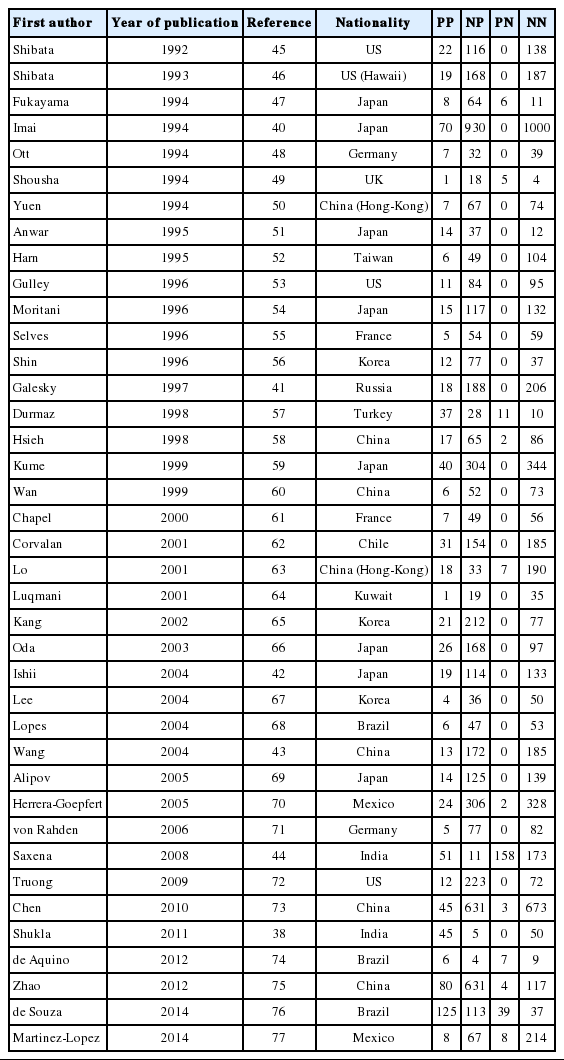
Summary of the 39 selected case-control studies with detection of EBV infection

Sub-group analyses and sensitivity analyses by type of tissue and global area
A forest plot of the summary effect size (ES = odds ratio) using a random effects model by geographical area in 39 casecontrol studies.
Upon classification of the 39 studies according to type of control tissue and analysis method, 47 datasets were formulated because some studies used two types of control tissue or two kinds of analysis method (Figure 3). There were 31 ISH datasets and 16 PCR datasets based on the analysis method, and there were 33 ANT datasets and 14 NT datasets based on type of control tissue. The SOR of each of the two analysis methods and the two types of control tissue showed statistical significance, and the lowest level of risk was observed in the NT group (SOR, 3.41; 95% CI, 1.78 to 6.51; I-squared, 65.5%) (Table 2). Moreover, in Egger’s test, no small-study effect was observed in the PCR and NT groups. When analysis methods and types of control tissues were analyzed simultaneously, nine datasets in which PCR was conducted on NT control tissues still had a statistically significant SOR (SOR, 3.72; 95% CI, 1.85 to 7.48; I-squared, 58.6%).
The forest plot of summary effect size (ES = odds ratio) using a random effect model by types of control tissues and analysis methods in 47 datasets. ANT, adjacent normal stomach tissue away from tumor; ISH, in situ hybridization; NT; normal tissue; PCR, polymerase chain reaction.
As I-squared values over 50% were observed in subgroup analysis by geographical area, analysis method, type of control tissue, and year of publication (Table 2), a meta-regression analysis was conducted on these four variables. In the meta-regression analysis of the 47 datasets, type of control tissue (p=0.002) was found to be the variable that produced heterogeneity among studies, while the adjusted R-squared in the between-study variance was 17.89% (Table 3).
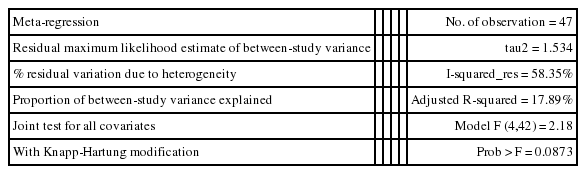
Results of meta-regression
Discussion
Based on the results of a meta-regression analysis showing that heterogeneity stemmed from type of control tissue, ANT and NT should be interpreted separately. However, if we also consider the results of Egger’s test, which showed that a small-study effect was present in ANT, but not in NT, the SOR calculated from the 14 studies that used NT can be seen as a summary statistic that overcame heterogeneity. Therefore, we can conclude that the risk (SOR) of gastric cancer associated with EBV infection, which was 3.41 (95% CI, 1.78 to 6.51; I-squared, 65.5%), was statistically significant.
Although ISH is the gold standard test used to detect EBV infection [6], the SOR of the five studies that conducted ISH on NT samples did not possess statistical significance (SOR, 2.56; 95% CI, 0.79 to 8.33; I-squared, 34.1%); in contrast, the SOR of the nine studies that conducted PCR on NT samples showed statistical significance (SOR, 3.72; 95% CI, 1.85 to 7.48; I-squared, 58.6%). Since the confidence interval is wider in the NT & ISH group, the level of accuracy in the detection method by the sampling period should be taken into consideration.
The risk of gastric cancer showed regional variation in this study, and the highest risk was observed in Far East Asia, which has a high incidence of gastric cancer. Such a result also supports the causality of the connection we found since there is a positive correlation between the incidence and level of risk. However, our result contradicts that of Lee et al. [18], who reported that EBV infection is not associated with the incidence of gastric cancer in Asians upon the analysis of 48 ISH studies published up to December 2007 (SOR, 0.698; 95% CI, 0.46 to 1.05). However, several case series studies were included in the investigation of Lee et al. [18], and we found calculation errors in several OR values in that study; therefore, due to these errors in Lee et al., it is difficult to interpret our results in comparison to those of Lee et al. In addition, although Murphy et al. [3] reported that the prevalence of EBV-positive gastric cancer did not differ according to geographical region, the study of Murphy et al. was focused on prevalence, so it was of limited value in a comparison to our findings.
In this systematic review, a hand search, rather than electronic search, was prioritized because an existing reference list from the systematic review of Chen et al. [7] published without a meta-analysis was used to identify the bulk of the studies we analyzed. We extended the search to include studies published through October 2015, and thus included an additional study not in the existing systematic review—that of de Souza et al. [76], which was published on October 15, 2014. In contrast, no additional study published until September 2014 was included, and we were able to confirm that the study of Chen et al. [7] was indeed ‘the first comprehensive systematic review’ of this subject. The list of 39 studies selected in the present study should play an important role in an updated meta-analysis in near future.
Limitations of the present study include the fact that regional differences cannot be interpreted as ethnic differences [53] since immigrants could have been included in classifications according to nationality [46,62]. Therefore, future studies on genetic sensitivity by ethnicity should be conducted. Second, the present study could not take into consideration sex, age, H. pylori infection, or type of tissue [18,76], as it was difficult to obtain related information about the control groups. Moreover, since many studies—including a study that used paraffin-embedded tissue for the gastric cancer tissue but used endoscopic biopsy for control tissue—used multiple types of tissues, it was also difficult to control for the variation in type of tissue. Finally, the result of an individually matching case-control study should be presented as a matched OR. The present study had to estimate the OR based on frequency because it was a systematic review. In the future, case-control studies that match gastric cancer tissues and healthy individuals’ control tissues according to sex and age should be conducted, and pooled case-control studies that gather previous study reports and adjust for sex and age are also recommended.
In conclusion, the results of a meta-analysis that adjusted for heterogeneity among 39 case-control studies support the argument that EBV infection increases the risk of gastric cancer. Further analyses should be conducted separately for different types of control tissues. Moreover, in order to obtain a more accurate SOR, case-control studies that match more strictly by sex, age, and type of tissue are required.
Notes
CONFLICT OF INTEREST
The authors have no conflicts of interest associated with the material presented in this paper.