Deprivation and Mortality at the Town Level in Busan, Korea: An Ecological Study
Article information
Abstract
Objectives
Busan is reported to have the highest mortality rate among 16 provinces in Korea, as well as considerable health inequality across its districts. This study sought to examine overall and cause-specific mortality and deprivation at the town level in Busan, thereby identifying towns and causes of deaths to be targeted for improving overall health and alleviating health inequality.
Methods
Standardized mortality ratios (SMRs) for all-cause and four specific leading causes of death were calculated at the town level in Busan for the years 2005 through 2008. To construct a deprivation index, principal components and factor analysis were adopted, using 10% sample data from the 2005 census. Geographic information system (GIS) mapping techniques were applied to compare spatial distributions between the deprivation index and SMRs. We fitted the Gaussian conditional autoregressive model (CAR) to estimate the relative risks of mortality by deprivation level, controlling for both the heterogeneity effect and spatial autocorrelation.
Results
The SMRs of towns in Busan averaged 100.3, ranging from 70.7 to 139.8. In old inner cities and towns reclaimed for replaced households, the deprivation index and SMRs were relatively high. CAR modeling showed that gaps in SMRs for heart disease, cerebrovascular disease, and physical injury were particularly high.
Conclusions
Our findings indicate that more deprived towns are likely to have higher mortality, in particular from cardiovascular disease and physical injury. To improve overall health status and address health inequality, such deprived towns should be targeted.
INTRODUCTION
The Korean national government incorporated the goal "to promote health equity" into the Korean Health Plan 2010. In addition, local governments expressed their concern over regional health inequality when writing the 5th Community Health Care Plan (2011-2014) [1]. To address health inequality within specific areas, it is important to understand the social determinants of health [2] as well as to identify specific regions or problems to be targeted. As observation units get smaller, members are more likely to be homogeneous with respect to their socioeconomic conditions and social environment, which is helpful when devising tailored interventions.
Busan, the second largest city in Korea, had the highest mortality rate (491.4 per 100 000 persons) and the shortest life expectancy (78.8 years) at birth among 16 provinces in 2008 [3]. In addition, substantial health inequality across districts within Busan was reported. It is essential to identify target regions that have the worse health status and socioeconomic conditions prior to developing a program to address regional health inequality. As an area-level socioeconomic indicator, deprivation indices, such as the Townsend index [4], the Carstairs index [5], and the Jarman Index [6], have been widely used.
In Korea, several studies have attempted to examine the relationship between deprivation and health status at the district level [7-9], but few have considered such analyses at the town level. A town (i.e., Eup·Myeon·Dong in Korean) is the smallest administrative unit in Korea that is relatively homogeneous with respect to the residents' sociodemographic characteristics, as compared to districts. To our knowledge, only one study has attempted to develop a composite deprivation index at the town level and to explore its relationship with mortality in Korea [10]. However, that study did not examine cause-specific mortality, which limited the information available to help local governments set priorities [11].
Our study sought to examine overall and cause-specific mortality and deprivation at the town level in Busan, thereby identifying towns and causes of death to be targeted for improving overall health and alleviating health inequality.
METHODS
I. Units of Analysis and Data Source
Our analysis was performed using aggregated town level data obtained during 2005 to 2008. A town is the smallest administrative unit in Korea. Small units of observation enable the development of tailored health promotion strategies [12]. However, small sample size is associated with large variability and unstable estimation. The Korea National Statistical Office has guidelines for publicly released town-level mortality data. For all-cause mortality and physical injury-related mortality, data were provided for towns with at least 5000 residents per year; for other causes of death, such as cancer, heart disease, and cerebrovascular disease, data were provided for towns with greater than 10 000 residents per year. Data from town populations below these standards were combined with data from nearby towns that had similar proportions of elderly individuals (those 65 years and over) and poor individuals (those below the poverty line). Two towns, Geumseong-dong (a mountainous area) and Cheonga-dong (an island), were excluded from our analysis due to small population sizes and the lack of nearby towns with which to be combined. If a town was split into two or more new towns during the study period, the original town unit was used for analysis, whereas in the case that two or more towns were combined during the study period, data from the most recent town units were used. In total, 170 units out of 215 towns that existed in the year 2008 in Busan were included in our study. The population size for the study period averaged 84 066, ranging from 26 825 to 238 120.
II. Standardized Mortality Ratios (SMRs) for All-Cause and Leading Causes of Death
An SMR is the number of observed deaths divided by the number of expected deaths within a given time period and is a useful standardization method for cases in which age-stratified numbers of the dead in a study population are either unavailable or too small for statistical analysis [13]. The expected numbers of the dead of each town were calculated by multiplying the five-year, age-stratified death rates of Busan with the number of town residents for the years 2005 through 2008. Leading causes of death included cancer (C00-C97), heart disease (I20-I51), cerebrovascular disease (I60-69), and physical injury (V01-Y89), based on the 10th International Classification of Diseases.
A total of 74 956 deaths occurred, including 21 482 deaths due to cancer, 9373 due to heart disease, 8359 due to cerebrovascular disease, and 7793 due to physical injury. The number of all-cause deaths at the town level varied from 166 to 1200. To estimate 95% confidence intervals (CIs) of SMRs, Vandenbroucke's method was used [14].
III. The Deprivation Index as a Town-Level Socioeconomic Indicator
Deprivation is defined as the state of observable and demonstrable disadvantage relative to the local community or the wider society or nation to which an individual, family, or group belongs [15]. Townsend made a distinction between material deprivation and social deprivation; the former included disadvantages in securing materials, goods, services, resources, amenities, the physical environment, and residential location, whereas the latter was associated with disadvantages in the roles, relationships, functions, customs, rights, and responsibilities of the members of society and its subgroups [16]. Area-level deprivation indices have been recognized as valuable tools for examining regional health inequalities and are used as benchmarks for resource allocation by local governments [12]. While the classic deprivation indices (i.e., the Townsend index, the Carstairs index) primarily measure material deprivation, recent studies have also included social deprivation [17,18].
For this study, we obtained 10% sample data from the 2005 census in Busan from the National Statistical Office. To determine socioeconomic conditions, nine household-level and seven individual-level variables were available and are listed in Table 1. Principal components and factor analyses with varimax rotation were applied to summarize these data. Most variables were loaded to factor 1, representing social deprivation, or factor 2, indicating material deprivation. Other variables, such as overcrowding, rented house, no car, low social class (household), and low social class (individual), were dropped from our analysis. Town-level deprivation indices were constructed by summing up the Z-standardized scores of individual variables to have a population-weighted mean of zero and a variance of one [20]. Larger negative values indicated greater deprivation.
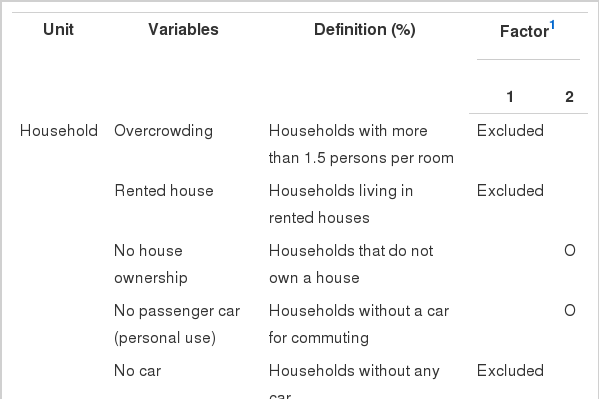
Variables for constructing the deprivation index at the town level in Busan
IV. The Relationship Between Deprivation and SMRs
We estimated descriptive statistics for deprivation and SMRs, including mean, standard deviation, range, interquartile range, and maximum to minimum ratio. Statistical analyses were performed using Stata/S version 11.1 (Stata Corp., College Station, TX, USA).
To visualize the spatial distribution of both measures, we categorized them into quintiles, and geographic information system (GIS) mapping techniques were applied using ArcGIS, version 9.2 (ESRI, Redlands, CA, USA). In order to evaluate spatial autocorrelation, we estimated Moran's I coefficient of autocorrelation for the deprivation index and SMRs using GeoDa, version 0.9.5i (Urbana-Champaign, IL, USA). This coefficient represents the degree of similarity among neighboring regions [21]. We then used Bayesian modeling to estimate the relative risks (RRs) of SMRs by deprivation quintile using the intrinsic Gaussian conditional autoregressive (CAR) model proposed by Besag et al. [22]. This model controls for both the heterogeneity effect and the spatial autocorrelation component that was found in our data. RRs were estimated via Markov Chain Monte Carlo algorithms with WinBUGS software, version 1.4.3 (MRC Biostatistics Unit, Cambridge, UK). Parameter means and 95% CIs were estimated from chains of 10 000 iterations after a burn-in period of 10000 iterations and collection of every fifth observation for thinning. We ran two independent chains, starting from diverse initial values, and convergence was assessed with the Gelman-Rubin convergence statistic, as modified by Brooks and Gelman [23].
RESULTS
I. Distributions of the Deprivation Index and SMRs
Table 2 shows the descriptive statistics of the deprivation index and SMRs. The deprivation index averaged 0.9 with a standard deviation of 7.4 and a range of -22.6 to +14.6. SMRs for all-cause mortality averaged 100.3, ranging from 70.7 to 139.8 across all towns in Busan. For cause-specific mortalities, the means of the SMRs were around 100. Similar to all-cause mortality, the ratio of highest to lowest SMR for cause-specific deaths was greater than 2.0. Notably, among the leading causes of death, the gap between high and low deprivation areas was the greatest for physical injury.
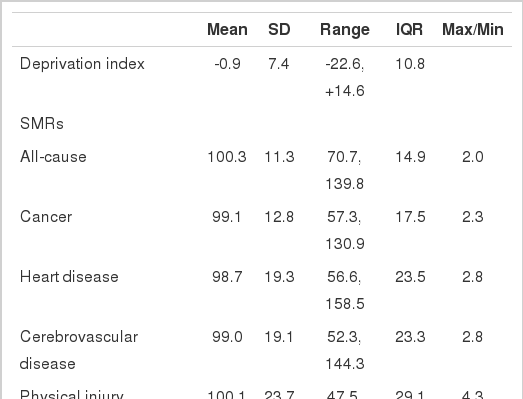
Distribution of the deprivation index and standardized mortality ratios in Busan
The spatial distributions of the deprivation index and SMRs are shown in Figure 1. Less deprivation or low SMRs were likely to be observed in new towns, such as Hwamyeong 3-dong in Buk-gu and Jwa 1, 3,4-dong in Heaundae-gu. More deprivation or high SMRs were likely to be observed in old inner districts (e.g., Jung-gu, Dong-gu, Seo-gu, and Sasang-gu), towns reclaimed for displaced households due to the urban development project (e.g., Seo-dong and Bansong-dong), and rural areas around Gijang-gun and Gangseo-gu. The SMR for physical injury was notably higher in rural areas.
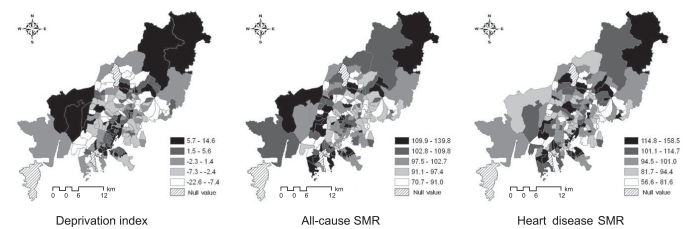
Spatial distribution of the deprivation index and standardized mortality ratio at a town level in Busan (Categorized in quintiles)
SMRs: standardized mortality ratios.
II. The Relationship Between the Deprivation Index and SMRs
To examine the correlation between the deprivation index and SMRs, we adopted a spatial regression model, as Moran's I values for the deprivation index and SMRs were statistically significant (Table 3). Table 4 presents the results from five different Bayesian models, all of which included deprivation level. RR estimates were similar between all models. In general, the mortality gap was substantial between the most and the least deprived groups, and we found an inverse relationship, with a stepwise gradient, between them. RRs of the most deprived quintile for heart disease and cerebrovascular disease were 1.18 (95% CI, 1.09 to 1.25) and 1.17 (95% CI, 1.07 to 1.30), respectively, while it was 1.24 (95% CI, 1.11 to 1.37) for physical injury. However, the model for cancer death gave a high standard error, resulting in a slightly less precise 95% CI.
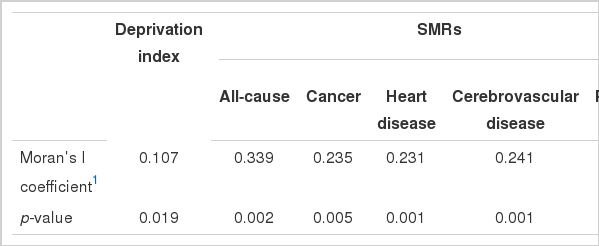
Spatial autocorrelation of deprivation index and SMRs at the town level in Busan
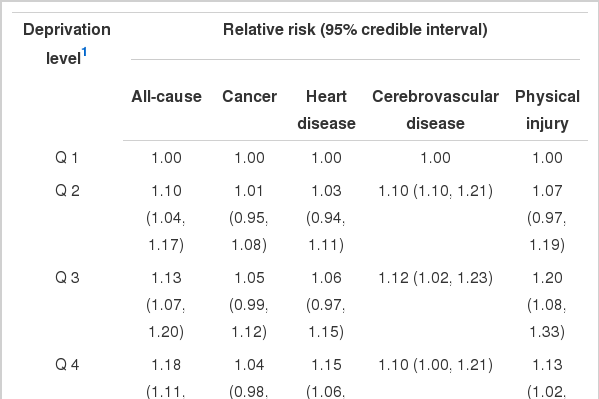
Relative risks by deprivation level in Busan, using the Gaussian conditional autoregressive model
DISCUSSION
In this study, we measured the deprivation index and SMRs at the town level in Busan, Korea and examined their relationship. We found considerable variation in SMRs for all-cause and cause-specific mortality. Towns in old inner cities, those reclaimed for displaced households, and rural towns had higher SMRs and greater deprivation scores as compared with new towns. In addition, we found an association between deprivation and SMRs for leading causes of mortality. The mortality gap by deprivation level was prominent for heart disease and physical injury.
To our knowledge, this is the first study to examine cause-specific mortality and deprivation at the town level in Korea. While small units of analysis can result in unreliable mortality rates, larger spatial units may obscure relevant variation. In addition, using larger units results in statistically more stable indicator values, e.g., mortality rates, but they are more ambiguous [24]. Talbot reported that small units of analysis can bring about powerful results in studies analyzing the size of such units and homogeneity [25]. The indicators at lower level have administrative strength. Our objective was to identify specific towns or health problems to be targeted so that local authorities (i.e., the city government or council) could develop strategies to appropriately allocate resources. Although the strength of the association between SMRs and deprivation in this study seemed weaker than those examined at the district level [7,26], the policy implications for local authorities may be greater.
In the present study, construction of the deprivation index took into account Korea-specific characteristics, as well as data availability. For example, it included "no passenger car" and "no house ownership" variables instead of "no car" and "rented house," as used in other indices. In rural areas in Korea, many households, including the poor, have a truck or car for work. In addition, living in a rented house, while owning another house elsewhere, is not uncommon, particularly in metropolitan cities. Thus, "no car" and "rented house" variables, which are components of the Carstairs and Townsend indices, are inappropriate for describing material deprivation in Korea. Despite our findings, further studies on socioeconomic indicators for small areas are required.
The CAR model is widely used in small-area ecological studies to map outcomes and to examine associations with population factors. Most of these applications are in the field of disease mapping [26]. The advantages of using the CAR model instead of presenting crude RRs when assessing area-level risks include accounting for overlapping effects of neighboring areas, which gives a more complete and realistic approximation of relative area risks. When geographic correlations are inherent in the data, ignoring them can lead to biased and inefficient inferences, as the observations are not strictly independent [28]. In this study, we made use of the CAR model to provide town-level estimates of the RR of mortality according to deprivation level. This is the first spatial analysis to do so in Korea.
According to the National Statistical Office, cancer, heart disease, cerebrovascular disease, and physical injury were the leading causes of death, accounting for 62.3% of total mortality in Busan. In particular, the age-standardized death rates for heart disease and cerebrovascular disease in 2008 were 37.4/100 000 and 59.0/100 000, respectively; these are the highest mortality rates among 16 provinces in Korea. In addition, we found considerable inequalities in SMRs for heart disease and cerebrovascular disease across towns. It is widely recognized that heart disease mortality can be effectively reduced by appropriate prevention and treatment services [29-32]. Hunink and colleagues estimated that approximately 25% of the decline in ischemic heart disease mortality in the United States between 1980 and 1990 could be explained by primary prevention and another 72% by secondary prevention [31]. In Busan, it seems reasonable that heart disease is a good target for improving overall health status and alleviating health inequality.
The physical injury mortality rate in Busan in 2008 was 54.6/100 000, which was much lower than the national mortality rate. However, among the leading causes of death, the gap in SMRs between the most and the least deprived towns was the greatest for physical injury. Therefore, physical injury is also a good target for narrowing the health inequality gap.
A gap in SMRs for cancer according to deprivation level was not prominent. This may be partly explained by the fact that genetic factors play an important role in cancer incidence, and social patterning varies depending on the type of cancer. For example, lung cancer is more likely to occur among lower socioeconomic groups, while breast cancer is more often seen in higher socioeconomic groups [20]. Thus, a socioeconomic correlation with cancer may be obscured when grouping all types of cancer together [10,20,33-36].
There were several limitations of this study. First, due to limited data availability, we could not examine sexspecific effects in our analysis. Previous studies have suggested that social and material conditions are associated with male and female health differently [34,37,38]. Deguen et al. reported that the mortality gap of myocardial infarction between the most deprived neighborhoods and the least ones were significant in females, but not in males [34]. However, we could not obtain data stratified by sex from the Korean Statistical Office. Second, some of the data obtained from the National Statistical Office were combined due to small observation number. This was helpful to overcome the instability of estimates. However, it may have brought about a misclassification bias towards the null hypothesis if neighboring towns had considerably different characteristics, although we combined data based on similarities in poverty level and the proportion of elderly people [39]. Finally, this is an ecological study based on aggregated data at the town level. Therefore, we could not distinguish between contextual and compositional effects. To overcome this limitation, multi-level analysis is required.
Over the last decade, there has been increasing concern regarding health inequality in Korea. However, specific action plans to address such gaps have been limited, partly due to a lack of information. Our findings suggest that targeting small areas with high mortality and great deprivation, as well as some particular diseases, is important for improving overall health status and alleviating inequality. In the case of Busan, prevention of heart disease, cerebrovascular disease, and physical injury should be given priority with the aim of reducing overall mortality as well as mortality rate gaps between towns. In addition, towns identified as the most deprived and most unhealthy in this study should be given priority for the allocation of socioeconomic and health resources.
Notes
The authors have no conflicts of interest with the material presented in this paper.
This article is available at http://jpmph.org/.