Fate and Transport of Mercury in Environmental Media and Human Exposure
Article information
Abstract
Mercury is emitted to the atmosphere from various natural and anthropogenic sources, and degrades with difficulty in the environment. Mercury exists as various species, mainly elemental (Hg0) and divalent (Hg2+) mercury depending on its oxidation states in air and water. Mercury emitted to the atmosphere can be deposited into aqueous environments by wet and dry depositions, and some can be re-emitted into the atmosphere. The deposited mercury species, mainly Hg2+, can react with various organic compounds in water and sediment by biotic reactions mediated by sulfur-reducing bacteria, and abiotic reactions mediated by sunlight photolysis, resulting in conversion into organic mercury such as methylmercury (MeHg). MeHg can be bioaccumulated through the food web in the ecosystem, finally exposing humans who consume fish. For a better understanding of how humans are exposed to mercury in the environment, this review paper summarizes the mechanisms of emission, fate and transport, speciation chemistry, bioaccumulation, levels of contamination in environmental media, and finally exposure assessment of humans.
INTRODUCTION
Mercury is released to the atmosphere from various natural and anthropogenic sources such as volcanos, coal-powered plants, and incineration plants. Once mercury is released to the environment, it can be transported to various environmental media. Mercury can exist as various species in air and water environments, mainly elemental (Hg0) and divalent gaseous (Hg2+) mercury depending on its oxidation states. The organic form of mercury, particularly methylmercury (MeHg), is known as a global contaminant and toxicant to humans and wildlife [1].
MeHg can cross the placenta and readily pass through the blood-brain barrier, with even higher levels of MeHg reported in fetal than in maternal circulation [2]. Vulnerability of the developing fetus to MeHg exposure was exemplified in Minamata, Japan by pregnant women who consumed seafood highly contaminated with MeHg. This resulted in extreme fetal abnormalities and neurotoxicity (i.e., microcephaly, blindness, severe mental and physical developmental retardation) even among infants born from mothers with minimal symptoms [2].
Korea is surrounded by the sea on three sides, and has many lakes, rivers, and tributaries, and Korean people are known to consume high quantities of seafood including fish. In fact, it was recently reported that the mercury intake is known to be 18.8 µg day-1 for adults in Korea, and more than 90% of mercury exposure came from food intake [3]. It was also reported that, surprisingly, blood mercury levels among adult Koreans are 5 to 8 times higher than that of other countries such as the US [4]. In addition, coal power plants are one of the main contributors to the total electric energy production in Korea. The number of incineration plants for treating wastes, especially hazardous wastes, produced in Korea continues to increase. All this indicates that a considerable increase in mercury sources is occurring in Korea.
Since mercury can move over long distances through various environmental media, it is important to identify the contribution of emission sources, and the global movement of mercury. It is also necessary to understand the emission sources, fate, and transport mechanisms of mercury species in environmental media. This understanding is important for assessing the exposure of humans to mercury. In this review, we summarize the theoretical aspects of mercury emission sources, fate, and transport including the mechanism of mercury, the distribution of mercury species in environmental media, and recent measurement data in Korea and other countries. Finally, we summarize the health impact of mercury, particularly MeHg.
FATE AND TRANSPORT AND EXPOSURE OF MERCURY
Mercury Species and Its Emission Sources
Mercury can be found as inorganic and organic mercury species in the environment. Inorganic mercury can exist in two oxidation states; Hg0 (metallic, zero oxidation state) and Hg2+ (mercuric, oxidation state +2) in the environment [5]. Since various mercury species have their special physicochemical characteristics, it is important to understand the fate and transport of each mercury species in the environment.
Among mercury species, elemental mercury (0 oxidation state), being the predominant species in ambient air, has residence time of 0.5 to 2 years due to its low solubility in water and chemical inertness [6]. Hg0 can be globally cycled by long-range transport [7]. Elemental mercury emitted from its sources can be thoroughly mixed vertically in the troposphere, and its typical concentration is reported to be 1 to 4 ng m-3 at background sites [6]. Elemental mercury is often called dissolved gaseous mercury (Hg0) as DGM in water.
In contrast, Hg2+, mainly as reactive gaseous mercury (RGM) in the atmosphere is highly water soluble, reactive, and less volatile than Hg0 with a lifetime of days in the atmosphere. Therefore, the amount of RGM (Hg2+) in the atmosphere is typically less than 5% of the total mercury (TM) concentration, but RGM (Hg2+) is important in terms of mercury deposition into water environments. In fact, Han et al. [8] reported that gas-phase oxidized mercury (Hg2+) has a higher dry deposition rate in the air (1-4 cm s-1).
Another species in the atmosphere is particulate mercury (Hg(p)), which is the mercury species adsorbed by particulate matter. Atmospheric deposition is the primary pathway for inputs of particulate mercury (Hg(p)) and RGM (Hg2+) to natural waters in many cases. Mercury species in the atmosphere comprises various species such as Hg2+, Hg(p), and Hg0, and each species has different physico-chemical characteristics and consequently different atmospheric lifetimes. Therefore, mercury speciation is important when assessing the atmospheric fate and transport of mercury.
In natural water environments, mercury can exist as several chemical species, including DGM (Hg0), dissolved Hg2+ in water, and organic mercury mainly in the form of MeHg (CH3Hg+). Dissolved Hg2+ in water is often called dissolved reactive mercury (DRM, Hg2+). DRM (Hg2+) undergoes various oxidation and reduction reactions with strong a relationship with organic matter in water [9].
Mercury Emission Sources
Mercury is emitted from both natural and anthropogenic sources. Natural sources include volcanic activity, weathering of rock, oceans, soils, biomass burning, and vegetation, whereas anthropogenic sources include coal combustion, waste incineration, mercury mining, iron and steel production, non-ferrous smelters, cement production, chlor-alkali facilities, industrial uses, and re-emission of previously deposited anthropogenic mercury [1,5].
Most mercury in the atmosphere is emitted by anthropogenic activities. Anthropogenic activities account for 2/3 of natural sources of mercury [10]. Among anthropogenic sources of mercury, the combustion of coal or fossil fuels, associated with energy or heat production in major power plants and waste incineration plants contributes approximately 70% of total atmosphere emissions [1]. Munthe et al. [11] also showed that the deposition rate of Hg has grown by three times during the past century because of increased anthropogenic emissions from industry and agriculture and from medical and domestic sources. Pacyna et al. [12] also reported that global mercury emissions in 2000 were from fossil fuel combustion (65%), gold production (11%), non-ferrous metal production (7%), and cement production (6%). In contrast, the estimation of mercury emissions from natural sources to the atmosphere is not accurately reported. Although the cause is quantitatively unknown for direct anthropogenic sources, there is no doubt that mercury is produced from human activities.
Emissions-related mercury production dramatically increased after the Industrial Revolution (the late 18th century), and reached its peak during the 1970s (approximately 90 000 tons of mercury emissions). The emissions thereafter gradually decreased by approximately 6000 tons annually until the 1990s [1]. Recently, it has been reported that the mercury emissions from anthropogenic sources were reduced worldwide by an additional 2000 tons annually [12-15].
This outcome implies that the current level of mercury has been achieved by gradually reduced emissions, resulting from strict regulations with increased awareness about the risks of mercury [13]. The development of mercury reduction techniques was also able to reduce the amount of mercury emissions. However, the reduction techniques have mainly been focused on the acidic air pollutants such as SOx, NOx, and particulate matter. The use of alternative energy instead of fossil fuel combustion can also help to reduce greenhouse gases as well as mercury in the atmosphere.
Nevertheless, awareness about mercury is still steadily increasing throughout the world. At the same time, the proportion of emissions from fossil fuel combustion keeps increasing, especially in developing countries. In fact, Asia, especially China, has been regarded as the world's largest atmospheric mercury emission source [16,17]. It was estimated that Asian countries contributed 56% of total worldwide mercury emissions in 1995, compared with around 30% in 1990. The increase in emissions in Asia was clearly related to the growth of coal combustion in China. Korea also relies on 50% fossil fuel combustion for electricity production [18].
Table 1 summarizes the global anthropogenic emissions of mercury as of 2005. According to Table 1, the combustion of fossil fuels (primarily coal) in stationary combustion facilities represents the most important anthropogenic source of mercury released to the global atmosphere, annually accounting for approximately 880 tons, with an important contribution from Asian countries (nearly 70% of the total) [19-23].

Global anthropogenic emissions of mercury in 2005 (in tons)
Fate and Transport of Mercury
Long range transport of mercury
Mercury can be thoroughly mixed vertically in the troposphere, and it can be transported over long distances on local, regional, and global scales [6,8,24]. In fact, previous studies have reported high concentrations of MeHg in fish in non-industrial areas, even the Arctic [25-27]. Seigneur et al. [28] estimated that 21% of TM from wet deposition in the United States originated from China. Weiss-Penzias et al. [29] also reported higher mercury concentration events at Mt. Bachelor Observatory, a remote location on the West Coast of the US, caused by long-range transport from East Asia, including China. These results imply that significant amounts of mercury are transported from China to Korea by long-range transport by the prevailing wind direction from the west.
Deposition of mercury
Mercury is mainly deposited from the air to water by dry and wet deposition as RGM (Hg2+) [30,31]. The deposited mercury has two fates: it is either adsorbed into sediments where it may be transformed to MeHg or it is reduced to DGM (Hg0) in water [32,33].
Recent studies have shown that DGM can be produced in surface waters by the reduction of RGM (Hg2+) [34]. Many physical and chemical environmental parameters can accelerate the reduction of Hg2+ to DGM, including light intensity, water temperature, pH, and the concentration of dissolved organic matter [34-37].
Mercury has the specific property of continuously cycling between air and water phases [6,7]. DGM can be re-emitted into the atmosphere by the volatilization of DGM. The volatilization of DGM is the only process that removes mercury from aquatic systems. Only this process can limit MeHg production and accumulation in fish [38,39].
Fate of organic mercury
Among mercury species, mercury compounds combined with organic carbon are called organic mercury. Among organic mercury species, the best known species is MeHg, which exists as either dimethylmercury ((CH3)2Hg) or monomethylmercury (CH3Hg+). Most organic mercury species are formed by the chemical reaction of Hg2+ ions with organic carbon in water and sediment by microbiological processes or abiotic processes such as sunlight photolysis, resulting in bioaccumulation and biomagnification through the ecosystem.
MeHg is the major species that is accumulated in fish. According to the US Environmental Protection Agency (EPA), mercury species in fish are mostly composed of MeHg. In seawater, mercury exists mainly as Hg0, and MeHg is mostly degraded deep in the ocean; thus, it mainly exists as dimethylmercury in seawater [5]. At the surface of seawater, MeHg does not exist because most MeHg can be volatilized, or demethylated by sunlight. In contrast, there are significantly greater amounts of MeHg in fresh bodies of water such as rivers and lakes compared to seawater. This is due to the low oxygen concentration and therefore the presence of sulfate reducing bacteria (SRB) in the bottom of fresh water lakes and rivers [40,41].
MeHg is usually formed by specific bacteria such as SRB, or chemical reactions such as sunlight photolysis reactions, and these reactions are affected by various environmental parameters [40-45]. However, it was recently reported that biotic and abiotic demethylations of MeHg are considered to be important pathways of mercury in water environments. Biotic demethylation reactions usually occur in sediment and freshwater environments. It was reported that methyl- and phenylmercury can be deceased by algae in fresh water [40]. Demethylation of MeHg in water can also be abiotically mediated such as by sunlight photolysis or by reactive oxygen species such as hydroxyl radicals. These biotic and abiotic demethylation reactions are the most important mechanisms for reducing the bioaccumulation of mercury.
The fate and transport of each mercury species in air, water, and sediment is summarized in Figure 1. According to Figure 1, mercury emitted from its sources can be transported into the atmosphere, and deposited into water environments, then into sediment. Mercury, mainly Hg2+, reacts with organic carbon by bacteria in the sediment, or abiotically, resulting in conversion into MeHg. This converted MeHg can be bioaccumulated into fish species through the food web.
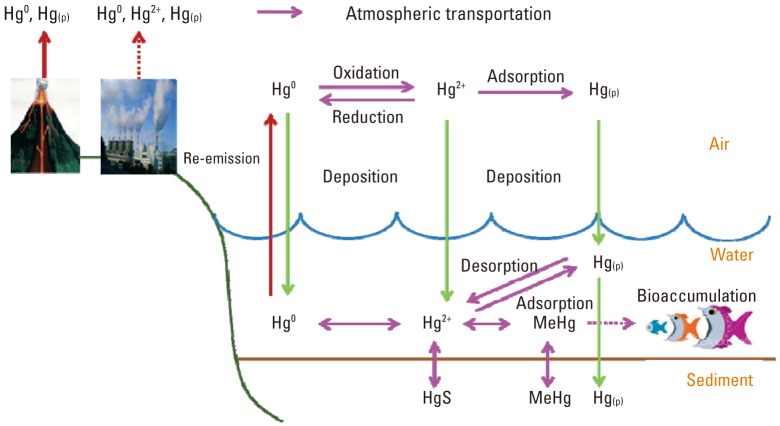
Biogeochemical cycle of mercury in a multimedia environment. Hg0, elemental mercury in atmosphere and dissolved gaseous mercury in water; Hg(p), particulate mercury; Hg2+, reactive gaseous mercury in atmosphere and dissolved reactive mercury in water; MeHg, methylmercury; HgS, mercury sulfide.
The Measurement Data of Mercury in the Environment
Since the 1990s, the measurements of mercury in the environmental media including fish have been actively studied in the US and Canada. It was reported that there is a high correlation between the amounts of mercury emitted to the atmosphere and mercury levels in fish species [26]. This study first quantified the relationship between the emitted mercury and the levels of mercury in ecosystem. Also, since 2001, a comprehensive study called Mercury Experiment to Assess Atmospheric Loading in Canada and the United States has been conducted by the US and Canada in order to understand the effect of deposition of mercury on the levels of MeHg in fish. Recently, researches were conducted by intentionally depositing radioactive mercury species through wet deposition into lakes to track mercury species in the water, sediment, and fish [44-47].
Multimedia models for describing the biogeochemical cycle of mercury to predict the fate of mercury in the environment have also been developed. The most recognized multimedia models are the Caltox, simpleBox, and total risk integrated methodology models [48]; these models are widely applied to predict mercury levels in the environment. The US EPA has been conducting a monitoring project since 1994. The US EPA chose mercury species as the validation compounds of the models, and various monitoring studies including the Lake Michigan Mass Balance Study have been conducted to validate these models [49]. Also, research on reducing the mercury levels in fish species by using these models have been actively carried out [50-56].
The measurement of mercury levels in Korea has also been conducted recently. It was recently reported that the input of mercury by wet deposition from the atmosphere was measured in urban and rural areas in Korea. The annual amounts of mercury deposition in Chuncheon and Seoul cities were 9.4 µg m-2 yr-1, and 20.2 µg m-2 yr-1, respectively [18]. The higher levels of mercury deposition in Seoul compared to Chuncheon city might be due to the presence of the coal-powered plant located in the southwest part of the Seoul, and several incineration plants in Seoul. The levels of mercury wet deposition in Korea were also monitored, compared to other countries, and are summarized in Table 2 [57,58]. As shown in Table 2, the quantity of wet deposition in Korea is the highest in the world except for China. One possible reason might be due to mercury transport from China.

Comparison of mercury wet deposition with other studies
DGM and TM concentrations were measured in the Juam Reservoir in Korea, which is known to be relatively clean because there is no possible mercury source nearby. The result showed that the average DGM concentration in summer was 109±15 pg L-1, almost three times higher than the average DGM levels measured in other lakes around the world. Also, the TM concentration in this lake was 2.2±0.4 ng L-1, and this level is also higher than in other lakes [9] (Table 3).

Mean DGM concentrations measured in the fresh waters of a number of lakes in North America and Korea during the summer season
The measurement of MeHg in Korea was conducted in the Shiwha artificial seawater-based lake surrounded by the Ansan-Shiwha industrial complex. The sediments in Shiwha lake were sampled, and TM and MeHg were measured. The ranges of TM and MeHg were 0.02-0.28 µg g-1, and <0.026-0.67 µg g-1, respectively. The levels of mercury in this lake were higher nearby the industrial complex [59].
The levels of mercury in the air, water, and sediment in Korea are similar or relatively higher than in other countries. The higher levels of mercury might result from the input from China. Locally, the level of mercury was higher nearby industrial regions such as near incineration plants [60].
Bioaccumulation of Mercury and Human Exposure to Mercury
Mercury can be biomagnified rapidly, leading to high concentrations in top predators in aquatic ecosystems. Most mercury species can be bioaccumulated, but the bioaccumulation of MeHg is higher compared to other mercury species [49]. The many environmental parameters in water and sediment can affect the levels of MeHg in fish [42].
MeHg in fish can be combined with the sulfhydryl group in the protein within the cells. Due to this covalent bonding, the bioaccumulation intensity of MeHg compared to other inorganic mercury increases at higher levels of a food web [42]. Therefore, the level of mercury can be highest in the top predator fish in a food web. Even in the same fish species, the older individual fish have higher mercury levels than younger ones [42,61].
MeHg is a neurotoxic chemical to humans worldwide, with frequent fish consumers, pregnant women, and young children being particularly vulnerable. This mercury species is mainly ingested by consuming fish and other seafood. This implies that the major exposure route of mercury is from food intake [5].
Table 4 summarized the sources of mercury, routes of exposure and elimination, and main effects of exposure to mercury [62]. Studies have shown that MeHg in pregnant women's diets can have adverse effects on children's development and on the cardiovascular system [5]. Thus, parents, pregnant women, and women who might become pregnant should be particularly aware of the potential harm of MeHg. Moderate consumption of fish (with low mercury levels) is not likely to result in exposures of concern. However, indigenous populations and others who consume higher amounts of contaminated fish or marine mammals, as well as workers who are exposed to mercury, such as in small scale gold and silver mining, may be highly exposed to mercury and are therefore at risk [5].

The different sources of mercury, routes of exposure and elimination, and main effects
CONCLUSION
Due to the long-range transport characteristics of mercury, international discussion by the United Nations Environmental Program (UNEP) to reduce the global usage of mercury, and emission control are currently being developed. To keep up with this global movement, Korea is taking part in the UNEP partnership program for reducing the emission of mercury from coal-powered plants, and is willing to have as many global partnerships as possible to prepare for an international agreement on mercury reduction. In order to keep up with these national and international trends on mercury, in this review paper, we provided the general backgrounds on emission sources of mercury, fate and transport mechanisms of mercury including MeHg, the distribution of mercury in environmental media, and the exposure routes of mercury to humans. This review can help the readers to understand the theoretical background of mercury's fate and transport and exposure to humans for risk assessment.
Notes
The authors have no conflicts of interest with the material presented in this paper.