Association of Homocysteine Levels With Blood Lead Levels and Micronutrients in the US General Population
Article information
Abstract
Objectives
Even though several epidemiological studies have observed positive associations between blood lead levels and homocysteine, no study has examined whether this association differs by the levels of micronutrients, such as folate, vitamin B6, and vitamin B12, which are involved in the metabolism of homocysteine. In this study, we examined the interactions between micronutrients and blood lead on homocysteine levels.
Methods
This study was performed with 4089 adults aged ≥20 years old in the US general population using the National Health and Nutrition Examination Survey 2003-2004.
Results
There were significant or marginally significant interactions between micronutrients and blood lead levels on mean homocysteine levels. Positive associations between blood lead and homocysteine were clearly observed among subjects with low levels of folate or low vitamin B6 (p-trend <0.01, respectively). However, in the case of vitamin B12, there was a stronger positive association between blood lead and homocysteine among subjects with high levels of vitamin B12, compared to those with low levels of vitamin B12. In fact, the levels of homocysteine were already high among subjects low in vitamin B12, irrespective of blood lead levels. When we used hyperhomocysteinemia (homocysteine>15 µmol/L) as the outcome, there were similar patterns of interaction, though p-values for each interaction failed to reach statistical significance.
Conclusions
In the current study, the association between blood lead and homocysteine differed based on the levels of folate, vitamin B6, or vitamin B12 present in the blood. It may be important to keep sufficient levels of these micronutrients to prevent the possible harmful effects of lead exposure on homocysteine levels.
INTRODUCTION
Elevated homocysteine is known to be an independent risk factor for cardiovascular disease [1,2]. Since widespread arteriosclerosis in patients with homocystinuria, which is caused by deficiencies of enzymes involved in homocysteine metabolism, was first reported in 1969 [3], many clinical and epidemiological researches have shown that an elevated homocysteine level is a potent independent risk factor for arteriosclerosis in the general population [1]. For example, a meta-analysis of observational studies indicated that increased homocysteine levels were a modest independent predictor of coronary heart disease and cerebrovascular disease risk in healthy populations [2]. Although controversy exists regarding a causal relationship, increased homocysteine levels have also been linked with impaired cognitive function [4,5].
High levels of homocysteine are linked to genetic mutations (e.g., 677C→T mutation in 5,10-methylenetetrahydrofolate reductase [MTHFR]), physiological factors (e.g., increasing age, male gender, and postmenopausal state), lifestyle factors (e.g., smoking), deficiency of micronutrients (e.g., folate, vitamin B6, and vitamin B12), and some clinical conditions (e.g., renal failure, hypothyroidism, and late stage of diabetes) [6,7].
On the other hand, several recent studies have reported a positive relationship between blood lead and homocysteine levels in the general population or lead-exposed workers, suggesting that heavy metals like lead can disturb the metabolism of homocysteine [8-11]. Lead, in particular, can disturb essential enzymes in the metabolism of homocysteine like cystathionine β-synthase or MTHFR [12-14]. Notably, micronutrients such as folate, vitamin B6, and vitamin B12 are also involved in the pathways of homocysteine metabolism. Therefore, there is a possibility of interaction between blood lead levels and these micronutrients on the levels of homocysteine.
However, to the best of our knowledge, there has been no study exploring this hypothesis. Thus, we examined whether the association between blood lead and homocysteine differs depending on the levels of micronutrients like folate, vitamin B6, and vitamin B12 in a general population.
METHODS
Study Population
The National Health and Nutrition Examination Survey (NHANES), carried out annually by the Centers for Disease Control and Prevention, is a complex, multi-stage probability research designed to measure the health and nutritional status of the non-institutionalized US general population [15]. In this study, data from NHANES 2003-2004 were used. Among the 5041 participants aged 20 years or older in NHANES 2003-2004, 4089 subjects with valid measured values of plasma homocysteine, whole blood lead, vitamin B6, serum folate, and vitamin B12 levels were included in this study.
Measures
The details of the NHANES protocol and all testing procedures are available elsewhere [15]. Demographic, socioeconomic, and health related characteristics were collected from detailed interview using the standardized questionnaire in participant's homes. Physiological measurements and laboratory tests were conducted by highly trained medical personnel in specially designed and equipped mobile centers.
Venous blood samples were collected and shipped weekly at -20℃. Total homocysteine levels in plasma was determined by the Abbott Homocysteine assay on the Abbott AxSym analyzer, a fully automated fluorescence polarization immunoassay obtained from Abbott Diagnostics (Abbott Laboratories, Abbott Park, IL, USA). Whole blood lead concentration was measured using inductively coupled plasma mass spectrometry, a multi-element analytical technique [16]. Both serum folate and vitamin B12 levels were determined by using the Bio-Rad Laboratories "Quantaphase II Folate/Vitamin B12" radioassay kit (Bio-Rad Laboratories, Hercules, CA, USA). Plasma pyridoxal 5'-phosphate (PLP), the biologically active form of vitamin B6, was measured using the Enzymatic B6 Assay (A/C Diagnostics, San Diego, CA, USA).
Statistical Analysis
Blood lead levels were categorized into quartiles (Q1 to Q4) by cutoff points at the 25th, 50th, and 75th percentile values. Because the range of the highest quartile level (Q4) was too wide, it was sub-divided into four additional categories (Q4-1 to Q4-4), making seven categories of blood lead levels, in total.
First, we evaluated the associations between blood lead levels and homocysteine using a generalized linear model. Also, using logistic regression analysis, we calculated adjusted odds ratios (ORs) for hyperhomocysteinemia (level of plasma homocysteine>15 µmol/L) according to the categories of blood lead levels. Possible confounders were age (years, continuous), sex, race/ethnicity (non-Hispanic white, non-Hispanic black, Hispanic, and other), and poverty income ratio (PIR; an index calculated by family income divided by the poverty threshold, specific to family size, continuous). Briefly, a PIR of less than 1 indicates a family income below the poverty threshold; a PIR of more than 1 indicates a family income one or more times the poverty threshold, body mass index (BMI; kg/m2, continuous), smoking status (never, former, or current), alcohol consumption (none or current), and physical activity (inactive, moderate, or vigorous). Just as previous studies have done [8,11], we further considered as confounders serum folate (ng/mL, continuous), vitamin B12 (pg/mL, continuous), and plasma vitamin B6 (nmol/L, continuous).
Second, we calculated the associations of blood lead levels with continuous homocysteine or dichotomous hyperhomocysteinemia stratified by median levels of serum folate, vitamin B6, and vitamin B12 to determine whether the associations differed depending on micronutrient levels. All statistical analyses were conducted with SAS version 9.2 (SAS Inc., Cary, NC, USA) and SUDAAN version 9.0 (RTI International, Research Triangle Park, NC, USA). Instead of using sample weights, estimates of main results were calculated accounting for stratification and clustering [17], adjusting for age, sex, race/ethnicity, and PIR; this adjustment is considered a good compromise between efficiency and bias [17,18]. The results from SAS and from SUDAAN were very similar, so we present the results based on SAS. A p-value of less than 0.05 was considered statistically significant.
RESULTS
General Characteristics of the Study Subjects According to the Categories of Blood Lead Levels
The sample of 4089 subjects had a mean age of 50.4±19.3 years old. The mean BMI was 28.4±6.2 kg/m2 and mean PIR was 2.6±1.6. Mean values of serum folate, vitamin B6, and vitamin B12 were 14.2±15.1 ng/mL, 67.4±82.4 nmol/L, and 555.2±846.6 pg/mL, respectively. The study subjects were 48.7% male, 53.8% non-Hispanic white, 18.5% current smokers, 71.4% current drinkers, and 41.4% physically inactive people. Subjects with high blood lead levels tended to be older, male, less obese, non-Hispanic white, current smokers, current drinkers, and have a lower PIR and be more physically inactive (p-trend <0.001 for all these variables) compared with those with low blood lead levels (Table 1).
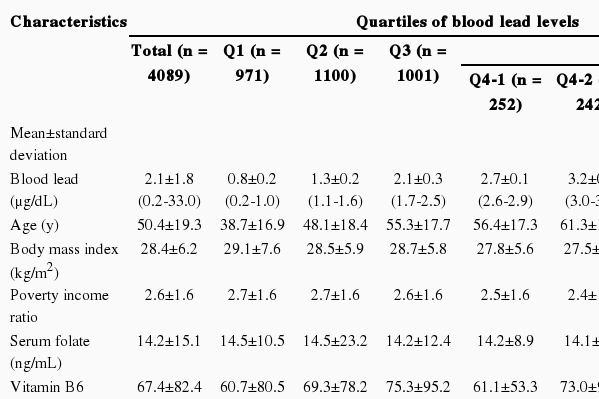
General characteristics of the all study subjects according to the categories of blood lead
Associations of Blood Lead Levels With Homocysteine Levels or Hyperhomocysteinemia
Homocysteine levels showed a positive trend with blood lead levels. In the unadjusted analysis, mean homocysteine levels according to the categories of blood lead levels were 7.5, 9.1, 10.0, 10.1, 11.0, 11.2, and 12.2 µmol/L, respectively (p-trend <0.001) (Table 2). This linear relationship between homocysteine and blood lead remained statistically significant after adjusting for covariates including age, sex, race/ethnicity, PIR, BMI, smoking, alcohol consumption, and physical activity. However, the magnitude of the increase was smaller than the unadjusted analysis: 9.2, 9.7, 9.8, 9.6, 10.1, 10.3, and 11.2 µmol/L, respectively (p-trend <0.001). Further adjustment for serum folate, vitamin B6, and vitamin B12 did not change the results.

When we used the dichotomous outcome of hyperhomocysteinemia, the unadjusted ORs were 1.0, 2.1, 3.3, 4.3, 4.1, 8.3, and 11.1 across the categories of blood lead levels (p-trend <0.001) (Table 2). After all covariates were adjusted, the ORs for hyperhomocysteinemia were 1.0, 1.2, 1.3, 1.6, 1.2, 2.6, and 3.2 (p-trend <0.001).
These patterns were similarly observed among subjects without chronic diseases, specifically coronary artery disease, cerebral vascular disease, hypertension, diabetes, cancers, thyroid disease, and kidney disease, which could influence homocysteine levels (data not shown).
Stratified Analyses by the Level of Serum Folate, Vitamin B6, or Vitamin B12
When study subjects were stratified according to the median value of serum folate, vitamin B6, or vitamin B12, the positive association between blood lead levels and homocysteine levels were more clearly observed among subjects with lower folate (p-trend <0.001) or lower vitamin B6 (p-trend <0.001) (Table 3). There was a stronger positive association between blood lead and homocysteine among subjects with high vitamin B12 than those with low vitamin B12 (p-trend <0.001); and subjects with low vitamin B12 already had high levels of homocysteine, irrespective of blood lead levels. A p-value for interaction was statistically significant or marginally significant for all three micronutrients.
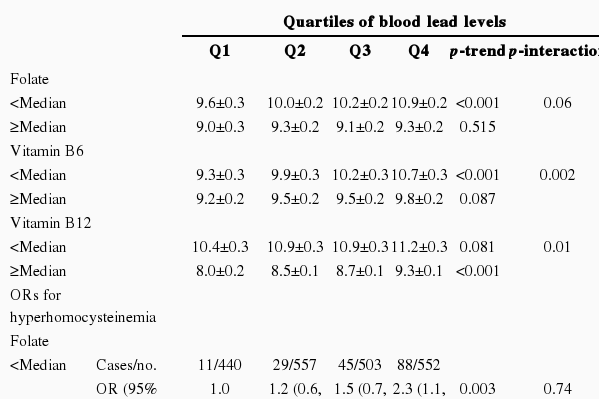
There were similar patterns in general when we used hyperhomocysteinemia as the outcome, though p-values for interactions failed to reach statistical significance (Table 3). Namely, clear and statistically significant increasing trends were observed only among subjects with lower folate (p-trend 0.003) or lower vitamin B6 (p-trend <0.001). In the case of vitamin B12, the positive association tended to be observed among subjects with both lower and higher vitamin B12 (p-trend 0.012 and 0.005, respectively). We also presented the adjusted ORs, using subjects with blood lead levels in the 1st quartile and micronutrients less than the median value as the reference group, to give a comprehensive view on the combination effect of lead and each micronutrient (Figure 1).
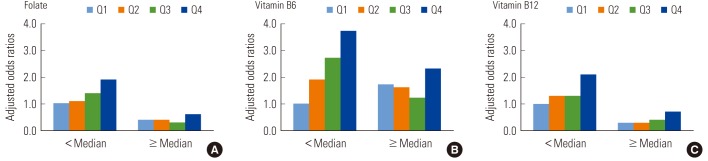
Interactions between blood lead levels and micronutrients (A, folate; B, vitamin B6; and C, vitamin B12) on hyperhomocysteinemia. Odds ratios were adjusted for age, sex, race/ethnicity, poverty income ratio, BMI, smoking, alcohol, and physical activity. Subjects with the lowest quartile of blood lead and each micronutrient (A, folate; B, vitamin B6; and C, vitamin B12) less than the median were used as a reference.
Q1: first quartile; Q2: second quartile; Q3: third quartile; Q4: fourth quartile.
DISCUSSION
Our current study showed a linear association between blood lead and homocysteine among the US general population even though 95.2% of study subjects had blood lead levels less than 5 µg/dL. In addition, as we hypothesized, the association between lead and homocysteine differed depending on serum folate, vitamin B6, and vitamin B12 levels.
The association between blood lead and homocysteine is consistent with the findings of several previous studies [8-11]. For example, in the Baltimore Memory Study, a population-based study of adults aged 50 to 70 years old, homocysteine levels increased 0.35 µmol/L per every 1.0 µg/dL increase in blood lead [9]. In a study of Vietnamese factory workers occupationally exposed to lead, an elevation of 1.0 µg/dL in blood lead was associated with an elevation of 0.05 µmol/L in homocysteine on the logarithmic scale [10]. Two other general population studies, one of US adults aged 20 to 59 years old who participated in the NHANES and the other of Pakistani adults aged 18 to 60 years old, also showed an increase of homocysteine as blood lead levels increased [8,11]. Based on our findings and those of other studies, it could be suggested that blood lead levels could be another predictor of hyperhomocysteinemia.
Importantly, we observed statistically significant interactions between blood lead and the micronutrients folate, vitamin B6, and vitamin B12, which are involved in transmethylation or transsulfuration metabolism on homocysteine levels. The positive association between blood lead and homocysteine was mainly observed when the levels of folate or vitamin B6 were low while there was no clear association among subjects with high levels of folate or vitamin B6. On the other hand, unlike folate or vitamin B6, in the case of vitamin B12, the positive association was observed only among subjects with high vitamin B12 levels. In fact, homocysteine levels were already substantially high among subjects with low vitamin B12 levels irrespective of blood lead levels. If homocysteine levels increase above certain levels, additional synergic effects of blood lead levels may be negligible.
Meanwhile, although the p-values of interactions between blood lead levels and micronutrients on the blood concentrations of homocystein were marginally significant or significant, those in a logistic regression using a dichotomous variable for hyperhomocysteinemia as an outcome, failed to reach statistical significance. As the continuous homocysteine levels tested additive interactions while the dichotomous hyperhomocysteinemia tested multiplicative interactions, more significant results in the additive interactions can be expected. Even though the multiplicative interactions failed to reach statistical significances, it is notable that the patterns of interactions were similarly observed in both models.
Homocysteine is a sulfur-containing amino acid derived from the metabolism of methionine, and can be metabolized by one of two pathways: 1) transsulfuration to cysteine, and 2) remethylation to methionine [19]. In the transsulfuration pathway, homocysteine is transformed to cystathionine by the enzyme cystathionine β-synthase with vitamin B6, which is a PLP-dependent heme-containing enzyme [19,20]. Because lead toxicity inhibits heme and hemoglobin synthesis [21], this could be one mechanism that explains the observed association between blood lead and homocysteine.
In addition, in the remethylation pathway, homocysteine can be remethylated to methionine through the enzyme methionine synthase with vitamin B12, folate, and MTHFR [19]. At the same time, it has been suggested that the variant enzyme MTHFR might cause lead to bind more to active sites, which may result in the impairment of enzyme function [14]. On the other hand, the heavy metals, including lead, have high electron-sharing affinities for the free sulfhydryl group of proteins [21,22]. As homocysteine itself contains a sulfhydryl group, blood lead may inhibit the metabolism of homocysteine by this pathway. Taken together, there is a possibility that lead might directly inactivate the enzymes involved in methionine metabolism, or might adhere competitively to the active site for homocysteine, or homocysteine itself. Lead can also biologically interact with folate, vitamin B6, and vitamin B12.
Current study has some limitations. First, in this cross-sectional study we cannot determine the causality between blood lead and homocysteine, despite the biological plausibility discussed above. Second, we could not consider gene mutation, which is already known to be associated with the level of homocysteine (e.g., point mutation of enzyme MTHFR 677C→T). It is difficult to imagine that blood lead levels would be different depending on the mutation of enzyme MTHFR. Therefore, gene mutation may not act as a strong confounder in this study. However, further studies on the effect of genetic polymorphisms of enzymes involved in homocysteine metabolism would be helpful to understand the current findings.
Regardless of these limitations, the current study has several strengths. First, this study employed the strict sampling design, large sample size, and controlled quality of study measurements used in NHANES. Second, to best of our knowledge, this is the first study to investigate the interaction between the level of blood lead and the micronutrients involved in the metabolism of homocysteine in estimating the level of serum homocysteine.
In conclusion, we found that mean homocysteine levels and the risk of hyperhomocysteinemia increased with blood lead levels. Importantly, these relationships differed by the level of the micronutrients involved in the metabolism of homocysteine. It may be important to maintain sufficient levels of these micronutrients to prevent possible lead exposure from harming the metabolism of homocysteine.
ACKNOWLEDGEMENTS
This research was supported by the Basic Science Research Program through the National Research Foundation of Korea funded by the Ministry of Education, Science and Technology (2010-0011905).
Notes
The authors have no conflicts of interest with the material presented in this paper.