Inappropriate Survey Design Analysis of the Korean National Health and Nutrition Examination Survey May Produce Biased Results
Article information
Abstract
Objectives
The inherent nature of the Korean National Health and Nutrition Examination Survey (KNHANES) design requires special analysis by incorporating sample weights, stratification, and clustering not used in ordinary statistical procedures.
Methods
This study investigated the proportion of research papers that have used an appropriate statistical methodology out of the research papers analyzing the KNHANES cited in the PubMed online system from 2007 to 2012. We also compared differences in mean and regression estimates between the ordinary statistical data analyses without sampling weight and design-based data analyses using the KNHANES 2008 to 2010.
Results
Of the 247 research articles cited in PubMed, only 19.8% of all articles used survey design analysis, compared with 80.2% of articles that used ordinary statistical analysis, treating KNHANES data as if it were collected using a simple random sampling method. Means and standard errors differed between the ordinary statistical data analyses and design-based analyses, and the standard errors in the design-based analyses tended to be larger than those in the ordinary statistical data analyses.
Conclusions
Ignoring complex survey design can result in biased estimates and overstated significance levels. Sample weights, stratification, and clustering of the design must be incorporated into analyses to ensure the development of appropriate estimates and standard errors of these estimates.
INTRODUCTION
The Korean National Health and Nutrition Examination Survey (KNHANES) is one of a series of health-related programs sponsored by the Korean Centers for Disease Control and Prevention [1]. The KNHANES has been used to assess the health and nutritional status of the non-institutionalized civilian population in Korea since 1998. Since the survey data became available for official public use in Korea, research papers using KNHANES data have become more common and have increased in numbers year by year [1]. Public access to the survey data has generated new momentum for research organizations, universities, and healthcare providers, including clinical medical researchers who had experienced difficulties in obtaining the raw data [2-4].
The KNHANES is a complex, stratified, multistage, probability-cluster survey of a representative sample of the non-institutionalized civilian population in Korea. The stratified multistage cluster sampling design creates non-independence among units, along with disproportionate sampling where some groups may be oversampled or a probability proportional to size has been applied [5,6]. This creates two primary challenges that must be addressed when analyzing complex survey data: 1) homogeneity that results from the non-simple random sample (i.e., non-independence) and 2) disproportionate sampling that results in unequal selection probabilities (e.g., oversampling or adjustment for non-response) [7,8]. Failure to address these issues results in incorrect estimation of standard errors, which often results in underestimation and an increased probability of a type I error [6,9].
Given the inherent nature of multiple complex survey designs, the KNHANES and the US NHANES provide specific guidelines for analysis and reporting of sample weights, so the stratification and clustering of the design must be incorporated into analyses to ensure appropriate estimates and standard errors. These guidelines warn that ignoring the complex design leads to biased estimates and overstated significance levels [10,11]. Regrettably, most of the published research articles using KNHANES data do not incorporate survey design analysis into their statistical analysis. Instead, most use regular standard statistical analysis, treating KNHANES data as if they were collected using a simple random sampling method. The objectives of this study were to: 1) explore the serious problem of misuse of statistical analyses using KNHANES data, 2) provide several examples of differing results when KNHANES data are analyzed using ordinary statistics and survey design statistics, and 3) recommend survey design statistics to calculate non-biased estimates for descriptive or analytical data analysis.
METHODS
Experimental Design and Data Collection
The entire KNHANES program was designed to assess the health and nutritional status of adults and children in Korea. The KNHANES program began in 1998 and was conducted as a series of regular surveys in 2001 and 2005. In 2007, the survey became a continuous program that has focused on a variety of health and nutritional measurements to meet public need. The survey is conducted annually, using a rolling sampling design involving a complex, stratified, multistage, probability-cluster survey of a representative sample of the non-institutionalized civilian population in Korea.
Data analysis using the KNHANES requires special statistical analysis to handle the multistage complex sampling survey design, which yields data that differ from survey data collected using simple random sampling. Because of the inherent nature of the complex sampling survey design, the KNHANES provides specific guidelines for data analysis that should be incorporated into any survey design statistics developed using SAS or SPSS survey design programs, SUDAAN, and other relevant programs. This study analyzed the proportion of research papers that have used an appropriate statistical methodology since the KNHANES survey data became available for official public use. This study was restricted to the research papers cited in the PubMed online system from 2007 to 2012 (http://www.ncbi.nlm.nih.gov/PubMed). First, the research papers were classified into two groups: ordinary statistical data analysis papers treating the survey data as simple random sampling data; and design-based analysis papers that incorporated survey design into their analyses. Model-based analyses using multilevel or hierarchical data analysis were classified as special cases of sampling weighted data analysis papers incorporating survey design characteristics. To calculate the proportion of ordinary statistical data analyses and design-based analyses of the KNHANES, we searched the PubMed website for all available articles using the search terms "KNHANES or Korean National Health and Nutrition Examination Survey." Once collected, all the available articles were reviewed and classified into two groups (ordinary statistical data analysis without sampling weight and design-based analysis with sampling weight).
We also compared differences in mean and regression estimates between the ordinary statistical data analyses and design-based data analyses using KNHANES 2008 to 2010, which represented the second and third years of KNHANES IV (2007 to 2009) and the first year of KNHANES V (2010 to 2012). Detailed information on the design of the survey has been provided elsewhere [12,13]. Briefly, the survey consists of three components: a health interview survey, a health examination survey, and a nutrition survey. We used two different populations to compare differences in estimates based on ordinary statistical data analyses and design-based analyses. The first study population was restricted to female KNHANES 2008 to 2009 participants who completed the health examination survey, who had a bone mineral density measurement, and who were menopausal (including surgically-induced menopause) (n=567). The second study population was restricted to KNHANES 2008 to 2010 participants ≥20 years of age who had completed the health examination survey, including having their blood levels of lead, cadmium, and mercury measured (n=5919).
Information on age, education, smoking history, and alcohol intake was collected during the health interview. Height and weight were measured with the participants wearing light clothing and no shoes. The body mass index was calculated as weight in kilograms divided by the square of the height in meters. Residence area was categorized into urban areas (administrative divisions of a city) and rural areas (areas not classified as administrative divisions of a city). Detailed information on classification variables has been provided elsewhere [12,13].
Measurement of Blood Pressure
Blood pressure was measured while subjects were in a sitting position following a 5-minute rest period. The blood pressure was measured on three occasions with a mercury sphygmomanometer on the right arm and averaged for a final blood pressure reading. Hypertension was defined as diastolic blood pressure ≥90 mmHg or systolic blood pressure ≥140 mmHg. Prehypertension was defined as a diastolic pressure >80 mmHg or systolic blood pressure >120 mmHg.
Serum Creatinine and Hemoglobin Measurements
Serum creatinine was measured by the kinetic Jaffe method using an autoanalyzer (model 7600; Hitachi, Tokyo, Japan). Blood hemoglobin was measured with an XE-2100D (Sysmex, Tokyo, Japan).
Measurement of Bone Mineral Density
Bone mineral density was measured in the femur and lumbar spine by dual-energy X-ray absorptiometry at the health examination site using a QDR Discovery (formerly QDR 4500A) fan beam densitometer (Hologic, Inc., Bedford, MA, USA) [14]. Considering the available KNHANES data, we used the total femur T-score for the analysis.
Determination of Lead, Cadmium, and Mercury Levels in Whole Blood
To assess the levels of heavy metals in whole blood, 3-mL blood samples were drawn into standard commercial evacuated tubes containing sodium heparin (Vacutainer). Blood lead and cadmium were measured using graphite-furnace atomic absorption spectrometry with Zeeman background correction (Perkin Elmer AAnalyst 600; Perkin Elmer, Turku, Finland). Levels of blood mercury were measured using a gold-amalgam collection method with a DMA 80 (Milestone, Bergamo, Italy). The details of blood metal analyses have been provided elsewhere [12].
Statistical Analysis
Statistical analyses were performed using SAS version 9.3 (SAS Institute, Cary, NC, USA) and SUDAAN release 10.1 (Research Triangle Institute, Research Triangle Park, NC, USA), a software package that incorporates sample weights and adjusts analyses for the complex sample design of the survey. Survey sample weights were used in all analyses to produce estimates that were representative of the non-institutionalized civilian Korean population.
The levels of lead, cadmium, and mercury in the blood were log-transformed because their distributions were positively skewed, and the un-weighted and weighted geometric means (GM) with 95% confidence intervals (CI) were calculated by gender using the Proc Descript function in SUDAAN.
Odds ratios (ORs) and 95% CI for hypertension and prehypertension were calculated for log-transformed blood lead, cadmium, and mercury (base 2) levels as a continuous variable after covariate adjustment using Proc Rlogist with un-weighted and weighted statistical procedures. Covariates were gender, age, residence area, education level, smoking and drinking status, hemoglobin, body mass index, and serum creatinine.
Finally, the ORs and 95% CI values for osteoporosis were calculated for log-transformed blood lead, cadmium, and mercury (base 2) levels as continuous variables and quartiles of blood mercury in postmenopausal women after covariate adjustment using Proc Rlogist with un-weighted ordinary statistical data analyses and design-based weighted statistical procedures.
RESULTS
During the period between 2007 and June 2012, a total of 256 relevant research papers were cited in PubMed. Table 1 lists the proportions that used ordinary statistical data analyses and design-based weighted statistical analyses. The number of relevant articles published increased steadily by year, and increased more rapidly in recent years. Throughout the 5.5 year time period, 19.8% of the articles used design-based data analyses.
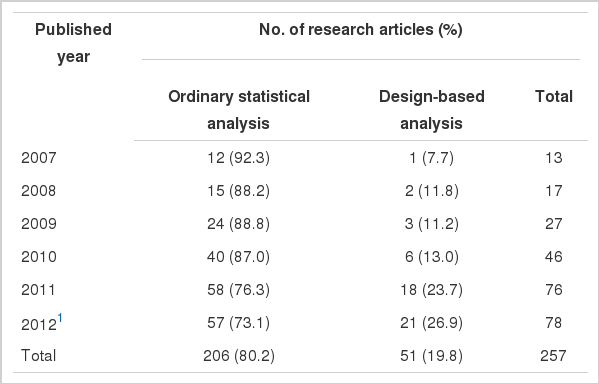
Table 2 lists the differences in point estimates and standard errors of means between the un-weighted and weighted analyses by gender and age group. Not only did the means differ between the two analyses, but the standard errors in the weighted analyses also tended to be larger compared to those in the un-weighted analyses.
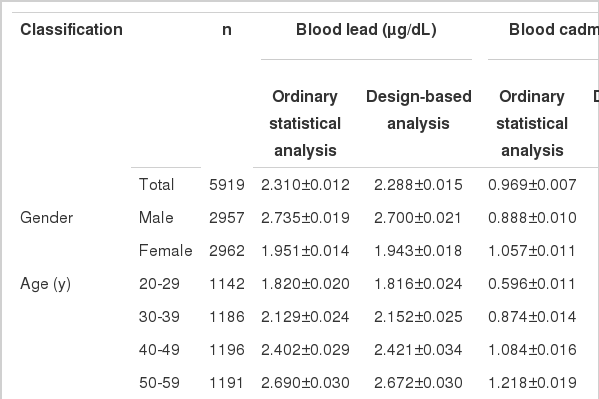
Comparison of geometric mean±standard error of blood metals between ordinary statistical data analysis and designbased analysis by gender, age groups in Korean adult population
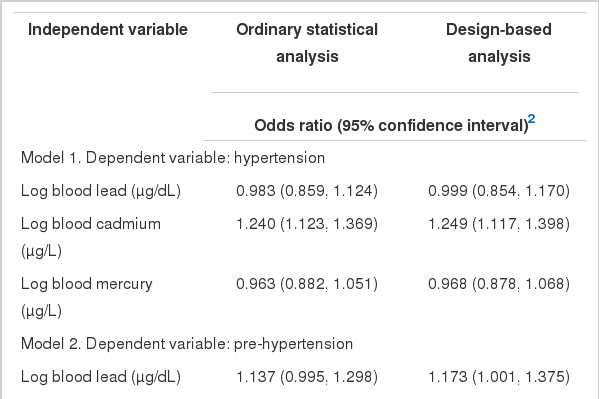
ORs and 95% CIs for hypertension and prehypertension were calculated for log-transformed blood metal levels after adjusting for covariates (Table 3). The covariates for models 1 and 2 were gender, age, residence area, education level, smoking and drinking status, hemoglobin, and serum creatinine. In a logistic regression analysis using log-transformed blood cadmium as a continuous independent variable after covariate adjustment, the ORs and 95% CIs for hypertension with a doubling of blood cadmium were 1.240 (1.123 to 1.367) and 1.249 (1.117 to 1.398) in the ordinary statistical data analyses and design-based data analyses, respectively. However, a logistic regression analysis using log-transformed blood cadmium as a continuous independent variable after covariate adjustment revealed that the ORs and 95% CIs for pre-hypertension with a doubling of blood cadmium were 1.295 (1.178 to1.423) and 1.279 (1.147 to 1.426) in ordinary statistical data analyses and design-based analyses, respectively. While log-transformed blood lead did not exhibit any significant association with hypertension or prehypertension in logistic regression analyses regardless of type of analysis, log-transformed blood mercury exhibited a significant protective effect on prehypertension in un-weighted ordinary logistic regression analyses, while weighted design-based analyses did not reveal any significant associations between blood mercury and prehypertension.
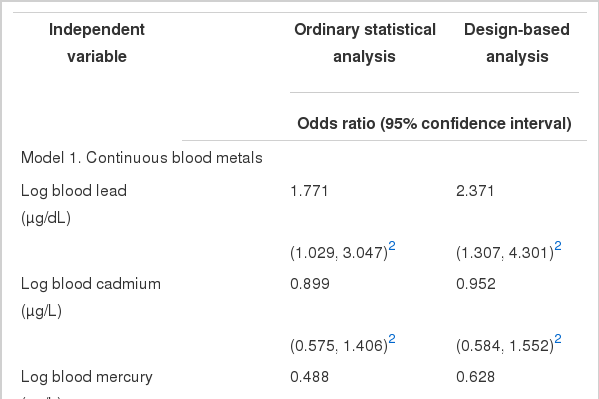
Finally, Table 4 lists logistic regression analyses of blood metals on osteoporosis in menopausal women by ordinary statistical data analyses and design-based analyses. In the logistic regression analyses using log-transformed metals as a continuous independent variable after covariate adjustment, the ORs for osteoporosis with doubled blood lead were statistically significant between two types of analyses. The doubled blood mercury had a statistically significant OR (0.488: 0.320 to 0.743) in ordinary statistical data analyses, but no association was observed between blood mercury and osteoporosis in the design-based analysis. Similar findings were observed in logistic regression analyses using quartiles of blood mercury as an independent variable for osteoporosis. The OR (95% CI) of the highest quartile of blood mercury in ordinary statistical data analyses was 0.450 (0.251 to 0.808) with statistical significance; in design-based analyses, it was 0.575 (0.281 to 1.181) with no statistical significance.
DISCUSSION
Large-scale health surveys including the KNHANES and the US NHANES are increasingly being used to investigate associations between risk factors of diseases, nutritional status, and health-related outcomes [15-17]. Because these surveys record many variables for a large number of individuals, they enable many hypotheses to be addressed, some of which may not even be formulated until years after the surveys have been completed. Additionally, these surveys are frequently population-based, thereby avoiding the potential biases of hospital-based studies [3].
Generally, these large-scale health surveys use complex probability procedures, such as stratification, multiple stages of cluster selection, and oversampling to obtain a representative sample of the target population [5,18,19]. Because of these sampling procedures, analyses of these data using traditional statistical software (such as SPSS or SAS) that use ordinary and generalized least squares estimation techniques tend to result in an underestimated standard error, inappropriate confidence intervals, and misleading tests of significance [20]. Until a decade ago, many analysts of data collected in sample surveys felt comfortable using standard procedures in statistical software packages to analyze the data. These standard procedures were based on the assumption that the data being analyzed emerged from a simple random sample of the population of interest, where all sample respondents were randomly selected without replacement from the population, and all respondents had equal probability of being included in the sample [21]. During the last several decades, many survey data analysts have expressed their concerns that survey data were being analyzed using standard statistical procedures instead of specific procedures based on survey design [6,8].
In Korea, many research articles using KNHANES data have been published in peer-reviewed journals since the Korea Centers for Disease Control and Prevention released the KNHANES dataset to the research community in 2007, and the number of research articles using KNHANES data has increased remarkably over the last six years. The KNHANES provides a good source of data for studying the relationship between nutritional status, food habits, environmental factors, and health-related outcomes. Even though the proportion of weighted research articles has increased from 7.7% in 2007 to 26.9% in 2012, the majority of peer-reviewed research articles using KNHANES data cited in PubMed did not use appropriate analyses. Standard statistical analyses that do not use weighted multiple complex survey data generally 1) yield biased point estimates of population parameters, 2) underestimate the standard error for point estimates, 3) produce overly-narrow confidence intervals on population parameters, and 4) yield tests of significance that are overly likely to reject the null hypothesis because standard error or variability of statistics is generally underestimated, resulting in more frequent type I errors [3,6,20,22].
This study compared ordinary statistical data analyses without sampling weight and design-based (data analyzed using special survey design statistical procedures) GMs and their standard errors by gender and age group (Table 2). As anticipated, the GMs differed between the two groups, and standard errors of data based on weighted analyses were larger than those based on un-weighted data analyses. Clearly, ordinary statistical un-weighted GMs and standard errors are not the same as design-based GMs and standard errors, and ordinary un-weighted GMs and standard errors cannot be used as an alternative to weighted GMs in analyses of survey data [23].
The failure of data analysts to use appropriate statistical software procedures for unbiased analyses of survey data essentially negates the considerable money and effort needed to collect the data, and can result in scientific publications that present skewed pictures of populations of research interest [21]. Un-weighted analyses of complex multi-stage cluster sampling data tend to have a narrow confidence interval, which creates biased and skewed results and generates a type I error. This study illustrated that un-weighted data analyses generated incorrect conclusions, for example that blood mercury is associated with a protective effect on prehypertension (Table 3, model 2) in an adult population and is associated with having osteoporosis among menopausal women (Table 4); these results were due to the narrow confidence intervals.
The cross-sectional nature of most survey designs like KNHANES makes it difficult to draw causal associations between health-related outcomes and certain independent variables, including heavy metals such as blood mercury. The survey data can only provide statistical associations through conservative and appropriate statistical analysis and plausible scientific justification. In this study, blood mercury was a significant predictor for the prevention of osteoporosis among menopausal women using an un-weighted analysis. This finding reconfirmed a recent publication regarding this topic, which claimed that high blood mercury has a protective effect for osteoporosis among Korean menopausal women [24]. The authors analyzed 481 postmenopausal women who participated in KNHANES 2008 and underwent bone mineral density measurement. We reanalyzed the data on these subjects using the same analysis format, but were unable to recreate the results due to the total number of menopausal women who were eligible for their inclusion criteria (menopausal and measurement of bone mineral density). In 2008, KNHANES only measured the bone mineral density of the participants who were enrolled in the later part of the survey (about 50% of all participants). Therefore, we analyzed two years of data (2008 to 2009) including 567 postmenopausal women and obtained the same results of protective effect of mercury for osteoporosis using an ordinary statistical data analysis without sampling weight, but failed to obtain statistical significance in design-based statistical analysis. The KNHANES measured total blood mercury, which included mainly organic mercury with a small portion of inorganic mercury. Because most organic mercury comes from foods including various fishes, high levels of fish consumption may be beneficial from a nutritional standpoint, but may also increase blood mercury levels. Therefore, it is unclear whether high blood mercury has a protective effect on osteoporosis. It is possible that the blood mercury level is simply another unknown index of fish consumption.
Table 3, model 1, reveals no differences between the ordinary statistical data analysis and design-based analysis. This is the most desirable outcome for an un-weighted analysis of survey data. In the past, it was common to use ordinary statistical procedures due to the lack of availability of statistical software capable of more complex analyses. However, during the last two decades, suitable software has become available and is easily incorporated into ordinary statistical packages such as SAS, SPSS, and STATA. Therefore, analysts cannot claim the scarcity of software tools as a justification for using ordinary statistical packages, which treat the sample design as simple random sampling [6,8].
Two basic approaches are generally available for the analysis of survey design data: design- and model-based approaches [6,25]. Design-based analysis incorporates all the characteristics of multiple complex sampling designs (weighting, stratification, clustering, and post-stratification) and is the standard analysis method in the majority of national survey designs [26-28]. In contrast, model-based analysis does not use sample weighting, but instead uses a standard statistical method that considers weighting, stratification, and clustering in the modeling. As long as the model describes every possible observation to explain relationships accurately, model-based analysis can ignore the complexity of survey design, even for weighted correlated data. Unfortunately, theoretically derived models known to hold for all observations often do not exist for survey situations, unlike those derived from the physical sciences [6,8].
Over the past 10 years, many researchers in the health sciences have become interested in conducting secondary analyses using data from complex sample surveys. These analyses are descriptive, analytical, hypothesis-generating, or model-building. Sample survey statisticians are aware that specialized software should be used to analyze complex sample survey data, particularly when analyses are descriptive or analytical and the survey design includes clustering [20]. Until recently, some analysts in Korea thought that un-weighted ordinary statistical data analysis was the same as model-based analysis, and did not require sample weighting [29-31]. The lack of awareness about the necessity of using weighted analysis in survey design analysis resulted in biased estimates, generating model misspecification and type I errors in the majority of published articles using the KNHANES in Korea.
Given the inherent nature of multiple complex survey design, the NHANES and KNHANES provide specific guidelines for analysis and reporting of sample weights, and state that the stratification and clustering of the design must be incorporated into the analysis to obtain accurate estimates and standard errors. The guidelines warn that ignoring the complex design will lead to biased estimates and overstated significance levels [10,11]. Hahs-Vaughn et al. [32] reviewed methodological considerations in using complex survey data from the Head Start Family and Child Experiences Survey. They warned that failing to address survey design issues resulted in underestimated standard errors and biased parameters. To avoid methodological problems in survey design data analyses, they recommended reporting practices for authors, editorial board members, and editors to assist in ensuring transparency and greater ease in replication when using complex sample data. Their recommendations for authors were as follows: 1) specify the survey weight applied during the analyses to correct for disproportionate sampling; 2) if a design-based approach is followed, specify how variances have been estimated; 3) if the complex sample design is not addressed in the analyses, provide information to help the reader understand why that choice was appropriate and how it affects interpretation of the results.
The recommendations for authors should be implemented as part of the journal's manuscript submission guidelines. Their recommendations for journal editors were as follows: 1) require authors to report the survey weights and variance estimation method when their manuscript includes analyses of complex sample data; 2) providing resources to the editorial board, such as a manuscript or other primer [15] that provides information about complex survey data and can be a helpful tool when reviewing manuscripts that have analyzed this type of data. The analysis guidelines of data providers such as NHANES and KNHANES that incorporate a multiple complex sampling design must be followed; if not, any use of other analysis methods must be justified scientifically, as with model-based analysis, which uses standard statistical methods that consider survey design complexity, such as stratification, clustering, and non-response.
Although two basic approaches are generally available, it should be noted that there may be three possible statistical methods for handling the data of a multistage complex sampling survey design : the first is the un-weighted ordinary statistical method that takes into account neither complex sample survey design nor sample weights; the second is the weighted ordinary statistical method without consideration of the complex sample survey design; the last is incorporating sample weights and properly taking into consideration complex sample survey design. However, we were not able to identify the second method due to the lack of information on statistical methods provided by the reviewed studies. Instead, we classified both the first and second methods as ordinary statistical analysis, and the last one as design-based analysis. This is a limitation of the present study.
The emerging new era of data analysis using the KNHANES promises a bright future for health and nutrition-related scientific research in Korea, which will eventually increase our knowledge and contribute to a better understanding of human health. As the survey data accumulate annually, the richness of the data for more in-depth analysis becomes increasingly apparent. The demand for taking fuller advantage of such a rich data source is increasing, but it is vital to ensure sound scientific justification and awareness of the limitations of the survey design data. Thus, appropriate statistical analysis that incorporates the sample survey design needs to be mandatory.
Notes
The authors have no conflicts of interest with the material presented in this paper.