
Articles
- Page Path
- HOME > J Prev Med Public Health > Volume 54(4); 2021 > Article
-
Original Article
Associations Between Compliance With Non-pharmaceutical Interventions and Social-distancing Policies in Korea During the COVID-19 Pandemic -
Yu Seong Hwang
 , Heui Sug Jo
 -
Journal of Preventive Medicine and Public Health 2021;54(4):230-237.
DOI: https://doi.org/10.3961/jpmph.21.139
Published online: June 16, 2021
Department of Health Policy and Management, Kangwon National University School of Medicine, Chuncheon, Korea
- Corresponding author: Heui Sug Jo Department of Health Policy and Management, Kangwon National University School of Medicine, 1 Kangwondaehak-gil, Chuncheon 24341, Korea E-mail: joheuisug@gmail.com
Copyright © 2021 The Korean Society for Preventive Medicine
This is an Open Access article distributed under the terms of the Creative Commons Attribution Non-Commercial License (http://creativecommons.org/licenses/by-nc/4.0/) which permits unrestricted non-commercial use, distribution, and reproduction in any medium, provided the original work is properly cited.
ABSTRACT
-
Objectives:
- This study explored changes in individuals’ behavior in response to social distancing (SD) levels and the “no gatherings of more than 5 people” (NGM5) rule in Korea during the coronavirus disease 2019 (COVID-19) pandemic.
-
Methods:
- Using survey data from the COVID-19 Behavior Tracker, exploratory factor analysis extracted 3 preventive factors: maintenance of personal hygiene, avoiding going out, and avoiding meeting people. Each factor was used as a dependent variable. The chi-square test was used to compare differences in distributions between categorical variables, while binary logistic regression was performed to identify factors associated with high compliance with measures to prevent transmission.
-
Results:
- In men, all 3 factors were significantly associated with lower compliance. Younger age groups were associated with lower compliance with maintenance of personal hygiene and avoiding meeting people. Employment status was significantly associated with avoiding going out and avoiding meeting people. Residence in the capital area was significantly associated with higher compliance with personal hygiene and avoiding venturing out. Increasing SD levels were associated with personal hygiene, avoiding going out, and avoiding meeting people. The NGM5 policy was not significantly associated with compliance.
-
Conclusions:
- SD levels, gender, age, employment status, and region had explanatory power for compliance with non-pharmaceutical interventions (NPIs). Strengthening social campaigns to inspire voluntary compliance with NPIs, especially focused on men, younger people, full-time workers, and residents of the capital area is recommended. Simultaneously, efforts need to be made to segment SD measures into substrategies with detailed guidance at each level.
- Human and economic losses from coronavirus disease 2019 (COVID-19) since 2019 have been substantial; as of May 2, 2021, 222 countries and international territories have reported over 152 million cases and over 3.2 million deaths from COVID-19 [1]. During this period, 122 000 cases and 1800 deaths have been reported in Korea. Other countries that took countermeasures too late or indecisively had to implement rigorous lockdowns in the early phase of the pandemic. Conversely, Korea quickly organized intensive mass testing and contact tracing and did not impose a complete lockdown [2,3]. Instead, the Korea Disease Control and Prevention Agency (KDCA; formerly Korea Centers for Disease Control and Prevention) promptly introduced non-pharmaceutical interventions (NPIs) such as handwashing, covering the mouth with sleeves when coughing, avoiding touching the eyes or nose with unwashed hands, wearing masks, and not visiting crowded places [4]. In addition, starting in June 2020, the KDCA enforced a social distancing (SD) system consisting of 5 levels (levels 1, 1.5, 2, 2.5, and 3) containing differentiated preventive measures in each level.
- The KDCA adjusted the grading of levels based on the characteristics and intensity of newly confirmed cases. When the second wave of the pandemic began, the KDCA upgraded the SD level of the capital area to level 2 (on August 16, 2020) and strengthened level 2 (on August 26, 2020) for mitigation. It subsequently downscaled the level to 1 (on October 12, 2020) after the end of the second wave. During the third wave, the SD level of the capital area was increased gradually to level 1.5 (on November 19, 2020), level 2 (on November 24, 2020), and level 2.5 (on December 8, 2020). The December 8, 2020, increase was coupled with a simultaneous increase in SD to level 2 in non-capital areas. Nonetheless, the third wave was not sufficiently controlled and new cases surged to over 1000 per day in late December 2020. Therefore, the KDCA enacted the “no gatherings of more than 5 people” (NGM5) policy, prohibiting private gatherings of more than 5 people, irrespective of region. When the number of 7-day moving average cases declined to under 400 by January 26, 2021, the KDCA downscaled the SD level to 2 for the capital area and 1.5 for non-capital areas [4].
- The adjustment in SD policies was evaluated as being effective in controlling the number of new cases in Korea and other countries [5-9]. However, fluctuations in the number of new confirmed cases might be a result of a combination of elements, such as public compliance with NPIs, the management of highrisk facilities (e.g., care centers and hospitals), quarantine protocols, seasonal effects, and vaccination. Furthermore, the success of SD measures thoroughly depends on people’s voluntary participation [10,11]. Previous studies also emphasized the importance of guiding people’s behaviors to prevent and control the spread of COVID-19 [12,13]. Therefore, the effectiveness of SD policies should be assessed by judging changes in individuals’ compliance, rather than based on the number of new confirmed cases. Nonetheless, limited data are available regarding how individuals’ behavior has changed in response to SD levels or the implementation of NGM5 over the past year.
- Therefore, this study examined the association between compliance with NPIs and SD policies (i.e., SD levels and NGM5) in Korea with repeatedly and representatively surveyed data. This study also investigated how socio-demographic characteristics (e.g., gender, age, generation, employment status, and area of residence) determined compliance with NPIs. Its findings and outcomes are expected to provide basic data for planning viable policies with the goal of overcoming COVID-19.
INTRODUCTION
- Data
- Publicly available data from the Imperial College London’s YouGov COVID-19 Behavior Tracker Data Hub were used for this study. These data were made accessible for academic research purposes on the GitHub webpage [14]. The Centre for Health Policy of the Institute of Global Health Innovation took charge of collecting and releasing related reports.
- Surveys in Korea have been conducted to assess subjective well-being [15], perception of danger [16] and life changes [17] in the context of the COVID-19 pandemic. The data in this research were also suitable for assessing people’s compliance with NPIs, given that the data were collected between April 2020 and April 2021, repeatedly (24 times) using the same questions for compliance with NPIs. Since the survey was regularly conducted over the past year, it is believed that the data from the survey could shed light on changes in behavior according to SD levels in Korea. Prior studies have also evaluated the strength of the accumulated data from Imperial College London [18-21].
- A total of 13 300 individuals responded to this survey. Although the data were collected over 1 year, these were cross-sectional data, as the survey did not follow the same set of people weekly. The responses were collected considering demographic characteristics (e.g., gender, age, and region). The data contained numerous questions related to COVID-19: wearing a face mask, contact tracing, diagnosis of health conditions, lifestyle, perceptions of vaccination, and compliance with NPIs.
- Variables
- The items used to explain compliance with NPIs comprised questions on behavioral patterns 7 days prior to responding to the survey, for example, “How often have you taken the following measures to protect yourself or others from COVID-19?” Of 20 items, 16 were utilized since 4 were not mentioned since January 2021. The answers to each of the items were coded as follows: 1=always, 2=frequently, 3=sometimes, 4=rarely, 5=not at all. However, we inversely coded answers to ensure that higher compliance was assigned a higher numerical value. The factors representing compliance with NPIs were analyzed using exploratory factor analysis. The Kaiser-Meyer-Olkin test yielded a value of 0.930, and the Bartlett’s test of sphericity was significant (p<0.001). Among the 16 items used, 5 were eliminated because they had a low factor loading (<0.5) (Supplemental Material 1).
- The results of the rotated principal component analysis were summarized as the following 3 factors: (1) Personal hygiene (5 items): wearing a face mask outside home, washing one’s hands with soap and water, using hand sanitizer, covering one’s nose and mouth when sneezing and coughing, and avoiding crowded areas. (2) Avoiding going out (3 items): avoiding going out in general, avoiding working outside one’s home, and avoiding going to shops. (3) Avoiding meeting people (3 items): avoiding small social gatherings (of no more than 2 people), avoiding medium-sized social gatherings (of 3 to 10 people), and avoiding large social gatherings (of more than 10 people).
- To calculate the values for each factor, the value of the component items was averaged and modified into a binary category. If the value was above the average value of all the responses, it was marked as high (=1); if it was below average, it was marked as low (=0). These values were used as dependent variables for the chi-square test and binary logistic regression analysis. The second factor had 9331 participant records because its component item (9) “avoided working outside your home,” was not relevant to unemployed participants. Therefore, the item did not apply to them.
- We generated the variable of SD level and merged the corresponding SD level into each response in accordance with the date and region of respondents. NGM5 was enforced on December 23, 2020 in the capital area. Subsequently, it was extended to non-capital areas on January 4, 2021. The NGM5 variable was coded into a binary response. Information on SD level adjustment and the commencement date of NGM5 was gathered from the webpage of the KDCA [22]. A variable named “region” was provided in the format of province names and recategorized into 2 categories—the capital area (i.e., Seoul Metropolitan City, Gyeonggi Province, and Incheon Metropolitan City) and non-capital areas (i.e., elsewhere)—reflecting the dichotomization used by the KDCA for SD levels.
- Statistical Analysis
- In order to extract dependent variables, exploratory factor analysis was conducted. The chi-square test was used to compare differences in distributions between categorical variables, while binary logistic regression was performed to identify factors associated with a high extent of compliance with NPIs. Associations were quantified using odds ratios (ORs) with 95% confidence intervals (CIs). All statistical analyses were conducted using IBM SPSS version 24.0 (IBM Corp., Armonk, NY, USA).
- Ethics Statement
- This study does not have an institutional review board approval number since it uses secondary data.
METHODS
- Table 1 shows the general characteristics of 13 300 participants according to the 3 preventive factors. The mean age of participants was 43.20±14.26 years (range, 18 to 99). Participants included 7149 men (53.8%), 7741 full-time workers (58.2%), and 7086 residents of the capital area (53.3%). Furthermore, 4919 (37.0%) participants responded during SD stage 1, 1289 (9.7%) participants during stage 1.5, 5608 (42.2%) participants during stage 2, and 1484 (11.2%) participants during stage 2.5, while 8829 participants responded before the enactment of NGM5. All variables, except “region,” in the “avoiding meeting people” factor, showed significant differences between high and low compliance.
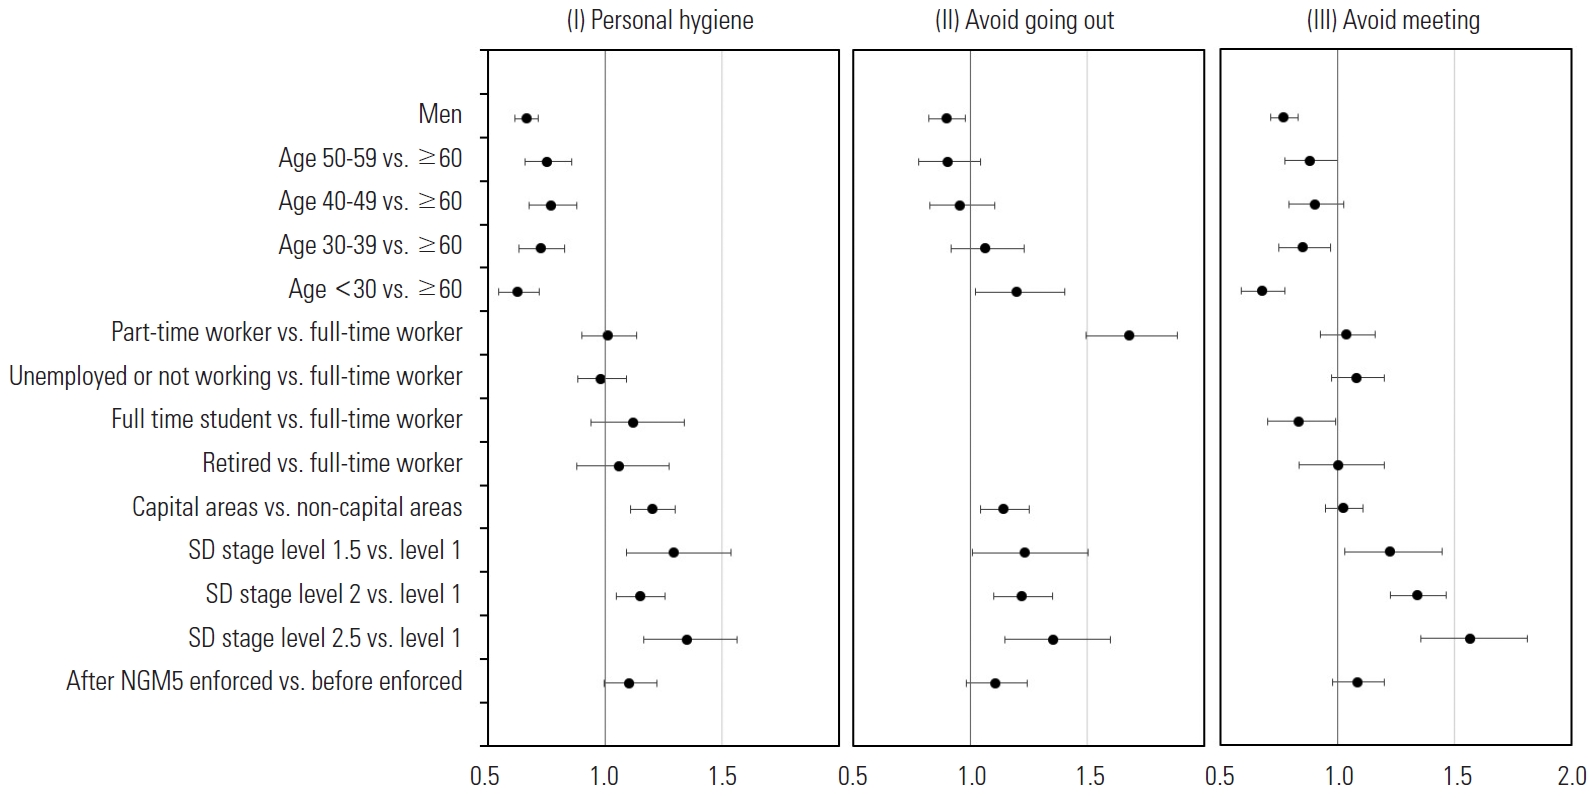
- Table 2 summarizes the associations of the 3 preventive factors and socio-demographic characteristics with and SD policies. Among men, all 3 factors (personal hygiene, avoiding going out, and avoiding meeting people) were significantly associated with decreased compliance (I: OR, 0.66; 95% CI, 0.61 to 0.71; II: OR, 0.90; 95% CI, 0.82 to 0.98; III: OR, 0.77; 95% CI, 0.71 to 0.83). Younger age groups were significantly associated with lower compliance with maintenance of personal hygiene (50-59: OR, 0.75; 95% CI, 0.66 to 0.86; 40-49: OR, 0.77; 95% CI, 0.67 to 0.88; 30-39: OR, 0.72; 95% CI, 0.63 to 0.83, <30: OR, 0.63; 95% CI, 0.55 to 0.72), and avoiding meeting people (50- 59: OR, 0.88; 95% CI, 0.77 to 1.00; 30-39: OR, 0.85; 95% CI, 0.75 to 0.97, <30: OR, 0.68; 95% CI, 0.59 to 0.77). However, compliance with avoiding going out was significantly more common among respondents under the age of 30 years than among those over 60 years (<30: OR, 1.20; 95% CI, 1.02 to 1.41).
- Employment status was significantly associated with avoiding going out (part-time workers: OR, 1.68; 95% CI, 1.49 to 1.88) and negatively associated with avoiding meeting people (students: OR, 0.83; 95% CI, 0.70 to 0.99). In addition, residence in the capital area was significantly associated with higher compliance with personal hygiene (OR, 1.20; 95% CI, 1.11 to 1.30) and avoiding going out (OR, 1.14; 95% CI, 1.04 to 1.25).
- As for the policy effects, increasing SD stages were positively associated with maintenance of personal hygiene (level 1.5: OR, 1.29; 95% CI, 1.09 to 1.54; level 2: OR, 1.15; 95% CI, 1.05 to 1.25; level 2.5: OR, 1.35; 95% CI, 1.17 to 1.56), avoiding going out (level 1.5: OR, 1.23; 95% CI, 1.01 to 1.50; level 2: OR, 1.22; 95% CI, 1.10 to 1.35; level 2.5: OR, 1.35; 95% CI, 1.15 to 1.60), and avoiding meeting other people (level 1.5: OR, 1.22; 95% CI, 1.03 to 1.45, level 2: OR, 1.34; 95% CI, 1.22 to 1.46; level 2.5: OR, 1.57; 95% CI, 1.35 to 1.81), respectively. However, the NGM5 policy was not significantly associated with the extent of compliance with anti-infection measures pertaining to COVID-19.
- Figure 1 shows forest plots for the associations of socio-demographic variables and government policies with the 3 compliance factors. The x-axis represents the OR, which is plotted on a logarithmic scale.
RESULTS
- This study researched associations between compliance with NPI and SD policies in Korea during the COVID-19 pandemic.
- All 3 preventive factors—(I) maintenance of personal hygiene, (II) avoiding going out, and (III) avoiding meeting people—were associated with SD levels. The magnitude of these associations was greater in level 2.5 than in levels 1 and 1.5. In particular, the probability of compliance with avoiding meeting people was 57% higher in level 2.5 than in level 1. The reason for this may be the imposition of intensive preventive measures such as prohibiting gatherings at various facilities and limitations or restrictions of opening hours in level 2.5.
- Conversely, the enactment of the NGM5 policy was not significantly associated with compliance toward preventive factors, including avoiding meeting people. This can be explained by the fact that people did not cancel gatherings to comply with the NGM5 policy. Instead, people kept gathering while complying with gathering-size guidelines (i.e., under 5 people) each time they met. This interpretation is supported by an announcement from the KDCA stating that the rate of infection from individual contacts had increased to 46% as of May 18, 2021—the highest this year [20]. Another possible explanation is that the standard of implementation in multiple-purpose facilities may not have been rigorous. The KDCA reported that mass infections occurred in bars, sports facilities, karaoke rooms, PC rooms, and public baths through contact with unknown people.
- Among the socio-demographic characteristics, men were more likely to have low compliance with respect to every preventive factor. Significantly, men participants were 34% less likely to belong to the high-compliance group for the “maintenance of personal hygiene” factor than women. The result of a previous study also revealed that young men demonstrated low compliance [23].
- The youngest age group (<30 years) was 37% less likely to belong to the high-compliance group for maintenance of personal hygiene and 32% less likely for avoiding meeting, but 20% more likely for avoiding going out. These figures seem to reflect socio-cultural factors. Younger people are familiar with the online environment that enables them to telecommute and engage in contact-free living (e.g. online shopping, food delivery services via mobile applications). Consequently, they have fewer reasons to have to go out as part of their regular routines.
- Part-time workers showed distinctly higher odds (68%) than full-time workers for compliance with avoiding going out, meaning that full-time workers more frequently “went out.” Therefore, strategies that help full-time workers to lessen physical contact regarding work need to be considered, including the extension of telecommuting and online meetings, as well as adjustments of the commute time to avoid overcrowded public transportation.
- In addition, students were more likely to have low compliance with avoiding meeting people than full-time workers. Therefore, as prior studies have suggested [24,25], there is a need for social movements promoting telecommuting and strengthening of the online learning system.
- Living in the capital area increased participants’ chances of belonging to the high-compliance group for maintenance of personal hygiene by 20%, as well as the chances of belonging to the high compliance group for avoiding going out by 14%. This might have been because the KDCA applied an enhanced level of SD in the capital area. Conversely, living in the capital area did not contribute to avoiding meeting people. Therefore, compliance with the measures included in the “avoiding meeting people” factor should be emphasized.
- This study has several limitations. Since this study used secondary data, there remains the limitation of a lack of information on confounding factors (e.g., economic status, professions, religion, etc.), as well as potential issues regarding the validity of self-reported data the possibility of recall bias. Further, we assumed the survey data to be cross-sectional. However, the survey continued for a year (April 2020 to April 2021). Therefore, the model may have a limited power of explanation for causal relationships among variables and the time-varying effects of prolonged COVID-19 diffusion. Moreover, the effects of mass media on compliance rates were not fully considered. However, we tried to take account of time-varying effects by including variables such as SD stages, as well as regions where SD stages and the NGM5 policy were applied, since each SD stage corresponds to a definite standard of preventive measures.
- SD levels, gender, age, employment status, and region had explanatory power for compliance with NPIs. Strengthening SD campaigns to inspire the public to voluntarily comply with NPIs, with a particular focus on younger, full-time men workers, and residents of the capital area, is recommended. Simultaneously, efforts should be made to segment SD measures into substrategies with detailed guidance at each level.
DISCUSSION
SUPPLEMENTAL MATERIALS
-
CONFLICT OF INTEREST
The authors have no conflicts of interest associated with the material presented in this paper.
-
FUNDING
None.
Notes
ACKNOWLEDGEMENTS
-
AUTHOR CONTRIBUTIONS
Conceptualization: HSJ. Data curation: YSH. Formal analysis: YSH. Funding acquisition: None. Methodology: YSH. Project administration: HSJ. Visualization: YSH. Writing – original draft: YSH. Writing – review & editing: HSJ, YSH.
Notes
- 1. Worldometer. COVID-19 coronavirus pandemic. [cited 2021 Apr 26]. Available from: https://www.worldometers.info/coronavirus
- 2. Pearce N, Lawlor DA, Brickley EB. Comparisons between countries are essential for the control of COVID-19. Int J Epidemiol 2020;49(4):1059-1062ArticlePubMed
- 3. Moradi H, Vaezi A. Lessons learned from Korea: COVID-19 pandemic. Infect Control Hosp Epidemiol 2020;41(7):873-874ArticlePubMed
- 4. Korea Disease Control and Prevention Agency. The state of COVID-19 infection domestic outbreak. 2020 Apr 26 [cited 2021 Apr 30]. Available from: https://www.kdca.go.kr/board/board.es?mid=a20501010000&bid=0015 (Korean)
- 5. Cowling BJ, Ali ST, Ng TW, Tsang TK, Li JC, Fong MW, et al. Impact assessment of non-pharmaceutical interventions against coronavirus disease 2019 and influenza in Hong Kong: an observational study. Lancet Public Health 2020;5(5):e279-e288ArticlePubMedPMC
- 6. Flaxman S, Mishra S, Gandy A, Unwin HJ, Mellan TA, Coupland H, et al. Estimating the effects of non-pharmaceutical interventions on COVID-19 in Europe. Nature 2020;584(7820):257-261PubMed
- 7. Imai N, Gaythorpe KA, Abbott S, Bhatia S, van Elsland S, Prem K, et al. Adoption and impact of non-pharmaceutical interventions for COVID-19. Wellcome Open Res 2020;5: 59ArticlePubMedPMC
- 8. Kim S, Ko Y, Kim YJ, Jung E. The impact of social distancing and public behavior changes on COVID-19 transmission dynamics in the Republic of Korea. PLoS One 2020;15(9):e0238684ArticlePubMedPMC
- 9. Min KD, Kang H, Lee JY, Jeon S, Cho SI. Estimating the effectiveness of non-pharmaceutical interventions on COVID-19 control in Korea. J Korean Med Sci 2020;35(35):e321ArticlePubMedPMC
- 10. Chudik A, Pesaran MH, Rebucci A. Voluntary and mandatory social distancing: evidence on COVID-19 exposure rates from Chinese provinces and selected countries. Working paper; 27039 [cited 2021 Apr 1]. Available from: https://www.nber.org/papers/w27039ArticlePubMed
- 11. Lee M, You M. Psychological and behavioral responses in South Korea during the early stages of coronavirus disease 2019 (COVID-19). Int J Environ Res Public Health 2020;17(9):2977ArticlePubMedPMC
- 12. Shiina A, Niitsu T, Kobori O, Idemoto K, Hashimoto T, Sasaki T, et al. Relationship between perception and anxiety about COVID-19 infection and risk behaviors for spreading infection: a national survey in Japan. Brain Behav Immun Health 2020;6: 100101ArticlePubMedPMC
- 13. Serwaa D, Lamptey E, Appiah AB, Senkyire EK, Ameyaw JK. Knowledge, risk perception and preparedness towards coronavirus disease-2019 (COVID-19) outbreak among Ghanaians: a quick online cross-sectional survey. Pan Afr Med J 2020;35(Suppl 2):44Article
- 14. Jones SP; Imperial College London Big Data Analytical Unit; YouGov Plc. Imperial College London YouGov Covid 19 Behaviour Ttracker Data Hub. 2020 [cited 2020 Nov 3]. Available from: https://github.com/YouGov-Data/covid-19-tracker
- 15. Helliwell JF, Richard Layard R, Jeffrey Sachs J, De Neve JE. World happiness report. 2020 Nov 3]. Available from: https://worldhappiness.report/ed/2020/
- 16. Ministry of Health and Welfare. The state of COVID-19 infection domestic outbreak. 2020 May 5 [cited 2021 May 15]. Available from: http://ncov.mohw.go.kr/tcmBoardView.do?contSeq=354106 (Korean)
- 17. Won JS, Ko Y, Park JH, So SH, Choi SH, Lee SK. Key findings of the 2020 Korea Community Health Survey. Public Health Wkly Rep 2021;14(20):1338-1351. (Korean)
- 18. Dabla-Norris E, Khan H, Lima F. IMF working papers: what determines social distancing? Evidence from advanced and emerging market economies. 2021 [cited 2021 Jul 1]. Available from: https://www.imf.org/en/Publications/WP/Issues/2021/05/01/What-Determines-Social-Distancing-Evidence-from-Advanced-and-Emerging-Market-Economies-50281
- 19. Chin V, Ioannidis JP, Tanner MA, Cripps S. Effect estimates of COVID-19 non-pharmaceutical interventions are non-robust and highly model-dependent. J Clin Epidemiol 2021;136: 96-132ArticlePubMedPMC
- 20. Ng JH, Tan EK. COVID-19 vaccination and cultural tightness. Psychol Med 2021;1-2Article
- 21. Ferguson N, Laydon D, Nedjati Gilani G, Imai N, Ainslie K, Baguelin M, et al. Report 9: impact of non-pharmaceutical interventions (NPIs) to reduce COVID19 mortality and healthcare demand. 2020 [cited 2021 Jul 1]. Available from: https://spiral.imperial.ac.uk/handle/10044/1/77482
- 22. Kwon SH. KDCA “Ratio of individual contact pointed the highest rate 46%”. Yonhap News; 2021 May 18 [cited 2021 May 19]. Available from: https://www.yna.co.kr/view/AKR20210518030100530?input=(Korean)
- 23. Nivette A, Ribeaud D, Murray A, Steinhoff A, Bechtiger L, Hepp U, et al. Non-compliance with COVID-19-related public health measures among young adults in Switzerland: insights from a longitudinal cohort study. Soc Sci Med 2021;268: 113370ArticlePubMed
- 24. Onyeukwu PE, Adeniyi A, Amin HJ. Telecommuting: a panacea to COVID-19 spread in Nigerian universities. Int J Innov Econ Dev 2020;6(1):47-60Article
- 25. Mishra L, Gupta T, Shree A. Online teaching-learning in higher education during lockdown period of COVID-19 pandemic. Int J Educ Res Open 2020;1: 100012ArticlePubMedPMC
REFERENCES
Figure & Data
References
Citations
- Behavioural Sciences Contribution to Suppressing Transmission of Covid-19 in the UK: A Systematic Literature Review
Gill Hubbard, Chantal den Daas, Marie Johnston, Jennifer Dunsmore, Mona Maier, Rob Polson, Diane Dixon
International Journal of Behavioral Medicine.2024; 31(1): 1. CrossRef - Real-time forecasting of COVID-19 spread according to protective behavior and vaccination: autoregressive integrated moving average models
Chieh Cheng, Wei-Ming Jiang, Byron Fan, Yu-Chieh Cheng, Ya-Ting Hsu, Hsiao-Yu Wu, Hsiao-Han Chang, Hsiao-Hui Tsou
BMC Public Health.2023;[Epub] CrossRef - The Unequal Effects of Social Distancing Policy on Subway Ridership during the COVID-19 Pandemic in Seoul, South Korea
Jaeyoung Ha, Suyoung Jo, Hee-kyoung Nam, Sung-il Cho
Journal of Urban Health.2022; 99(1): 77. CrossRef - Do the Self-Reported Changes in Physical Activity After the Emergence of the COVID-19 Pandemic Associate With Major Depression According to Moderate to Vigorous Physical Activity Status?
Jeong Hyun Ahn, Jin Young Nam
Journal of Physical Activity and Health.2022; 19(7): 518. CrossRef - Different patterns of excess all-cause mortality by age and sex in Hungary during the 2nd and 3rd waves of the COVID-19 pandemic
Vince Fazekas-Pongor, Zsófia Szarvas, Norbert D. Nagy, Anna Péterfi, Zoltán Ungvári, Viktor J. Horváth, Szilvia Mészáros, Adam G. Tabák
GeroScience.2022; 44(5): 2361. CrossRef - Generic Logic Model for Coronavirus Disease-2019 Responses Based on the South Korean Experience
Hae-ryoung Chun, Kyuhyun Yoon, Hana Kim, Eunsil Cheon, Jaeyoung Ha, Sangwoo Tak, Sung-il Cho
Risk Management and Healthcare Policy.2021; Volume 14: 4765. CrossRef
 PubReader
 ePub Link
 Cite
Cite- Figure
-

- Related articles
-
- Utilization of the Unlinked Case Proportion to Control COVID-19: A Focus on the Non-pharmaceutical Interventional Policies of the Korea and Japan
- Associations Between Conventional Healthy Behaviors and Social Distancing During the COVID-19 Pandemic: Evidence From the 2020 Community Health Survey in Korea

