
Articles
- Page Path
- HOME > J Prev Med Public Health > Volume 54(2); 2021 > Article
-
Original Article
Factors Related to Regional Variation in the High-risk Drinking Rate in Korea: Using Quantile Regression -
Eun Su Kim1
 , Hae-Sung Nam2
 -
Journal of Preventive Medicine and Public Health 2021;54(2):145-152.
DOI: https://doi.org/10.3961/jpmph.20.507
Published online: March 16, 2021
1Department of Public Health, Graduate School, Chungnam National University, Daejeon, Korea
2Department of Preventive Medicine and Public Health and Research Institute for Medical Sciences, Chungnam National University College of Medicine, Daejeon, Korea
- Corresponding author: Hae-Sung Nam Department of Preventive Medicine and Public Health and Research Institute for Medical Sciences, Chungnam National University College of Medicine, 266 Munhwa-ro, Jung-gu, Daejeon 35015, Korea E-mail: hsnam@cnu.ac.kr
Copyright © 2021 The Korean Society for Preventive Medicine
This is an Open Access article distributed under the terms of the Creative Commons Attribution Non-Commercial License (http://creativecommons.org/licenses/by-nc/4.0/) which permits unrestricted non-commercial use, distribution, and reproduction in any medium, provided the original work is properly cited.
ABSTRACT
-
Objectives:
- This study aimed to identify regional differences in the high-risk drinking rate among yearly alcohol users in Korea and to identify relevant regional factors for each quintile using quantile regression.
-
Methods:
- Data from 227 counties surveyed by the 2017 Korean Community Health Survey (KCHS) were analyzed. The analysis dataset included secondary data extracted from the Korean Statistical Information Service and data from the KCHS. To identify regional factors related to the high-risk drinking rate among yearly alcohol users, quantile regression was conducted by dividing the data into 10%, 30%, 50%, 70%, and 90% quantiles, and multiple linear regression was also performed.
-
Results:
- The current smoking rate, perceived stress rate, crude divorce rate, and financial independence rate, as well as one’s social network, were related to the high-risk drinking rate among yearly alcohol users. The quantile regression revealed that the perceived stress rate was related to all quantiles except for the 90% quantile, and the financial independence rate was related to the 50% to 90% quantiles. The crude divorce rate was related to the high-risk drinking rate among yearly alcohol users in all quantiles.
-
Conclusions:
- The findings of this study suggest that local health programs for high-risk drinking are needed in areas with high local stress and high crude divorce rates.
- Excessive drinking can affect the physical and mental health of individuals and can also cause social harm. It can lead to domestic and sexual violence, as well as workplace problems, among other outcomes. Moreover, it can also cause enormous social losses [1]. In connection with this, the World Health Organization (WHO) states that the common risk factors for non-communicable diseases include smoking, unhealthy eating habits, and harmful drinking. Harmful drinking can cause confusion with regards to maintaining order not only among individuals and the families of drinkers, but also in local communities, and create an obstacle to personal and social development [2]. High-risk drinking is the most commonly used indicator of harmful drinking. The WHO defines high-risk drinking as daily alcohol intake of at least 60 g for male and 40 g or more for female [3]. The Korean Community Health Survey (KCHS) defines high-risk drinking as the consumption of alcohol more than twice a week, with an average of 7 drinks for male and 5 drinks for female at a time [4].
- In Korea, the drinking rate has either been static or has increased at certain points in time over the past 20 years. The overall high-risk drinking rate was 14.9% in 2017, with an increase of 2.1% from 5 years previously. In 2017, the high-risk drinking rate among yearly alcohol users also increased to 18.5%, reflecting a 0.1% increase from the previous year and a 2.5% increase from 5 years beforehand. The monthly drinking and high-risk drinking rates are steadily increasing [4].
- Increased research attention should be focused on high-risk drinking, both due to its relationship with health problems (e.g., cancer incidence) and to help prevent problems caused by drunk driving and other alcohol-related damages [5].
- It is acknowledged that the differences in health levels among regions in Korea are simultaneously influenced by both individual factors related to those who live in each region and contextual factors, such as the socioeconomic and physical environment of the region [6]. Along with this, as the concept of social epidemiology is being developed, recognition of the importance of addressing the gap in community health levels is growing [7]. Residents in the same residential areas have similar health problems, and these are affected by various factors in their communities. A residential area is affected by its social and psychological environment, traditional customs, and culture; thus, a community-level approach should effectively improve the health of residents in a community [8]. However, findings from existing multilevel analyses are difficult to apply to local health programs because typically the characteristics of individuals across entire regions are included, rather than the characteristics of individuals in localized regions [9-11]. Hence, further studies are needed to identify factors that vary across regions, taking into account both individual and regional factors for a community-level analysis.
- In addition, most studies have used multiple linear regression (MLR) analysis, which estimates a regression equation using the ordinary least-squares method, centering on mean values, and it is difficult to understand how related factors vary due to changes in dependent variables [9,10,12]. Quantile regression analysis is a complementary method, and it has the advantage of constructing a linear model around τ-quantiles to determine related factors for each quantile. This method can even be used when the normality and homoscedasticity required for regression analysis are violated [13]. Therefore, in this study, by analyzing factors related to the high-risk drinking rate among yearly alcohol users at the local community level using a quantile regression analysis, we intend to produce supporting data necessary for future regional health projects in Korea.
INTRODUCTION
- Data Sources
- This study used data provided by the KCHS, the Korea Statistical Information System (KOSIS), and the Local Finance 365 homepage (http://lofin.mois.go.kr/portal/main.do) operated by the Ministry of the Interior and Safety, in which 2017 data at the community-level were provided. Out of 229 counties nationwide, 227 were selected for analysis. The data of Jeju-si and Seogwipo-si were classified as administrative cities by the Ministry of the Interior and Safety and were excluded because the data collection of integral variables through the KOSIS was insufficient.
- The KCHS is a nationwide survey conducted through 254 public health centers annually since 2008; it selects sampling points through probability proportion-to-size systematic sampling [4]. The KCHS provides a standardization rate that directly standardizes sex and age, making it suitable for analyzing regional variation [14]. Hence, in this study, the standardization rate measured at the community-level was used for comparison between regions.
- Study Design
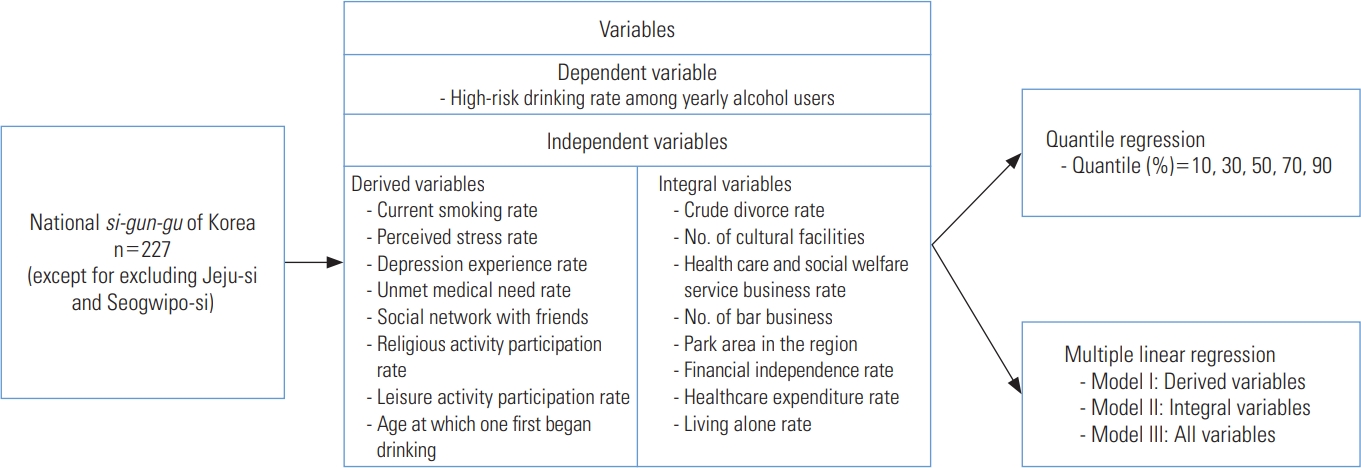
- Drinking is closely related to the socioeconomic environment and availability of alcohol in a community [15]. Therefore, we referred to the study of Jeong et al. [12], in which factors varying across regions were investigated using community-level variables, to derive variables that were reflective of the characteristics of individuals belonging to a particular region and integral variables that were reflective of a community’s environment. Considering these factors together, we sought to determine the factors associated with variation in the high-risk drinking rate among yearly alcohol users. Related variables such as sex and age were excluded because we employed the standardization parameters that were used by the KCHS. All variables used were secondary data, and this study adopted a cross-sectional design. The detailed study design is shown in Figure 1.
- Definition of Variables
- There are 2 categories of high-risk drinking rate indicators calculated in the KCHS: the overall high-risk drinking rate and the high-risk drinking rate among yearly alcohol users. This study used the high-risk drinking rate among yearly alcohol users, which was suggested as a target for the Health Plan 2020, as a dependent variable [16]. High-risk drinking was defined by the KCHS as “when the average amount of alcohol consumed at a time among those who have drunk during the last year is 7 or more drinks for male and 5 or more drinks for female, and when the rate of consumption exceeds twice a week.”
- The high-risk drinking rate of yearly drinkers by quintile was 12.5% in the bottom 10% quantile and 26.6% in the top 10% quantile, showing a very large gap. More details are in the Supplemental Material 1.
- The derived variables for our study represented the typical characteristics of members of a community. In previous studies with individual-level analyses, drinking was found to be related to one’s health behavior, psychological factors, social network, and participation in social activities [9,10,12,17]. Therefore, we constructed variables based on the KCHS, which included the rates of current smoking, stress awareness, depression experience, unmet medical needs, religious activity participation, leisure activity participation, age at which one first started drinking, and one’s social network. The current smoking rate is an indicator of health behavior, and the stress awareness and depression experience rates are indicators of psychological factors. In addition, one’s relationship with friends in their social network who engaged as drinking partners was investigated, and the relationship between drinking and religious and leisure activities was investigated to examine social activities. Detailed definitions for each variable are provided in the Supplemental Material 2.
- The integral variables for our study represented the typical collective characteristics of a region and included all aspects of the physical environment, socioeconomic characteristics, cultural characteristics, and different community policies [12]. In this study, community-level variables that were relevant in previous studies regarding drinking were included [9-12]. Furthermore, the number of drinking establishments and park areas in a region, as well as the crude divorce rate, living-alone rate, number of cultural facilities, healthcare and social welfare service business rate, financial independence rate, and healthcare expenditure rate were included. The number of drinking establishments represents alcohol availability in the community, and the number of park areas in the region represents the physical environment of the area. In addition, the crude divorce and living-alone rates were included as demographic factors, and the number of cultural facilities and the healthcare and social welfare service business rate are indicators of cultural characteristics. The financial independence and healthcare expenditure rates represent socioeconomic characteristics and community policy, respectively. Detailed definitions for each variable are provided in the Supplemental Material 2.
- Statistical Analysis
- This study calculated the extremal quotients (EQ) and the coefficients of variation (CV) of the data as well as the small area variation analysis indexes to confirm the distribution and variation by region in 227 counties. The CV is the value obtained by dividing the standard deviation by the mean value and multiplying it by 100, and the EQ is the ratio of the maximum and minimum values. The larger these indicators, the larger the variation between regions [18]. In addition, the Pearson correlation coefficient was calculated to determine the relationship between dependent and independent variables. Only variables with a correlation of r=0.2 or more were included in our regression analysis model. An MLR analysis was conducted with 3 models to determine related factors of the high-risk drinking rate among yearly alcohol users. Model I included only the derived variables, model II only the integral variables, and model III included both the derived and integral variables. Lastly, quantile regression was performed to identify factors related to the high-risk drinking rate among yearly alcohol users for each of the lower 10%, 30%, 50%, 70%, and 90% quantiles. All statistical analyses were performed using SAS version 9.4 (SAS Institute Inc., Cary, NC, USA). Statistical significance was set at p-value <0.05.
- Ethics Statement
- The study was conducted with the approval of the Institutional Review Board of Chungnam National University (201910-SB-189-01).
METHODS
Dependent variable
Independent variables: derived variables
Independent variables: integral variables
- Descriptive Statistics of the Study Sample
- The national high-risk drinking rate average among yearly alcohol users was 19.3%, with an EQ of 4.6 and a CV of 20.8. There was considerable variation between regions, and the gap between regions was generally larger for integral variables than for derived variables. In terms of EQ between regions, the highest variable was the depression experience rate, with an EQ of 229.0; the unmet medical need rate was the highest among the derived variables, with an EQ of 131.0, and park areas (per 1 person) was the highest among the integral variables, with an EQ of 353.2. The indicators with the smallest EQs between regions were the age at which one first began drinking (EQ=1.1) for the derived variables and the crude divorce rate (EQ=2.5) and living-alone rate (EQ=2.5) for the integral variables (Table 1).
- Correlations With the High-risk Drinking Rate
- By analyzing the correlation between the high-risk drinking rate among yearly alcohol users and independent variables, we concluded that, for the derived variables, the current smoking rate (r=0.485, p<0.001), social network with friends (r= 0.381, p<0.001), unmet medical needs rate (r=0.263, p<0.01), and perceived stress rate (r=0.225, p<0.001) were positively correlated, while the religious activity participation rate (r=-0.287, p<0.001) and leisure activity participation rate (r=-0.218, p<0.001) were negatively correlated. Additionally, for the integral variables, there was a positive correlation with the crude divorce rate (r=0.424, p<0.001), whereas there was a negative correlation with the health care and social welfare service business rate (r=-0.234, p<0.001) and financial independence rate (r=-0.206, p<0.01). The health care expenditure rate (r=-0.200, p<0.01) also had a negative correlation (Table 2).
- Factors Related to the High-risk Drinking Rate
- Multiple regression analysis was conducted by dividing the factors related to the high-risk drinking rate among yearly alcohol users into three models. Variance inflation factor values were checked to evaluate multicollinearity, and all were 10 or less; thus, it was determined that there was no multicollinearity. In model I, which included only the derived variables, the explanatory power was approximately 35.4%. As the current smoking rate (p<0.001), social network with friends (p<0.001), and the perceived stress rate (p<0.001) increased, the high-risk drinking rate among yearly alcohol users increased. However, as the leisure activity participation rate (p=0.035) increased, the high-risk drinking rate among yearly alcohol users decreased. In model II, which included only the integral variables, the explanatory power was approximately 22.3%. As the crude divorce rate (p<0.001) increased, the high-risk drinking rate among yearly alcohol users increased, and as the financial independence rate (p=0.002) increased, the high-risk drinking rate among yearly alcohol users decreased. In model III, which included both the derived and integral variables, the effects of the current smoking rate, social network with friends, the crude divorce rate, and the financial independence rate on the high-risk drinking rate among yearly alcohol users were smaller than in models I and II, while the influence of the perceived stress rate was greater than in model I. The explanatory power of model III was about 39.0%, showing the highest explanatory power among the 3 models (Table 3).
- Related Factors by Quantile of High-risk Drinking Rate
- Quantile regression was performed to determine the relevant factors for each quantile regarding the high-risk drinking rate among yearly alcohol users. For the lower 10% quantile, as the perceived stress rate (p=0.001) and the crude divorce rate (p=0.004) increased, the high-risk drinking rate among yearly alcohol users increased. For the lower 30% quantile, as the perceived stress rate (p<0.001), social network with friends (p=0.021), and divorce rate (p=0.033) increased, the religious activity participation rate (p=0.012) decreased, while the high-risk drinking rate among yearly alcohol users increased. For the middle 50% quantile, as the perceived stress rate (p<0.001), social network with friends (p=0.002), and the crude divorce rate (p=0.006) increased, the religious activity participation rate (p=0.002) and the financial independence rate (p=0.046) decreased, while the high-risk drinking rate among yearly alcohol users increased. For the 70% quantile, as the perceived stress rate (p=0.001) and the crude divorce rate (p=0.001) increased and the financial independence rate (p=0.007) decreased, the high-risk drinking rate increased among yearly alcohol users. For the 90% quantile, as the social network with friends (p<0.001) and the crude divorce rate (p=0.016) increased, and the leisure activity participation rate (p=0.032) and the financial independence rate (p=0.017) decreased, the high-risk drinking rate among yearly alcohol users increased. In addition, as the quantile increased, the influence of the stress perception rate decreased, while the influence of financial independence increased. Furthermore, the influence of the crude divorce rate and social network with friends showed U-model and J-model tendencies, respectively (Table 4).
RESULTS
- In 2017, the average national high-risk drinking rate among yearly alcohol users in Korea was 19.3%. In the district with the lowest rate, the rate was 7.7%, and in the district with the highest rate, it was 35.1%, with a maximum difference of 27.4%. Meanwhile, the EQ was 4.6 times the CV of 20.8. The variation in rates and numbers between regions was quite large. The variation was generally found to be considerably larger with regional factors than with individual factors, which reflects the fact that regional differences in the degree of urbanization and the physical environment of regions are significant.
- Korea has a tolerant culture of drinking, and drinking is mainly engaged in through one’s social networks, such as at social gatherings and workplace gatherings [10]. Therefore, taking a collective approach would be most effective when performing public health work in a particular region.
- Excessive drinking in socially unstable areas is thought to occur due to a lack of socioeconomic opportunities and access to medical care, as well as high stress and divorce rates. In addition, it was shown that high-risk drinking is low in areas where religious, social, and cultural activities are more prevalent, as well as in areas where there are substantial budget allocations for health and a large number of businesses. Hence, local communities should actively explore alternative activities to drinking and make efforts to expand health projects and budgets.
- In a 2008 study that used KCHS data, Kim [19] found a relationship between the current smoking rate and stress experience rate, which were included as derived variables, which is consistent with the findings of the present study. The number of drinking establishments and park areas included as integral variables was related to the high-risk drinking rate, but this study did not reveal any statistically significant findings. The characteristics of individuals who reside in a particular region generally do not change much over time, but the regional environment seems to change greatly, depending on socio-cultural factors.
- The current smoking rate, perceived stress rate, social network with friends, crude divorce rate, and financial independence rate were found to be related to the high-risk drinking rate of yearly drinkers, according to our MLR. Meanwhile, the perceived stress rate was found to be related in the lower 10% to 70% quantiles as a result of the quantile regression; social network with friends was found to be related only in the 30%, 50%, and 90% quantiles, and the financial independence rate was found to be related in the 50% to 90% quantiles. The crude divorce rate was a factor related to the high-risk drinking rate among yearly alcohol users in all quantiles. However, the current smoking rate showed no significant relationships in the quantile regression results. The religious activity participation rate was related to both the 30% and 50% quantile, while the leisure activity participation rate was related to the 90% quantiles in the MLR results. The MLR analysis and quantile regression results were similar, but certain differences were confirmed. Therefore, in areas where the crude divorce rate is high, there is a need to encourage health programs to address the high-risk drinking rate. In addition, it was found that stress in the lower quintile, religious activity in the middle quintile, and social network with friends and financial independence rate in the upper quintile were highly related with the high-risk drinking rate.
- This study has some limitations. First, the source of data for the derived variables in this study, the KCHS, is a questionnaire survey, and therefore, it is not an objective measure and includes the subjective opinions of individuals. There was also a limitation to the data, since the survey was completed by about 900 people from all counties, regardless of urban or rural residence. Second, this study did not take into account the various factors that comprise a local social system and used only public data for each county. Third, integral variables have limitations and are difficult to use in local health projects. However, since regional environmental characteristics are closely related to health, it is necessary to consider the crude divorce rate and financial independence rate in regional policies. Fourth, since each individual’s characteristics that affect high-risk drinking cannot be reflected in a study like ours, multilevel analysis studies that consider both individual characteristics and regional characteristics are needed.
- Nonetheless, despite these limitations, this study was able to confirm the distribution of high-risk drinking in counties and related factors by quantile using data from the KCHS and KOSIS. These findings imply the need to implement business plans suitable for the characteristics of the local community to close the gap between the rates of high-risk drinking across regions. As such, to intervene in the health of a local population by preparing strategies for health promotion, it is necessary to grasp the characteristics of the local-level groups analyzed in this study.
DISCUSSION
SUPPLEMENTAL MATERIALS
-
CONFLICT OF INTEREST
The authors have no conflicts of interest associated with the material presented in this paper.
-
FUNDING
This study was funded by the Academic Activity Promotion Program for Identifying and Resolving the Causes of the Interregional Health Gap of the Korean Society for Preventive Medicine.
Notes
ACKNOWLEDGEMENTS
| Variables | r |
|---|---|
| Derived variables | |
| Current smoking rate | 0.485*** |
| Perceived stress rate | 0.225*** |
| Depression experience rate | 0.130 |
| Unmet medical need rate | 0.263** |
| Age at which one first began drinking | -0.045 |
| Religious activity participation rate | -0.287*** |
| Leisure activity participation rate | -0.218*** |
| Social network with friends | 0.381*** |
| Integral variables | |
| No. of drinking establishments | 0.157* |
| Park areas in the region | -0.030 |
| Living alone rate | 0.130 |
| Financial independence rate | -0.206** |
| Healthcare and social welfare service business rate | -0.234*** |
| Healthcare expenditure rate | -0.200** |
| Crude divorce rate | 0.424*** |
| No. of cultural facilities | 0.048 |
| Categories |
Coefficient of quantile regression (SE) |
MLR (SE)1 | ||||
|---|---|---|---|---|---|---|
| 10% | 30% | 50% | 70% | 90% | ||
| Current smoking rate | -0.02 (0.23) | 0.16 (0.15) | 0.24 (0.12) | 0.05 (0.14) | 0.18 (0.23) | 0.21 (0.10)* |
| Perceived stress rate | 0.30 (0.09)** | 0.28 (0.08)*** | 0.25 (0.06)*** | 0.24 (0.07)** | 0.03 (0.09) | 0.23 (0.05)*** |
| Unmet medical need rate | 0.10 (0.10) | -0.03 (0.08) | 0.02 (0.05) | 0.00 (0.07) | 0.20 (0.10) | 0.07 (0.06) |
| Social network with friends | 0.13 (0.08) | 0.11 (0.05)* | 0.12 (0.04)** | 0.14 (0.07) | 0.16 (0.05)*** | 0.13 (0.04)*** |
| Religious activity participation rate | -0.07 (0.09) | -0.13 (0.05)* | -0.12 (0.04)** | -0.06 (0.06) | 0.04 (0.07) | -0.07 (0.04) |
| Leisure activity participation rate | -0.07 (0.05) | -0.04 (0.04) | -0.01 (0.04) | -0.05 (0.05) | -0.12 (0.06)* | -0.03 (0.03) |
| Crude divorce rate | 4.27 (1.46)** | 2.26 (1.06)* | 2.43 (0.88)** | 3.52 (1.08)** | 3.19 (1.32)* | 2.45 (0.76)** |
| Financial independence rate | -0.01 (0.03) | -0.03 (0.02) | -0.04 (0.02)* | -0.06 (0.02)** | -0.07 (0.03)* | -0.04 (0.02)* |
| Healthcare and social welfare service business rate | -0.18 (0.49) | -0.29 (0.40) | 0.02 (0.27) | -0.41 (0.34) | -0.71 (0.39) | -0.36 (0.28) |
| Healthcare expenditure rate | -0.19 (0.35) | -0.30 (0.49) | -0.14 (0.41) | 0.26 (0.48) | 0.29 (0.47) | -0.13 (0.29) |
- 1. Kim JS, Lee JK, Chung SK. Meta-analysis of factors related to problem drinking. J Korean Alcohol Sci 2013;14(2):1-18. (Korean)
- 2. World Health Organization. Global strategy to reduce the harmful use of alcohol. 2010 [cited 2020 Oct 1]. Available from: https://www.who.int/publications/i/item/9789241599931
- 3. World Health Organization. International guide for monitoring alcohol consumption and related harm. 2000 [cited 2020 Oct 1]. Available from: https://apps.who.int/iris/handle/10665/66529
- 4. Korea Centers for Disease Control and Prevention. 2017 Community Health Survey at a glance. Cheongju: Korea Center for Disease Control and Prevention; 2018. (Korean)
- 5. Jung YH, Ko SJ, Lee HG, et al. A study on the social harmfulness of drinking and improvement measures. Seoul: Korean Institute for Health and Social Affairs; 2015. p. 1-224 (Korean)
- 6. Macintyre S, Ellaway A, Cummins S. Place effects on health: how can we conceptualise, operationalise and measure them? Soc Sci Med 2002;55(1):125-139ArticlePubMed
- 7. Pearce N. Traditional epidemiology, modern epidemiology, and public health. Am J Public Health 1996;86(5):678-683ArticlePubMedPMC
- 8. Frohlich KL, Corin E, Potvin L. A theoretical proposal for the relationship between context and disease. Sociol Health Illn 2001;23(6):776-797Article
- 9. Kim KK, JeKarl J, Kwon YM, Park MS. Effects of the community environmental characteristics on drinking problems of adults: a multilevel analysis. Korean J Health Educ Promot 2012;29(5):103-113. (Korean)
- 10. Lee J. Social-environment factors influencing high risk alcohol consumption in local community. Korean J Soc Welf 2015;67(1):165-187. (Korean)Article
- 11. Kwon RA, Shin SS, Shin YJ. The effect of alcohol availability on drinking behavior: a multilevel analysis on urban regions. Korea Soc Policy Rev 2018;25(2):125-163Article
- 12. Jeong JY, Kim C, Shin M, Ryu SY, Hong J, Kim NH, et al. Factors related with regional variations of health behaviors and health status: based on community health survey and regional characteristics data. Korea Public Health Res 2017;43(3):91-108. (Korean)
- 13. Park J, Lee J, Park CG, Lee Y. Factors influencing death anxiety of nursing students. J Korean Data Inf Sci Soc 2018;29(5):1227-1242. (Korean)Article
- 14. Kim YT, Choi BY, Lee KO, Kim H, Chun JH, Kim SY, et al. Overview of Korean Community Health Survey. J Korean Med Assoc 2012;55(1):74-83. (Korean)Article
- 15. Anderson P, Baumberg B. Alcohol in Europe: a public health perspective. 2006 [cited 2020 Oct 1]. Available from: https://ec.europa.eu/health/archive/ph_determinants/life_style/alcohol/documents/alcohol_europe_en.pdf
- 16. Ministry of Health and Welfare. Health plan 2016-2020. Seoul: Korea Health Promotion Institute; 2015. p. 61-78 (Korean)
- 17. Choi HY, Ryu SY. Factors associated with the types of unmet health care needs among the elderly in Korea. Korean J Health Serv Manag 2017;11(2):65-79. (Korean)Article
- 18. Nam JM, Cho WH, Lee SH. A study on the statistical distribution and testing of variation indicies at the small area, variation analysis. Korean J Prev Med 1999;32(1):80-87. (Korean)
- 19. Kim DH. Analysis of small area variation of health behavior using 2008 Community Health Survey in Korea. Seoul: Korea Centers for Disease Control; 2010. p. 1-122 (Korean)
REFERENCES
Figure & Data
References
Citations
- Prevalence and Related Factors of Depression Before and During the COVID-19 Pandemic: Findings From the Korea National Health and Nutrition Examination Survey
Eung-Joon Lee, Seung Jae Kim
Journal of Korean Medical Science.2023;[Epub] CrossRef - Data resource profile: the Korean Community Health Status Indicators (K-CHSI) database
Hye-Eun Lee, Yeon-gyeong Kim, Jin-Young Jeong, Dong-Hyun Kim
Epidemiology and Health.2023; 45: e2023016. CrossRef - Prevalence, awareness, and treatment of depression among community-dwelling stroke survivors in Korea
Eung-Joon Lee, Oh Deog Kwon, Seung Jae Kim
Scientific Reports.2022;[Epub] CrossRef
 PubReader
 ePub Link
 Cite
Cite

