Articles
- Page Path
- HOME > J Prev Med Public Health > Volume 53(6); 2020 > Article
-
Original Article
Public Sector Workers’ Mental Health in Argentina: Comparative Psychometrics of the Perceived Stress Scale -
Agustín Ramiro Miranda1,2
 , Ana Veronica Scotta1,2, Ana Lucía Méndez1, Silvana Valeria Serra1, Elio Andrés Soria2,3
 -
Journal of Preventive Medicine and Public Health 2020;53(6):429-438.
DOI: https://doi.org/10.3961/jpmph.20.229
Published online: October 5, 2020
1School of Phonoaudiology, Faculty of Medical Sciences, National University of Córdoba, Córdoba, Argentina
2National Scientific and Technical Research Council, CONICET, INICSA, Córdoba, Argentina
3Institute of Cell Biology, Faculty of Medical Sciences, National University of Córdoba, Córdoba, Argentina
- Corresponding author: Elio Andrés Soria, MD, PhD National Scientific and Technical Research Council, CONICET, INICSA, Córdoba 5014, Argentina E-mail: easoria@fcm.unc.edu.ar
Copyright © 2020 The Korean Society for Preventive Medicine
This is an Open Access article distributed under the terms of the Creative Commons Attribution Non-Commercial License (http://creativecommons.org/licenses/by-nc/4.0/) which permits unrestricted non-commercial use, distribution, and reproduction in any medium, provided the original work is properly cited.
ABSTRACT
-
Objectives
- Given that Argentinian public-sector workers are highly exposed to stressful conditions, and that the psychometric properties of the widely used Perceived Stress Scale (PSS) should be evaluated in different settings, this work aimed to compare the psychometric properties of the Latin American Spanish PSS-10 and PSS-4 and to identify the optimal scale for stress assessment.
-
Methods
- A sample of 535 participants was randomly divided into 2 groups to evaluate dimensionality by exploratory and confirmatory factor analyses. The reliability of both scales was also evaluated. Convergent validity was estimated using the Executive Complaints Questionnaire, the average variance extracted, and the composite reliability. Discriminant validity was based on the correlation with the Utrecht Work Engagement Scale and the phi-square correlation between the components.
-
Results
- The factor analyses supported bidimensionality of the PSS-10 (stress and coping), which showed a better fit than the PSS-4. Moreover, the reliability of the PSS-10 was higher, whereas the PSS-4 did not achieve adequate values of internal consistency. The PSS-10 was also correlated significantly with all validation scales, and presented proper internal convergent and divergent validity.
-
Conclusions
- The PSS-10 is a reliable and structurally valid instrument to measure perceived stress and coping in a Latin American Spanish-speaking population with high work demands, and the findings of this study expand our knowledge on the geographical and sociocultural applicability of the PSS.
- The study of stress focuses on the identification of environmental stressors, subjective perceptions, cognitive-behavioralaffective reactions, and physiological responses [1]. Self-report questionnaires, such as the Perceived Stress Scale (PSS), are effective instruments for assessing psychological stress. The PSS is based on the transactional theory of stress; this theoretical approach focuses on how individuals perceive stress, which is seen as the result of an imbalance between situational demands and coping resources [2]. The PSS score has been associated with health outcomes, such as hormonal changes, cardiometabolic disease, insomnia, and cognition [3-5].
- The original version of PSS consisted of 14 items [6], which was later shortened into 2 versions: one with 10 items (PSS-10) and another with 4 items (PSS-4) [7]. Several translations and adaptations have been conducted for the lesbian, gay, bisexual and transgender community, workers, students, and peripartum women, among others [1]. This reflects the importance of this scale, which is relatively free of content specific to particular populations. However, instruments are not universal and research must ensure their applicability in more diverse populations and various cultures than those usually studied [1,8].
- The European Spanish versions of the PSS-14 and PSS-10 are reliable and valid instruments [1], and have been culturally adapted for Latin American Spanish in Mexican [1] and Colombian students [9]. However, further studies are needed to assess the reliability and validity of these instruments in other Latin American Spanish-speaking populations, since psychological research performed in students is not appropriate for generalizations to the general public [10].
- Stress in work settings represents a problem for both the employee and the institution [11]. Various groups of workers have a higher prevalence of stress, such as teachers, health workers, and the security forces. Work stress is associated with extended work hours, shift work, a negative public image, curricular demands, and exposure to critical stressors [11-13]. Therefore, psychometric research is required to explore the reliability and validity of instruments for the assessment of stress in workers, in accordance with the recommendations of the World Health Organization [14]. Public-sector employment is characterized by high psychosocial vulnerability, attributable to a high demand to face multiple contingencies in environments of sociocultural and demographic diversity [15,16].
- Overcoming the concept of health as the mere absence of disease, it is important to consider the salutogenic paradigm related to the conservation and investment of resources that a person can achieve to maintain a positive state of health [5]. Hence, the availability of valid instruments is important to generate healthy and favorable work environments, emphasizing the reduction of risk factors in order to achieve higher engagement [5]. Therefore, this work aimed to evaluate the psychometric properties of the PSS-10 and PSS-4 in Argentinian public-sector employees.
INTRODUCTION
- Subjects and Design
- Self-report online questionnaires were administered for this cross-sectional study to 535 public employees from Cordoba (Argentina) recruited by the National University of Cordoba and the Cordoba Province Government during 2018-2019.
- The sample was randomly split into 2 groups to be used for exploratory factor analysis (EFA) or a subsequent confirmatory factor analysis (CFA). EFA was conducted to identify an optimal factor structure, and CFA to confirm the dimensionality. A value of n>200 is a fair indicator of sample size [17]. A recommended sample size of 223 was calculated using the given latent variables (2 components) and the number of observed variables (10 items) to achieve a power of 0.80, an anticipated effect size of 0.20, and a probability level of 0.05.
- Instruments
- The 10-item and 4-item Latin American Spanish PSS versions were used [9]. These easily usable self-report scales assess the level of perceived stress during the last month. The items are rated on a 5-point Likert scale from 0 (never) to 4 (very often). The scores of items 4, 5, 7, and 8 are reversed. The 4-item version (PSS-4) includes items 2, 4, 5, and 10. The total score is obtained as the sum of all items, with scores ranging from 0 to 16 (PSS-4) and from 0 to 40 (PSS-10). Higher scores correspond to higher perceived stress.
- The Executive Complaint Questionnaire (ECQ) explores the subjective complaints of participants judging their own daily behaviors concerning general mental functioning and to what extent they are affected [18]. The 15 items are divided into 3 subscales, which assess the presence of cognitive, behavioral, and emotional symptoms related to the functioning of the prefrontal cortex. Each item was rated on a 5-point Likert scale, from 0 (never) to 4 (always). Factor analysis showed the following subscales: executive attention (items 1, 2, 6, 8, and 11; e.g., “You find it difficult to recall messages after a few minutes”), behavioral flexibility (items 3, 4, 7, 9, 12, 13, and 14; e.g., “You need to be pushed into action to start some activity off”), and inhibitory control (items 5, 10, and 15; e.g., “Your mood might abruptly and remarkably change”). Scores consist of the sum of the corresponding items, and higher scores indicate a higher degree of executive complaints. Similarly to previous studies, internal consistency was adequate (α=0.895). The negative effects of stress on the cognitive state of workers have been extensively investigated, and disturbed executive functioning has been shown to be the most prominent feature of cognitive problems associated with stress [5]. Therefore, the PSS and the ECQ measure related theoretical constructs, and the correlation between their scores would be an indicator of external convergent validity.
- The Spanish version of the Utrecht Work Engagement Scale (UWES) was used to assess work engagement [19]. The 17-item version showed 3 dimensions: vigor (items 1, 4, 8, 12, 15, and 17; e.g., “At my work I always persevere, even when things do not go well”), dedication (items 2, 5, 7, 10, and 13; e.g., “I find the work that I do full of meaning and purpose”), and absorption (items 3, 6, 9, 11, 14, and 16; e.g., “When I am working, I forget everything else around me”). Each item was rated on a 7-point Likert scale, from 0 (never) to 6 (every day). Scores were transformed on a scale ranging from 0 to 102, with higher scores indicating higher engagement. Previous studies confirmed the psychometric properties of this instrument [19,20]. In this study, its internal consistency was acceptable (α=0.933). Similar to previous studies, the UWES was used to assess the external discriminant/divergent validity of the PSS due to the inverse relationship that exists between both theoretical constructs. There is evidence that daily life stressors have an impact on the well-being and productivity of employees, and we therefore anticipated the PSS-10 to be negatively associated with the UWES [21].
- Demographic data were collected from each participant (age, educational level, marital status, gender, occupation, working hr/d, years of service, working shift, medical disease).
- Statistical Analysis
- Data analysis was performed using Stata version 13 (StataCorp., College Station, TX, USA). For EFA, data were analyzed using oblimin-rotated factor analysis (i.e., principal component analysis). The Kaiser–Meyer–Olkin (KMO) test and the Bartlett test of sphericity (BTS) were applied to verify data adjustment [18]. Components were retained based on the criterion of an eigenvalue of 1.0 and the examination of a scree plot. Loadings >0.60 were considered to contribute significantly. The uniqueness (U) was analyzed for every item. U is the percentage of variance for a variable that is not explained by the common factors; thus, it is a useful parameter to study an item’s contribution to the final solution. U should be interpreted as commonality = 1-U. Therefore, a value of U closer to 1 indicates that the item should be removed, and a U value <0.60 represents an adequate contribution of the item [22]. The proportion of variance explained was also calculated, and a solution that represented at least 60% of the total variance was considered to be satisfactory [23]. The absence of multicollinearity and singularity within the dataset was checked by the squared multiple correlation (SMC): items with SMC values close to 0 indicate singularity, while those with values close to 1 should be removed because of multicollinearity [24].
- The CFA was performed in the second split sample, using maximum-likelihood structural equation modeling techniques. Goodness-of-fit indices were calculated for both PSS versions using unidimensional and bidimensional (extracted from EFA) models, as follows: the chi-square to degree of freedom ratio (χ2/df), root mean square error of approximation (RMSEA), comparative fit index (CFI), Tucker–Lewis index (TLI), standardized root mean square residual (SRMR), coefficient of determination (CD), Akaike information criterion (AIC), and Bayesian information criterion (BIC) [18]. Modification indices, which show additional relationships by pairing error terms, were used to improve the goodness-of-fit [25]. Once the model was estimated, the Stata software recommended the parameters that covaried, and data fit was improved by pairing error terms. However, only those with a theoretical basis should be accepted. Then, a bifactor model was tested to determine whether the measure was sufficiently unidimensional to support using a total score, while still accounting for the multidimensionality that was found [26].
- Finally, reliability and validity were assessed. The Cronbach α was calculated for the overall scale and for the subscales identified, with acceptable values ranging from 0.60 to 0.95 [18]. In addition, inter-item correlations were calculated to detect possible redundancy among items (r>0.80) [27]. Construct validity was defined as the presence of substantial and significant correlations between different instruments designed to assess a common (convergent) and different (divergent) construct [28]. For this purpose, 2-tailed Pearson correlation coefficients were calculated for the PSS versions and the ECQ to ascertain the convergent validity, whereas the UWES was used to study their divergent validity. Positive correlations were considered to furnish evidence of convergent validity, while negative correlations and the absence of correlation were considered evidence of an absence of validity [29]. In addition, convergent and discriminant internal validity was also studied. The average variance extracted (AVE) and composite reliability (CR) were used to inform convergent validity, according to Hair et al. [23], Values of AVE >0.5 and CR≥0.7 indicate adequate convergent validity. To determine discriminant validity (whether each component measures a different dimension from the rest), phi-square coefficients (φ2) were calculated to measure the degree of association between components. If φ2 is close to 0 and less than the AVE, discriminant validity has been achieved [30].
- Ethics Statement
- All procedures were approved by the institutional ethics committee in accordance with the Declaration of Helsinki. Participants voluntarily provided informed consent to be included anonymously.
METHODS
- Demographic Characteristics
- The demographic and occupational variables are shown in Table 1. The participants were mostly female, 30-49 years old, in couples, of high educational level, and healthy. The majority were teachers, worked 5-9 hr/d, worked morning shifts, and had 10-14 years of experience. There were no significant differences between samples.
- Exploratory Factor Analysis
- Regarding the PSS-10 structure (Table 2), the KMO test showed that the sample was adequate for an EFA (KMO=0.855), and BTS showed adequate results (χ2(45)=968.852, p<0.001). The EFA resulted in a 2-component model according to eigenvalues, a scree plot, and information criteria. In the bidimensional solution, all items had loadings >0.60. The first component, named “stress,” showed high loadings for items 1, 2, 3, 6, 9, and 10, which explained 34% of the variance. Component 2, named “coping,” had high loadings for items 4, 5, 7, and 8, explaining 26% of the variance. The U and SMC showed the absence of multicollinearity and singularity; thus, no item had to be removed.
- PSS-4 showed a similar structure: a first component, stress (items 2 and 10), explained 38% of the variance, and a second one, coping (items 4 and 5), accounted for 38% of the variance (Table 2). The correlation matrix of variables was not an identity matrix since the BTS was adequate (χ2(6)=179.000, p<0.001). However, this version did not achieve a good KMO value (0.572).
- Confirmatory Factor Analysis
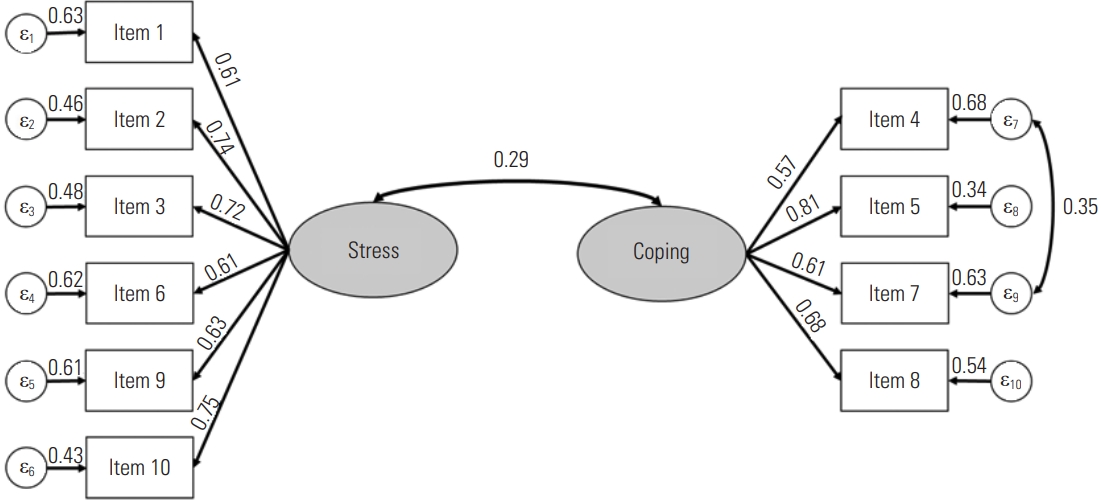
- Goodness-of-fit measures are shown in Table 3 for CFA with unidimensional and bidimensional models. The indices confirmed that PSS-10 has a bidimensional structure, while PSS-4 is unidimensional. The 2-component model of the PSS-10 showed the best data fit. All the indices achieved recommended values in accordance with the cut-off criteria: χ2/df=2.111, RMSEA= 0.064, CFI=0.958, TLI=0.942, SRMR=0.050, CD=0.964, and low AIC and BIC. Figure 1 demonstrates the measurement model. Moreover, CFA supported a bifactor structure for PSS-10, which demonstrated a superior fit. Since the items assessed conceptually linked processes, the suggestions made by the Stata software were accepted: item 4 (“Confident about your ability to handle your personal problems?”) was grouped with item 7 (“Dealt successfully with irritating life hassles?”). The standardized regressions were significant (T>1.96), ranging from 0.61 to 0.75 for component 1 and from 0.57 to 0.81 for component 2. The inter-component covariation was 0.29.
- Internal Consistency
- Higher internal consistency was found for the entire PSS-10 than for the PSS-4 (α=0.810 and 0.592, respectively), as well as for stress (α=0.832 vs. 0.680) and coping (α=0.806 vs. 0.674) (Table 4). All item-total correlations were over 0.30. Overall, α decreased if any item was deleted. The mean of the inter-item correlations of the stress and coping factors (for the PSS-10) were 0.44 and 0.51, respectively.
- Convergent and Divergent Validity
- The correlations between the PSS and UWES were analyzed to assess divergent validity. The total scores of PSS-10 were inversely correlated with the total UWES (r=-0.35, p<0.001), vigor (r=-0.37, p<0.001), dedication (r=-0.37, p<0.001), and absorption (r=-0.27, p<0.001). Lower correlation coefficients were found between the total PSS-4 and vigor (r=-0.33, p< 0.001), dedication (r=-0.30, p<0.001), absorption (r=-0.20, p<0.001), and total UWES (r=-0.30, p<0.001).
- Regarding convergent validity, the PSS-10 showed significant positive correlations with the ECQ (r=0.61, p<0.001), executive attention (r=0.54, p<0.001), behavioral flexibility (r= 0.53, p<0.001), and inhibitory control (r=0.43, p<0.001). Similarly, the PSS-4 score was also positively correlated with the ECQ (r=0.49, p<0.001), executive attention (r=0.42, p<0.001), behavioral flexibility (r=0.44, p<0.001), and inhibitory control (r=0.32, p<0.001).
- The PSS-10 showed values of AVE of 0.46 for both components, and CR values of 0.84 for stress and 0.80 for coping, whereas the φ2 value of 0.085 indicated that there was no problem with internal discriminant validity. It was not possible to estimate these statistics for the PSS-4 because the 2-component model did not converge.
RESULTS
- This study examined the psychometric properties (dimensionality, reliability, and validity) of 2 Spanish versions of the PSS. No previous evidence has been reported regarding its psychometric properties in working adults, although it is widely used in Argentina. Our results show that the most adequate version is the PSS-10, which is structurally bidimensional. Conversely, the PSS-4 should be interpreted in a 1-dimensional way.
- The EFA identified 2-component models in both versions, according to the model-selection criteria. This bidimensionality was also found in studies conducted in other populations. The first component, stress (named “perceived helplessness” or “distress” by other authors), which focuses on the perceived lack of control over the situation, comprised 6 items in PSS-10 and 2 in the PSS-4 [21,30]. The second component, coping [31], also known as “perceived self-efficacy,” is defined as the set of cognitive and behavioral strategies necessary to manage stressful situations [21]. Recently, a bidimensional model (perceived distress and perceived coping) was confirmed in a sample of early childhood teacher candidates [32].
- Although in both questionnaires the factor loadings were high and components could explain more than 60% of the variance, CFA revealed that the 2-component model of PSS-10 had a better fit. This is similar to previous reports demonstrating that PSS-10 is a structurally valid questionnaire with 2 dimensions, while PSS-4 does not comply with statistical recommendations [21,31,33-35].
- Differences in reliability were also found. The PSS-10 showed satisfactory internal consistency globally and for each component, whereas the PSS-4 did not achieve acceptable values. No significant improvement was found after item removal. Ezzati et al. [31] found that the reliability of the scale deteriorated after item reduction. Consequently, a reduction in the α coefficients was observed for the total scale and its stress and coping domains when comparing both PSS versions. Regarding dimensionality, no ambiguity was identified by inter-item correlations, which indicates that no item should be deleted. Similar to previous studies [26,36], the bifactor model found might indicate the existence of perceived stress as an underlying dimension on which the total PSS-10 score depends.
- When assessing divergent validity, the PSS-10 was inversely correlated with work well-being (engagement, vigor, dedication, and absorption). These findings are consistent with research on work stress [5,21]. Convergent validity was also tested by calculating the associations between PSS-10 and executive concerns. The PSS-10 was directly correlated with general executive complaints, executive attention, behavioral flexibility, and inhibitory control. Subjective executive complaints are associated with poor fronto-executive performance, and are influenced by psychological stress [5,18]. Thus, these results are indicative of the concurrent validity of PSS-10. The PSS is based on the transactional theory of stress [2]. This theoretical model emphasizes the importance of cognitive evaluation in the interpretation of stressful situations. In this sense, coping strategies consist of cognitive and behavioral resources intended to cope with stressors, giving meaning that contributes to reducing and controlling stress [37]. The cognitive processes that analyze environmental demands are part of executive functions. These top-down mental processes include inhibition and interference control, working memory, cognitive flexibility, and correction of behavior based on environmental feedback [38]. Thus, the neurological, physiological, and psychological mechanisms through which stress is related to executive functions have become the focus of increasing interest [5,18]. The decision to choose between unidimensional or bidimensional structures should depend on the empirical questions of the researchers [39].
- Regarding the internal convergent validity of the PSS-10, the AVE values were below cut-off points (0.50), but the CR values were ≥0.80. In accordance with Fornell and Larcker [40], with an AVE<0.50 and a CR>0.60, the convergent validity of the construct was still adequate. Internal discriminant validity was also achieved because components were poorly correlated. Although the PSS-4 was correlated with external measures (ECQ and UWES), which partially accounted for its divergent and convergent validity, the instrument had internal validity problems, demonstrating the superiority of the 10-item version.
- Some limitations need to be addressed. First, the assessment of construct validity can be improved by including physiological markers or behavioral assessments. Second, the highly educated sample and the high female-to-male sex ratio might limit generalizability to other audiences. Thus, further studies are encouraged with heterogeneous populations. Third, discriminant validity should be assessed by future studies using validated instruments specific for stress, and test-retest reliability should be considered. Finally, in order to enhance our study’s clinical applicability, future research on specific clinical populations should be conducted.
- In conclusion, the Latin American Spanish version of the PSS-10 was demonstrated to be a bidimensional instrument that is reliable and valid for assessing stress in workers. In contrast, the PSS-4 did not achieve adequate psychometric properties. Thus, we recommend the use of the 10-item version for research in occupational health to assess both stress and coping.
DISCUSSION
-
CONFLICT OF INTEREST
The authors have no conflicts of interest associated with the material presented in this paper.
-
FUNDING
The paper was provided by Secretaría de Ciencia y Tecnología, Universidad Nacional de Córdoba (grant No. SECYT-UNC 411/ 2018-472/2018), and Agencia Nacional de Promoción Científica y Tecnológica (grant No. PICT-2016-2846, FONCYT, RESOL2017-285-APN- DANPCYT#MCT).
Notes
ACKNOWLEDGEMENTS
-
AUTHOR CONTRIBUTIONS
Conceptualization: ARM, AVS, ALM, SVS, EAS. Data curation: ARM, AVS. Formal analysis: ARM. Funding acquisition: EAS. Methodology: ARM, AVS, ALM, SVS, EAS. Project administration: SVS, EAS. Writing – original draft: ARM, AVS. Writing – review & editing: ARM, AVS, ALM, SVS, EAS.
Notes

| Items |
PSS-10 |
PSS-4 |
||||||
|---|---|---|---|---|---|---|---|---|
| C1 | C2 | U | SMC | C1 | C2 | U | SMC | |
| Item 1: Upset by something happening unexpectedly? | 0.7222 | -0.031 | 0.478 | 0.381 | - | - | - | - |
| Item 2: Unable to control the important things in your life? | 0.6812 | 0.241 | 0.479 | 0.375 | 0.8332 | 0.165 | 0.278 | 0.263 |
| Item 3: Nervous and stressed? | 0.8012 | 0.013 | 0.359 | 0.472 | - | - | - | - |
| Item 4: Confident about your ability to handle your personal problems? | -0.083 | 0.8102 | 0.338 | 0.399 | -0.015 | 0.8962 | 0.197 | 0.274 |
| Item 5: Things were going your way? | 0.167 | 0.8022 | 0.330 | 0.468 | 0.254 | 0.8292 | 0.249 | 0.329 |
| Item 6: Could not cope with all the things that you had to do? | 0.6482 | 0.179 | 0.548 | 0.338 | - | - | - | - |
| Item 7: Dealt successfully with irritating life hassles? | 0.119 | 0.8592 | 0.248 | 0.549 | - | - | - | - |
| Item 8: You were on top of things? | 0.377 | 0.6962 | 0.374 | 0.468 | - | - | - | - |
| Item 9: Angered because of things that were outside your control? | 0.7572 | 0.055 | 0.424 | 0.413 | - | - | - | - |
| Item 10: Difficulties were piling up so high that you could not overcome them? | 0.7362 | 0.192 | 0.422 | 0.453 | 0.8662 | 0.044 | 0.248 | 0.241 |
| Eigenvalue | 3.951 | 2.051 | - | - | 1.887 | 1.419 | - | - |
| Variance | 0.335 | 0.265 | - | - | 0.381 | 0.377 | - | - |
| Cumulative variance | 0.335 | 0.600 | - | - | 0.381 | 0.758 | - | - |
| AIC | 392.10 | 77.32 | - | - | 87.55 | NA | - | - |
| BIC | 427.90 | 145.40 | - | - | 101.90 | NA | - | - |
PSS, Perceived Stress Scale; C1, component 1 (stress); C2, component 2 (coping); U, uniqueness; SMC, squared multiple correlation; AIC, Akaike information criterion; BIC, Bayesian information criterion; NA, not applicable.
1 The extraction method used was principal axis factoring; The rotation method was oblimin.
2 Factor loadings of more than 0.60.
| Models | Expected values |
PSS-10 |
PSS-4 |
||||
|---|---|---|---|---|---|---|---|
| Unidimensional | Bidimensional1 | Bifactor analysis1 | Unidimensional | Bidimensional | Bifactor analysis | ||
| χ2/df | <2.50 | 10.080 | 2.111 | 1.731 | 39.780 | Convergencenot achieved | Convergencenot achieved |
| RMSEA | <0.08 | 0.184 | 0.064 | 0.053 | 0.380 | ||
| CFI | >0.90 | 0.635 | 0.958 | 0.979 | 0.584 | ||
| TLI | >0.90 | 0.530 | 0.942 | 0.961 | 0.248 | ||
| SRMR | <0.05 | 0.142 | 0.050 | 0.039 | 0.129 | ||
| CD | >0.95 | 0.848 | 0.964 | 0.979 | 0.768 | ||
| AIC | The lower the better | 6722.53 | 6443.33 | 6320.55 | 2836.22 | ||
| BIC | 6830.37 | 6558.37 | 6467.17 | 2879.35 | |||
PSS, Perceived Stress Scale; χ2/df, chi-square to degree of freedom ratio; RMSEA, root mean square error of approximation; CFI, comparative fit index; TLI, Tucker–Lewis index; SRMR, standardized root mean square residual; CD, coefficient of determination; AIC, Akaike information criterion; BIC, Bayesian information criterion.
1 Represents acceptable values.
| Item |
α |
Inter-item correlation |
ICC PSS-10 |
ICC PSS-4 |
||||||||||||
|---|---|---|---|---|---|---|---|---|---|---|---|---|---|---|---|---|
| PSS-10 | PSS-4 | 1 | 2 | 3 | 4 | 5 | 6 | 7 | 8 | 9 | 10 | C1 | C2 | C1 | C2 | |
| 1 | 0.799 | - | 1.000 | 0.000* | 0.000* | 0.084 | 0.008* | 0.000* | 0.444 | 0.000* | 0.000* | 0.000* | - | - | - | - |
| 2 | 0.783 | 0.514 | 0.449 | 1.000 | 0.000* | 0.058 | 0.000* | 0.000* | 0.000* | 0.000* | 0.000* | 0.000* | - | - | - | - |
| 3 | 0.784 | - | 0.537 | 0.503 | 1.000 | 0.653 | 0.000* | 0.000* | 0.011* | 0.000* | 0.000* | 0.000* | - | - | - | - |
| 4 | 0.813 | 0.586 | -0.075 | 0.082 | 0.020 | 1.000 | 0.000* | 0.208 | 0.000* | 0.000* | 0.269 | 0.259 | - | - | - | - |
| 5 | 0.791 | 0.449 | 0.114 | 0.219 | 0.220 | 0.508 | 1.000 | 0.000* | 0.000* | 0.000* | 0.000* | 0.000* | - | - | - | - |
| 6 | 0.791 | - | 0.358 | 0.420 | 0.406 | 0.055 | 0.157 | 1.000 | 0.002* | 0.000* | 0.000* | 0.000* | - | - | - | - |
| 7 | 0.798 | - | 0.033 | 0.158 | 0.110 | 0.577 | 0.553 | 0.136 | 1.000 | 0.000* | 0.002* | 0.000* | - | - | - | - |
| 8 | 0.786 | - | 0.154 | 0.292 | 0.248 | 0.382 | 0.525 | 0.265 | 0.518 | 1.000 | 0.000* | 0.000* | - | - | - | - |
| 9 | 0.789 | - | 0.370 | 0.435 | 0.497 | 0.048 | 0.171 | 0.407 | 0.133 | 0.213 | 1.000 | 0.000* | - | - | - | - |
| 10 | 0.780 | 0.525 | 0.395 | 0.515 | 0.503 | 0.049 | 0.226 | 0.500 | 0.169 | 0.306 | 0.512 | 1.000 | - | - | - | - |
| Total | 0.810 | 0.592 | - | - | - | - | - | - | - | - | - | - | 0.840 | 0.726 | 0.735 | 0.800 |
| C1 | 0.832 | 0.680 | - | - | - | - | - | - | - | - | - | - | 1.000 | 0.236 | 1.000 | 0.182 |
| C2 | 0.806 | 0.674 | - | - | - | - | - | - | - | - | - | - | 0.236 | 1.000 | 0.182 | 1.000 |
- 1. Lee EH. Review of the psychometric evidence of the perceived stress scale. Asian Nurs Res (Korean Soc Nurs Sci) 2012;6(4):121-127ArticlePubMed
- 2. Chiu YH, Lu FJ, Lin JH, Nien CL, Hsu YW, Liu HY. Psychometric properties of the Perceived Stress Scale (PSS): measurement invariance between athletes and non-athletes and construct validity. PeerJ 2016;4: e2790ArticlePubMedPMCPDF
- 3. Schliep KC, Mumford SL, Vladutiu CJ, Ahrens KA, Perkins NJ, Sjaarda LA, et al. Perceived stress, reproductive hormones, and ovulatory function: a prospective cohort study. Epidemiology 2015;26(2):177-184ArticlePubMedPMC
- 4. Palagini L, Bruno RM, Cheng P, Mauri M, Taddei S, Ghiadoni L, et al. Relationship between insomnia symptoms, perceived stress and coping strategies in subjects with arterial hypertension: psychological factors may play a modulating role. Sleep Med 2016;19: 108-115ArticlePubMed
- 5. Miranda AR, Rivadero L, Bruera JÁ, Villarreal V, Bernio LY, de los Ángeles Baydas L, et al. Examining the relationship between engagement and perceived stress-related cognitive complaints in the Argentinian working population. Eur J Psychol 2020;16(1):12-31ArticlePubMedPMC
- 6. Cohen S, Kamarck T, Mermelstein R. A global measure of perceived stress. J Health Soc Behav 1983;24(4):385-396ArticlePubMed
- 7. Cohen S, Williamson G. Perceived stress in a probability sample of the United States. In: Spacapan S, Oskamp S, editors. The social psychology of health: 4th Claremont symposium on applied social psychology. Newbury Park: Sage; 1988. p. 31-67
- 8. Agranovich AV, Puente AE. Do Russian and American normal adults perform similarly on neuropsychological tests? Preliminary findings on the relationship between culture and test performance. Arch Clin Neuropsychol 2007;22(3):273-282ArticlePubMedPDF
- 9. Campo-Arias A, Bustos-Leiton GJ, Romero-Chaparro A. Internal consistency and dimensionality of the perceived stress scale (PSS-10 and PSS-14) in a sample of female university students in Bogotá, Colombia. Aquichan 2009;9(3):271-280. (Spanish)
- 10. Hanel PH, Vione KC. Do student samples provide an accurate estimate of the general public? PLoS One 2016;11(12):e0168354ArticlePubMedPMC
- 11. Cárdenas Rodríguez M, Méndez Hinojosa LM, González Ramírez MT. Performance, stress, burnout and personal variables of university teachers. Educere 2014;18(60):289-302. (Spanish)
- 12. Purcell SR, Kutash M, Cobb S. The relationship between nurses’ stress and nurse staffing factors in a hospital setting. J Nurs Manag 2011;19(6):714-720ArticlePubMed
- 13. West C, Fekedulegn D, Andrew M, Burchfiel CM, Harlow S, Bingham CR, et al. On-duty nonfatal injury that lead to work absences among police officers and level of perceived stress. J Occup Environ Med 2017;59(11):1084-1088ArticlePubMedPMC
- 14. Houtman I, Jettinghof K, Cedillo L. Raising awareness of stress at work in developing countries: advice to employers and worker representatives. 2007 [cited 2020 Apr 9]. Available from: https://apps.who.int/iris/handle/10665/42956
- 15. Patlán-Pérez J. Effect of psychosocial risks on job satisfaction and psychosomatic disorders in workers of the public sector. RECAI 2019;8(21):20-47. (Spanish)Article
- 16. Vammen MA, Mikkelsen S, Forman JL, Hansen ÅM, Bonde JP, Grynderup MB, et al. Emotional demands and exhaustion: cross-sectional and longitudinal associations in a cohort of Danish public sector employees. Int Arch Occup Environ Health 2019;92(5):639-650ArticlePubMedPDF
- 17. VanVoorhis CW, Morgan BL. Understanding power and rules of thumb for determining sample sizes. Tutor Quant Methods Psychol 2007;3(2):43-50Article
- 18. Miranda AR, Rivadero L, Serra SV, Soria EA. Multidomain self-report assessment of fronto-executive complaints in Spanish-speaking adults. Psychol Neurosci 2019;13(3):357-374ArticlePDF
- 19. Spontón C, Medrano LA, Maffei L, Spontón M, Castellano E. Validation of the engagement questionnaire UWES for the population of workers of Córdoba, Argentina. Liber 2012;18(2):147-154. (Spanish)
- 20. Schaufeli WB, Salanova M, González-Romá V, Bakker AB. The measurement of engagement and burnout: a two sample confirmatory factor analytic approach. J Happiness Stud 2002;3(1):71-92Article
- 21. Ng SM. Validation of the 10-item Chinese perceived stress scale in elderly service workers: one-factor versus two-factor structure. BMC Psychol 2013;1(1):9ArticlePubMedPMCPDF
- 22. Lloret-Segura S, Ferreres-Traver A, Hernandez-Baeza A, Tomas-Marco I. Exploratory item factor analysis: a practical guide revised and updated. An Psicol 2014;30(3):1151-1169
- 23. Hair JF, Black WC, Babin BJ, Anderson RE. Multivariate data analysis. 7th ed. Harlow: Pearson Education; 2014. p. 627-784
- 24. Yong AG, Pearce S. A beginner’s guide to factor analysis: focusing on exploratory factor analysis. Tutor Quant Methods Psychol 2013;9(2):79-94Article
- 25. Soh YX, Razak NK, Cheng LJ, Lau Y. Determinants of childbirth self-efficacy among multi-ethnic pregnant women in Singapore: a structural equation modelling approach. Midwifery 2020;87: 102716ArticlePubMed
- 26. Wu SM, Amtmann D. Psychometric evaluation of the perceived stress scale in multiple sclerosis. Int Sch Res Notices 2013;2013: 608356ArticlePDF
- 27. Sun R, Rohay JM, Sereika SM, Zheng Y, Yu Y, Burke LE. Psychometric evaluation of the barriers to healthy eating scale: results from four independent weight loss studies. Obesity (Silver Spring) 2019;27(5):700-706ArticlePubMedPMC
- 28. Duckworth AL, Kern ML. A meta-analysis of the convergent validity of self-control measures. J Res Pers 2011;45(3):259-268ArticlePubMedPMC
- 29. Acuña I, Michelini Y, Guzmán JI, Godoy JC. Assessment of convergent and discriminant validity in computerized decision-making tests. Aval Psicol 2017;16(3):375-383. (Spanish)ArticlePDF
- 30. Zarantonello L, Pauwels-Delassus V. The handbook of brand management scales. 1st ed. New York: Routledge; 2015. p. 29-30
- 31. Ezzati A, Jiang J, Katz MJ, Sliwinski MJ, Zimmerman ME, Lipton RB. Validation of the Perceived Stress Scale in a community sample of older adults. Int J Geriatr Psychiatry 2014;29(6):645-652ArticlePubMed
- 32. Lee B, Jeong HI. Construct validity of the perceived stress scale (PSS-10) in a sample of early childhood teacher candidates. Psychiatr Clin Psychopharmacol 2019;29(1):76-82Article
- 33. Mondo M, Sechi C, Cabras C. Psychometric evaluation of three versions of the Italian Perceived Stress Scale. Curr Psychol 2019. doi: https://doi.org/10.1007/s12144-019-0132-8ArticlePDF
- 34. Reyna C, Mola DJ, Correa PS. Perceived Stress Scale: psychometric analysis from CTT and IRT. Anxiety Stress 2019;25(2):138-147. (Spanish)
- 35. Reis RS, Hino AA, Añez CR. Perceived stress scale: reliability and validity study in Brazil. J Health Psychol 2010;15(1):107-114ArticlePubMed
- 36. Denovan A, Dagnall N, Dhingra K, Grogan S. Evaluating the Perceived Stress Scale among UK university students: implications for stress measurement and management. Stud High Educ 2019;44(1):120-133Article
- 37. Cruz-Fierro N, Gonzalez-Ramirez MT, Vanegas-Farfano MT. Structural model to explain bruxism from the transactional stress theory. Anxiety Stress 2018;24(2-3):53-59. (Spanish)
- 38. Miranda AR, Franchetto Sierra J, Martínez Roulet A, Rivadero L, Serra SV, Soria EA. Age, education and gender effects on Wisconsin card sorting test: standardization, reliability and validity in healthy Argentinian adults. Neuropsychol Dev Cogn B Aging Neuropsychol Cogn 2019;27(6):807-825ArticlePubMed
- 39. Reis D, Lehr D, Heber E, Ebert DD. The German version of the Perceived Stress Scale (PSS-10): evaluation of dimensionality, validity, and measurement invariance with exploratory and confirmatory bifactor modeling. assessment 2019;26(7):1246-1259ArticlePubMed
- 40. Fornell C, Larcker DF. Evaluating structural equation models with unobservable variables and measurement error. J Mark Res 1981;18(1):39-50Article
REFERENCES
Figure & Data
References
Citations
- Psychometric properties of the Perceived Stress Scale (PSS-10) in silica-exposed workers from diverse cultural and linguistic backgrounds
Fiona Hore-Lacy, StellaMay Gwini, Deborah C. Glass, Christina Dimitriadis, Javier Jimenez-Martin, Ryan F. Hoy, Malcolm R. Sim, Karen Walker-Bone, Jane Fisher
BMC Psychiatry.2024;[Epub] CrossRef - Antecedents of Work Engagement in the Public Sector: A Systematic Literature Review
Norfadhillaton Zahari, Maniam Kaliannan
Review of Public Personnel Administration.2023; 43(3): 557. CrossRef - Reliability and validity of a widely-available AI tool for assessment of stress based on speech
Batul A. Yawer, Julie Liss, Visar Berisha
Scientific Reports.2023;[Epub] CrossRef - Insomnia is associated with worry, cognitive avoidance and low academic engagement in Argentinian university students during the COVID-19 social isolation
Ana Veronica Scotta, Mariela Valentina Cortez, Agustín Ramiro Miranda
Psychology, Health & Medicine.2022; 27(1): 199. CrossRef - COVID-19-related stress in postpartum women from Argentina during the second wave in 2021: Identification of impairing and protective factors
Agustín R. Miranda, Mariela V. Cortez, Ana V. Scotta, Elio A. Soria
Midwifery.2022; 108: 103290. CrossRef - Memory enhancement in Argentinian women during postpartum by the dietary intake of lignans and anthocyanins
Agustín R. Miranda, Mariela V. Cortez, Ana V. Scotta, Luisina Rivadero, Silvana V. Serra, Elio A. Soria
Nutrition Research.2021; 85: 1. CrossRef - Triggering of postpartum depression and insomnia with cognitive impairment in Argentinian women during the pandemic COVID-19 social isolation in relation to reproductive and health factors
Agustín Ramiro Miranda, Ana Veronica Scotta, Mariela Valentina Cortez, Elio Andrés Soria
Midwifery.2021; 102: 103072. CrossRef - Physician perceptions of stress and telemedicine
Jenna Guma, Katelyn Klimowich, Juming Pan, Philip Collins, Danielle Cooley
Osteopathic Family Physician.2021;[Epub] CrossRef
 PubReader
 ePub Link
 Cite
Cite